Shared posts
30 Sep 13:30
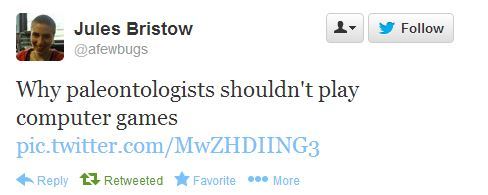
TIL there are pictures of Knights fighting Snails in old Medieval manuscripts - and nobody knows why
 |
submitted by Nudelwalker [link] [82 comments] |
Kentaro Mori, Massa likes this
25 Sep 12:02
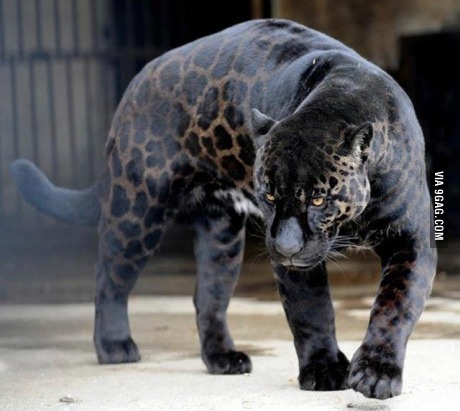
rurone: biologizeable: I can relate to this on every level I...
Jagripino, Babi de Lima and 7 others like this

18 Sep 14:49


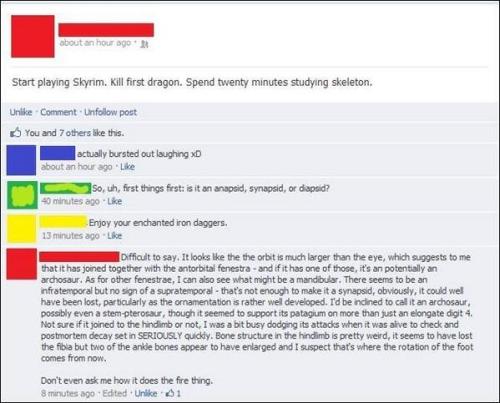
Astronaut’s astounding ISS mission photos
by Arnold Chao


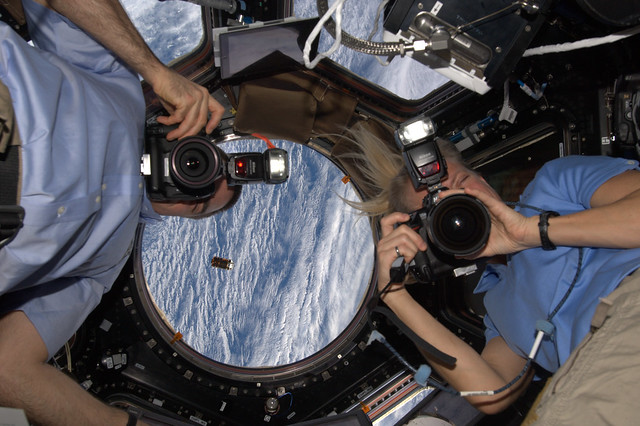
Thanks to the European Space Agency (ESA), a photostream shared by Italian astronaut Luca Parmitano documents his six-month Volare mission at the International Space Station (ISS). Parmitano provides extraordinary views of Earth’s geographic features and candid shots of a cosmonaut’s daily life, including a selfie shot during his first spacewalk and floating over colleagues at Sunday dinner. Seen from the “window of the world” spot on the ISS, a Bolivian snowy peak resembles a snowflake and a South Pacific budding storm appears like the top of a white rose. The sights captured in his mission photos are nothing short of astounding, and we look forward to seeing more from his expeditions.
Igor Santos, firehose and 14 others like this
09 Sep 23:42
"A healthy relationship is one where two independent people just make a deal that they will help make..."
by wagatwe
“A healthy relationship is one where two independent people just make a deal that they will help make the other person the best version of themselves.”
- Unknown (via illiturates)
- Unknown (via illiturates)
Giseli.ramos, Lori likes this

27 Aug 11:28

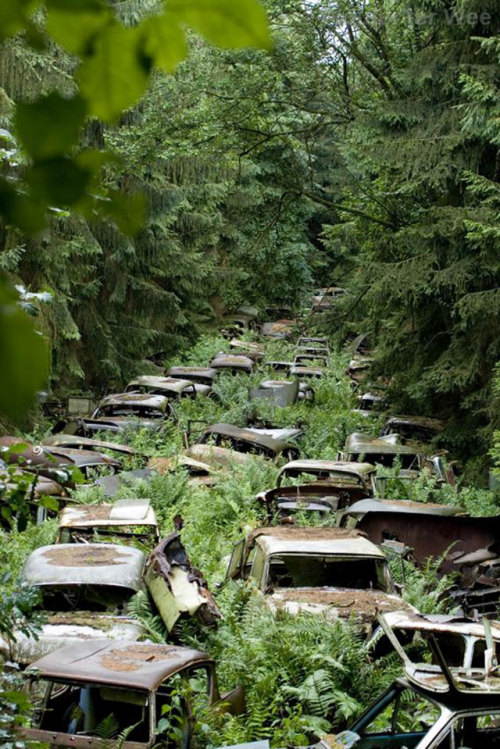


amroyounes: Growing up, my most fond memories was visiting...
Growing up, my most fond memories was visiting abandoned places with my brother. To this day, if opportunity presents itself, I bring my camera and take a few pictures. These are not my work ofcourse, but I hope you enjoy the visual beauty and maybe it brings fond memories of your own adventures.
Part II:
- Abandoned Construction of Nuclear Power Plant. Photo By brokenview
- Chatillon Car Graveyard in Belgium
- Jiancing Historic Trail in Taipingshan National Forest in Taiwan. Photo By T.-C
- Abandoned theme park in nara dreamland, japan. Photo by michaeljohngrist
- Clock tower
- Old shack in a snow field, Idaho. Photo By James Neeley
- Abandoned terminal at Nicosia Airport. Photo By eyesfutur
- Milan, New Orleans. Photo By JustUptown
- Abandoned church in autumn. Photo by *CainPascoe
- Abanonded steam engine in Uyuni train cemetery, Bolivia. Photo By jimmyharris
Renato Cerqueira, Tadeu and 10 others like this
27 Aug 11:23


11 Untranslatable Words From Other Cultures
by Ella Sanders
The relationship between words and their meaning is a fascinating one, and linguists have spent countless years deconstructing it, taking it apart letter by letter, and trying to figure out why there are so many feelings and ideas that we cannot even put words to, and that our languages cannot identify. Visit Maptia for more interesting posts.
The idea that words cannot always say everything has been written about extensively – as Friedrich Nietzsche said:
Words are but symbols for the relations of things to one another and to us; nowhere do they touch upon the absolute truth.
No doubt the best book we’ve read that covers the subject is ‘Through The Language Glass‘ by Guy Deutscher, which goes a long way to explaining and understanding these loopholes – the gaps which mean there are leftover words without translations, and concepts that cannot be properly explained across cultures.
Somehow narrowing it down to just a handful, we’ve illustrated 11 of these wonderful, untranslatable, if slightly elusive, words. We will definitely be trying to incorporate a few of them into our everyday conversations, and hope that you enjoy recognising a feeling or two of your own among them.
1. German: Waldeinsamkeit

A feeling of solitude, being alone in the woods and a connectedness to nature. Ralph Waldo Emerson even wrote a whole poem about it.
2. Italian: Culaccino

The mark left on a table by a cold glass. Who knew condensation could sound so poetic.
3. Inuit: Iktsuarpok

The feeling of anticipation that leads you to go outside and check if anyone is coming, and probably also indicates an element of impatience.
4. Japanese: Komorebi

This is the word the Japanese have for when sunlight filters through the trees – the interplay between the light and the leaves.
5. Russian: Pochemuchka

Someone who asks a lot of questions. In fact, probably too many questions. We all know a few of these.
6. Spanish: Sobremesa

Spaniards tend to be a sociable bunch, and this word describes the period of time after a meal when you have food-induced conversations with the people you have shared the meal with.
7. Indonesian: Jayus

Their slang for someone who tells a joke so badly, that is so unfunny you cannot help but laugh out loud.
8. Hawaiian: Pana Poʻo

You know when you forget where you’ve put the keys, and you scratch your head because it somehow seems to help your remember? This is the word for it.
9. French: Dépaysement

The feeling that comes from not being in one’s home country – of being a foreigner, or an immigrant, of being somewhat displaced from your origin.
10. Urdu: Goya

Urdu is the national language of Pakistan, but is also an official language in 5 of the Indian states. This particular Urdu word conveys a contemplative ‘as-if’ that nonetheless feels like reality, and describes the suspension of disbelief that can occur, often through good storytelling.
11. Swedish: Mångata

The word for the glimmering, roadlike reflection that the moon creates on water. 
Uber is a mobile app that hails cabs for you. Click here, sign up, and get your first ride with Uber for free.
This post originally appeared at MAPTIA.
image – NAME
    
|
Ninadarkangel, Jmontano and 22 others like this

14 Aug 16:30

pasturemud: iampetershervheim: rkidd: d0esntmakesense: This...
This is probably the coolest GIF I’ve ever seen.
now there’s some perspective.
I once saw a storm roll like this once. It was beautiful.
i love watchin rain roll in
Tomfhaines, ivan and 7 others like this
06 Aug 22:15


The Price of Being a Superhero in Real Life: Then & Now
by Justin Page
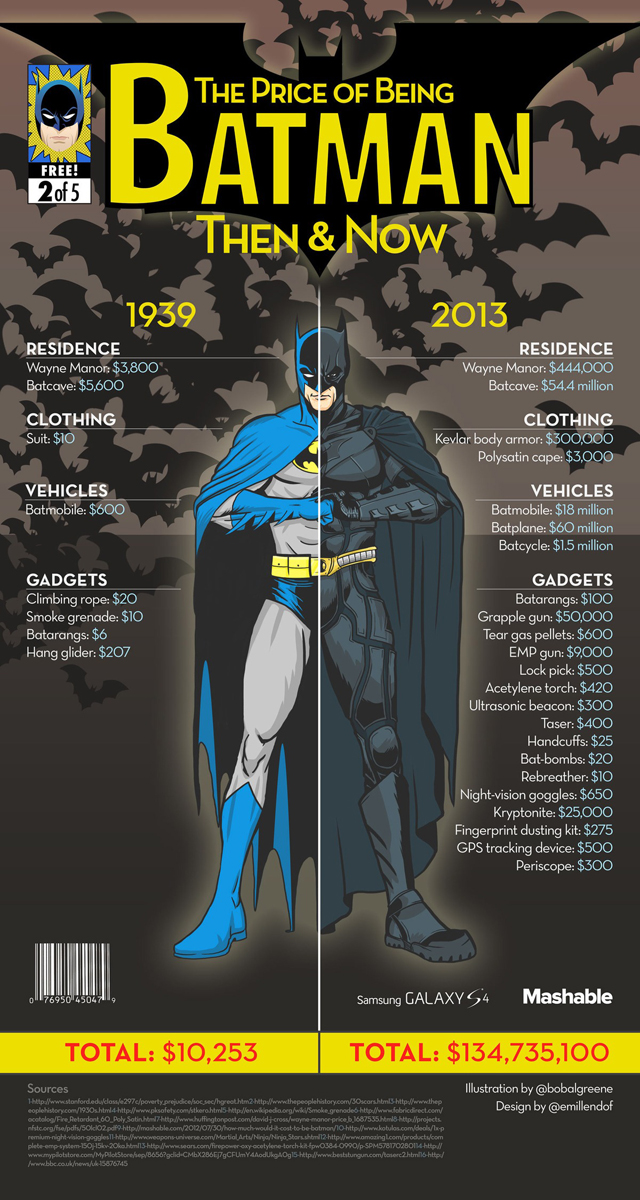
How Much Does It Cost to Be Batman in Real Life?
Brooklyn-based graphic designer Emil Lendof (layout) and New York City-based illustrator Bob Al-Greene (artwork) created a series of infographics for Mashable that show the price differences between being a superhero in the past and present. You can view all 5 superheroes at Mashable (Superman, Batman, Spider-Man, Hulk and Wolverine).
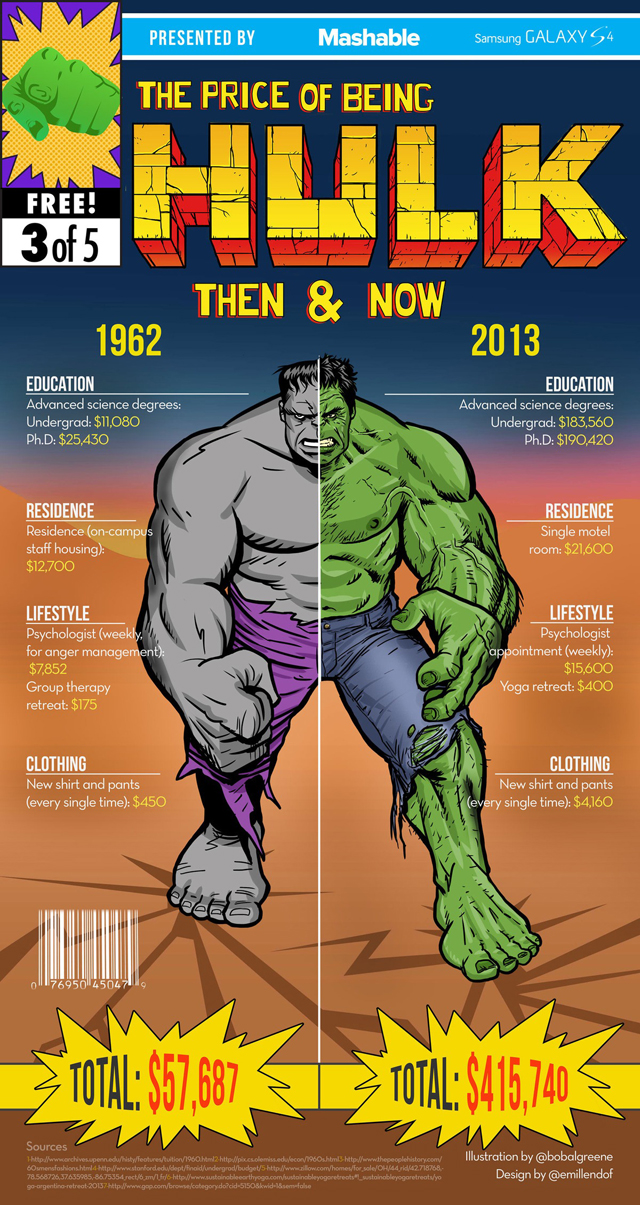
How Much Does It Cost to Be The Hulk in Real Life?
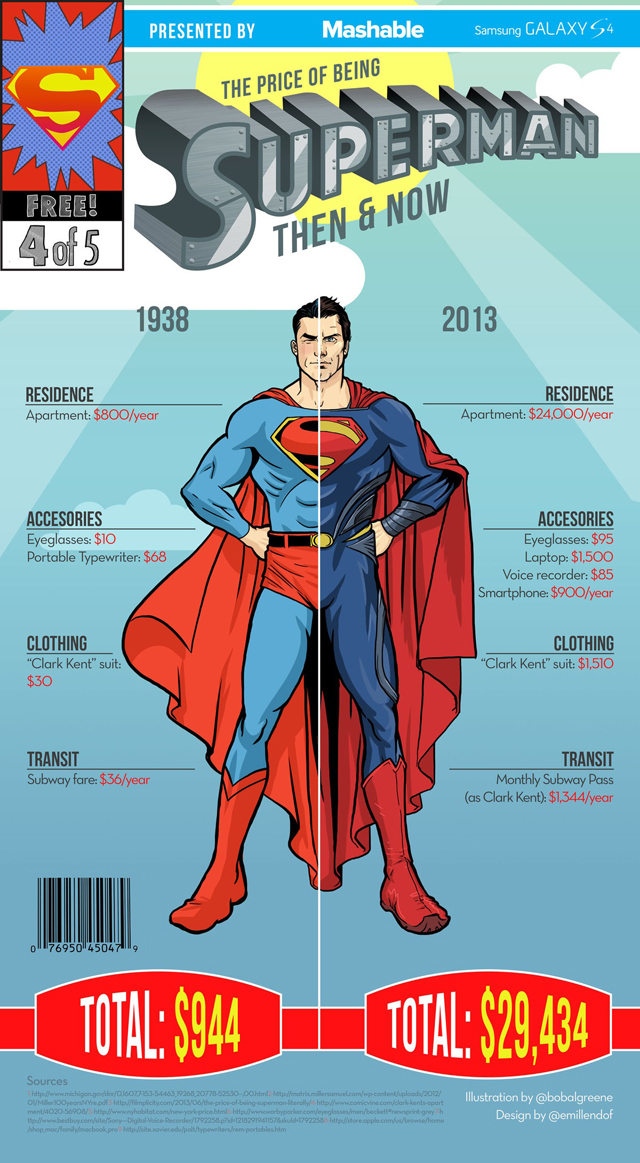
How Much Does It Cost to Be Superman in Real Life?
images via Mashable
via Highsnobiety
Lori likes this


27 Jul 14:39
Lego cria edição especial da máquina do tempo de “De Volta para o Futuro”
by Caio Caprioli
Giseli.ramosShut up and take my money!

Vou descrever este post em uma palavra: amor. A Lego lança, em 1 de agosto, um set especial de lego com a máquina do tempo de “De Volta para o Futuro“.
Não é só isso, não. O set traz o DeLorean usado para viajar no tempo de uma forma que você pode customizar para criar três modelos diferentes, de acordo com a trilogia. Sacou? Amou? Calma…
O brinquedo foi produzido através de um modelo enviado por um fã. As peças são todas estilizadas para que o carro fique bem parecido com o original. Além de ter os mesmo desenhos do marcador de tempo no painel, ainda é possível mexer as portas, que se abrem para cima, e dobrar as rodas, para o carro “levitar”, como nos filmes.

Ainda vêm dois bonequinhos fofos do Marty McFly (e seu skate) e o Doutor Brown. <3
Lá fora vai custar US$ 34,99 e a edição será lançada no dia 1º de agosto nos Estados Unidos. Será que alguém vai trazer essa raridade pro Brasil?


Fernanda Campello, Edison Gustavo and 3 others like this
15 Jul 12:31
When Lightning Strikes Sand
Sabinx, Mike Di Bello and 25 others like this
14 Jul 21:13


The Political Cartoon Of The Year?
by Joe


Giseli.ramos, Angietupelo and 12 others like this
12 Jul 18:51


Atlas, o novo robô da Cyberdyne, digo, Boston Dynamics
by j. noronha
Giseli.ramosSkynet feelings...

Ontem a DARPA apresentou ao público o Atlas, um robô de 1,83 m de altura e 150 kg, desenvolvido pela Boston Dynamics. Ao contrário da aparência, sua função é ajudar em desastres.
Por precaução, no entanto, eu não colocaria uma .12 na mão dessa belezinha.
Crédito da imagem: DARPA, Boston Dynamics
O Atlas é projetado para caminhar e carregar coisas, mas também enfrenta terreno acidentado e é capaz até de pequenas escaladas utilizando mãos e pés. Suas mãos são sensíveis e articuladas, permitindo o uso de ferramentas projetadas para humanos.
A cabeça dispõe de câmeras estéreo e um telêmetro (dispositivo que mede distâncias em tempo real). A alimentação é externa, o que é uma certa fraqueza, apesar de nos dar mais tranquilidade quando começar o levante das máquinas.
A DARPA Robotics Challenge, ou Desfio de Robótica da DARPA, visa desenvolver máquinas que possam lidar com calamidades e ambientes perigosos, como acidentes em usinas nucleares.
As sete equipes participantes do desafio atual vão receber um Atlas e terão até dezembro para programá-lo. Os desafios incluem fazê-lo dirigir um utilitário, caminhar em terreno irregular, atravessar uma parede, fechar uma válvula e remover detritos.
O vídeo abaixo mostra o robô em ação, comparando-o inclusive com seu antecessor Petman.
Fonte: CNet
 |
 |
Marco Portela, Tadeu and one other like this
12 Jul 14:27


Visualizing the Bechdel test
 |
popular
shared this story
from |
to my sister, to my brother and to my friend Ber
Introduction
Bechdel test was enunciated by Alison Bechdel on the comic Dykes to Watch Out For in 1985. For a movie to pass the test, it must meet the following prerequisites:- It has to have at least two women in it,
- who talk to each other,
- about something besides a man.
The most widely used form of the test today added the necessity of the two female characters to have names. The test has the characteristic of being simple, so easy to apply, and not requiring much for a movie to succeed. However, one of it's limitations is that the application of the test on a single movie is debatable, since there can be many artistic choices that end up making the movie not pass the test (for example, Run Lola Run doesn't have two female characters who talk to each other). Thus, its application is more interesting when applied to a set of films, since it may reveal patterns of how women are represented consistently in this particular set. The graphs present here subdivide the films into groups according to variables available on various sites, to try to find how each category affects the way females characters are represented.
I have little academic knowledge in film or in sociology, so I'll try to avoid comments that are not about the graphics.
The Bechdel rates are from bechdeltest.com. I removed movies where more than 50% of users who commented on it disagreed about the classification. The site classifies films according to each prerequisites of the test. Here, I grouped the films based only on whether they pass the test or not. I did it for clarity.
Click on the charts to enlarge them.
The charts
Years
Despite the fact that <a href="http://bechdeltest.com" rel="nofollow">bechdeltest.com</a> provide data about the movies' year, I used data from imdb.com, as I rely more on them in this regard.
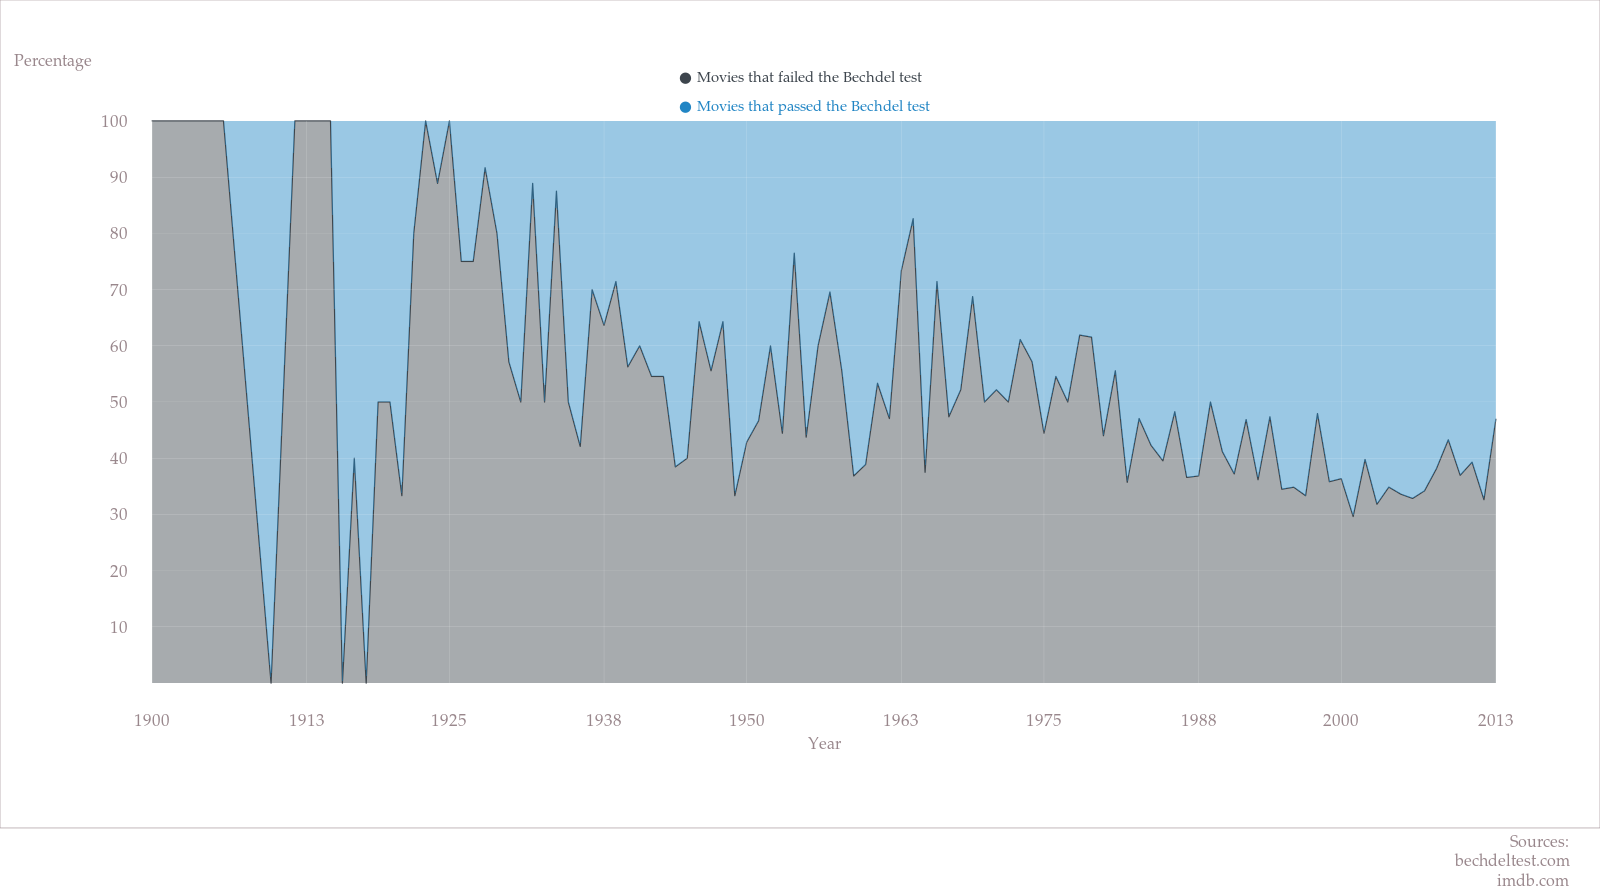
The graph below shows the proportion of film that succeed on the Bechdel test across the years.

The visualization of variations seems compromised, due to the fact that there are some years with very few films analyzed, as can be seen in the plot of movie analyzed on <a href="http://bechdeltest.com" rel="nofollow">bechdeltest.com</a> by year:
 To try to circumvent this problem, I used the lowess function in R,that applies a locally-weighted polynomial regression. This regression has its smoothness related to the parameter f, which, according to the maintainer's description, is:

The smoother span. This gives the proportion of points in the plot which influence the smooth at each value. Larger values give more smoothness.
Below is a gif that shows how the change on the parameter f from 0 to 1 influences the graph.


I wanted to show how the parameter affects the graph, making clear the bias that the method may be having in this case. Bellow is the chart with f = 2/3, the default value for the function.
 The actual measures on each year here don't represent the data as in the first graphic, what is important now is the trend. So, it seems that there was, at the beginning of the last century, a rapid insertion of female characters, this increase stabilized in the 1930s. Another tendency in this direction seems to have happened between the 1960s-80s.

Movie Genre

The genres of each movie were obtained from <a href="http://imdb.com" rel="nofollow">imdb.com</a>, where each movie can have multiples genres. Only genres present in more than 50 films are shown.
There are several discussions on whether or not documentaries should be evaluated according to the parameter of the Bechdel test. I am of the opinion that they should not, but I didn't put too much thought into it, and, as I've said before, I m not a expert on the subject. So, I decided to leave them here.
Directors and writers
These chart represented writers and directors with more than five films evaluated. As these professionals often end up specializing in certain genres, these were added in the graph for comparison. There were too many directors and writers, and this would make the chart too long and boring, so I selected those that I consider to be the most famous to display in these charts. Also, I didn't repeat the ones in the directors chart in the writers chart. Some famous directors, like Akira Kurosawa, James Cameron and M. Night Shyamalan did not have five movies analysed as directors, but did as writers. The directors and writers were obtained from <a href="http://imdb.com" rel="nofollow">imdb.com</a>. When a movie is based on a book, IMDB gives credit to the book's author, that's why many of them appear in the writers graph.
Directors

Writers

Directors, writers and producers by gender
These charts are divided by the gender of professionals working in different stages of film production. How the gender was assigned is described at the end of the post.


Countries
Proportion of Bechdel test classes according to the country of origin of the film. This information was obtained from <a href="http://imdb.com" rel="nofollow">imdb.com</a>. Only countries with more than 15 movies where included.


The first time I heard of the Bechdel test was while talking the Academy Award for Best Picture. So I wanted to compare this award against others. I chose the ones that I believe are the most important. I have included the movies nominated for the best picture in each award (Palme d'Or at Cannes, Golden Bear in Berlin, Golden Lion at Venice and the Academy Award for Best Picture). The information on the awards come from <a href="http://imdb.com" rel="nofollow">imdb.com</a>.


What we talk about when we talk about Bechdel test
During the process of production of these charts, I have wondered if the Bechdel test was actually measuring what it intended. That is, if it really captured groups of movies where women were underrepresented, and, when they appeared, had their role around men.
To try to answer this question, I researched, in the movie scripts present in imsdb.com

Below the result, I added a violin plot on each axis to help to visualize the distribution of the variables.

Before talk about the colors, I want to address the vertical dispersion of the graph. I was surprised to see that women talk so much less than men in movies. I thought this might show a bias in the movies chosen to be analyzed in <a href="http://bechdeltest.com" rel="nofollow">bechdeltest.com</a>. To see if this was the case, I did the same graph for all scripts present in <a href="http://imsdb.com" rel="nofollow">imsdb.com</a> and in <a href="http://script-o-rama.com" rel="nofollow">script-o-rama.com</a>, irregardless if the movie was analyzed in <a href="http://bechdeltest.com" rel="nofollow">bechdeltest.com</a>. And the result was:
 So, it does not appear that <a href="http://bechdeltest.com" rel="nofollow">bechdeltest.com</a> has some bias on this variable.
Now, about the distribution of the Bechdel test in the chart, at first, it seemed to me that the test was capturing what it proposes, since the blue dots are seemingly more likely than others to be on the center or down and to the left. Thus, movies where women are represented or referenced at least as much as men are passing the test. However, there is a positive correlation between the two variables:
 I speculated that this must be due to the fact that secondary characters generally refer to the main characters. Thus, women have fewer lines, which shows that they are mostly secondary characters, that makes them refer more to men, that are usually the main character. If this reasoning is true, the chart is showing that the Bechdel test, when discriminating to one variable, also discriminates for the other. But, maybe referring to the main character is not something that just secondary female characters do, but also secondary male characters. So I tried to develop a way to see if the test was also able to display films in which women are more focused on men than other male characters.
To try to address this issue, I made another chart, where I compare if female characters refer more to men than male character to men.
Here is the scheme of what this graph is representing:


To try to answer this question, I researched, in the movie scripts present in imsdb.com
and in
script-o-rama.com,
the number of words spoken by men and women and the proportion of times that men refer to women and vice versa (how often does a genre talk about the other). I colored the points in the graphs according to the Bechdel test, and thus expected films where women talk as much or more than men and/or movies where men refer more to women than women to men would, mostly, pass the test. I removed the outliers from the chart to make the range easier to visualize. As this chart can be tricky to understand, I did this scheme below to demonstrate what each square represents.
Below the result, I added a violin plot on each axis to help to visualize the distribution of the variables.

Before talk about the colors, I want to address the vertical dispersion of the graph. I was surprised to see that women talk so much less than men in movies. I thought this might show a bias in the movies chosen to be analyzed in <a href="http://bechdeltest.com" rel="nofollow">bechdeltest.com</a>. To see if this was the case, I did the same graph for all scripts present in <a href="http://imsdb.com" rel="nofollow">imsdb.com</a> and in <a href="http://script-o-rama.com" rel="nofollow">script-o-rama.com</a>, irregardless if the movie was analyzed in <a href="http://bechdeltest.com" rel="nofollow">bechdeltest.com</a>. And the result was:

Now, about the distribution of the Bechdel test in the chart, at first, it seemed to me that the test was capturing what it proposes, since the blue dots are seemingly more likely than others to be on the center or down and to the left. Thus, movies where women are represented or referenced at least as much as men are passing the test. However, there is a positive correlation between the two variables:

To try to address this issue, I made another chart, where I compare if female characters refer more to men than male character to men.
Here is the scheme of what this graph is representing:

And here the chart.

Here, the right hand side of the chart is where women are talking more about men than men about men. In other words, the females characters more frequently makes refering to males than male characters. My hope is that this is a good way to judge whether women are represented by characters more focused on a man than would be expected. Looking at the violin plots at the top, it seems that the Bechdel test didn't
discriminate this feature in the movies. So, it seems that the test is a good way to measure if female characters are having the same voice as the male character, but not so much to measure what this voice is saying.To finish, here is the same chart as above, but for all scripts.

Bechdel test aside, it seems clear from these graphs' Y axis that women are alarmingly less represented than men in movies.
Where does the data come from?
Classification of films according to the Bechdel test
The classification of the films was obtained in bechdeltes.com site. In it, anyone can enter information about a movie and classify it accordingly. Usually, those who put the data also insert a comment saying why. Every movie has a discussion on the classification. When posting a comment on this conversation, the user can click that she/he has disagreed with the classification or can simply comment. Seeing some of these pages, I realized that most users that do not click on the disagreed box, agreed with the classification. Thus I made a filter where I only accepted films where more than 50% of users who commented do not disagree with the classification. Note that 50% do not refer to the amount of comments, but 50% of users who commented (one user can comment more than once). Some films had more than one entry. In such cases, if the classification of these were different I removed the film, if both inputs have the same classification I considered the sum of the comments to apply the filter mentioned above.
Year, country, gender, directors, writers, producers and awards of films
Information of the production of the films were obtained from imdb.com. Here is a discussion of APIs available to obtain this type of information. Some APIs have the problem that, when there are more than three directors or screenwriters for a film, they do not return at all. In these cases, it was necessary to search the IMDB site manually. I have found no API that provides information on movie awards, so, for this information, it was also necessary to manually search the site.
Gender of directors, screenwriters and producers
The gender of the people involved in the films were assessed in different ways.
- First, I check whether the page of the person on IMDB contained if she/he was an actress or actor, which would deliver the genre, since the word is gender specific.
- If there were no such information, the number of gender-specific pronouns (she/he, her/he, herself/himself) present in the trivia and biography of the person was counted. The gender with the most pronouns was linked to the person.
- If there was a draw in the count or the person did not have these fields on her/his page, the first name was matched against the table of first name and gender present in genderchecker.com. I found this list conservative, ie. when a first name has a reasonable proportion of both genders it returns "unknown". That is, it avoids false positives.
If it was impossible to get the gender by theses methods the gender was assigned "unknown" and has not been used in graphics which involve that variable.
Information on the scripts for the films
To be able to assess what the Bechdel test was capturing, I made some graphs with data of the screenplays of films. The screenplays were available from the websites imsdb.com and script-o-rama.com. I developed a R script to read these screenplays and to couple each line to a character. These character names were matched with the names of the characters on the page of the movie on IMDB. From the method stated above, it was possible to return the gender of actors and actresses who play each character. Thus, it was possible to couple each line to a gender. The R script is not perfect, mainly because some scripts presented in these sites are not well formatted. So, I applied some quality filters: The screenplays accepted were the ones that my R script could capture:
- At least 500 lines linked to characters.
- At least five characters.
- At least 50 lines linked to each gender.
Theses quality controls aim to avoid screenplays that the R scripts did not get right in ways that could compromise the charts. The necessity for minimal number of lines is to be sure that the R script got a good part of the screenplay. The filter on characters number is to avoid screenplay where very few characters have been identified, what would make the ones that were identified over represented. And the minimal number of lines linked to each gender is to avoid cases where to R script identified only marginal characters of a gender.
The R scripts used
All graphics and the data extraction were performed using R. I uploaded the working directory here. The codes are not fully annotated and the directories still a little messy. At the moment, I do not have the time, but as soon as possible, I will try to organize them. In this directory, there is also some scripts to deal with the financial information from the-numbers.com and score information from rottentomatoes.com that I didn't show here, because I didn't find it very interesting.
Table
I made a table with the movie informations here. This table is after removal of the movies where more than 50% of users who commented disagreed with the <a href="http://bechdeltest.com" rel="nofollow">bechdeltest.com</a> classification.
Final consideration
This is my first attempt at doing graphics on a subject that has no relation to my work (and in a foreign language to me), so any criticism (about the design, data or grammar) is very welcome.Edit 07/05/2013 : I corrected the title of the X axis of bar charts. They were named as "percetage".
Kentaro Mori, Alvaro Freitas and 2 others like this
12 Jul 07:57


GENIUS: beautiful graphic novel about inspiration, Einstein, and self-doubt
by Cory Doctorow

Genius is a new graphic novel written by Steven T Seagle and drawn by Teddy Kristiansen and it's not really like any other graphic novels I've read. In a very good way.
Ted Marx is a physicist, and he's a genius. That's what he's been told all his life, ever since he started skipping grades in elementary school. It's only natural that he'd be recruited directly out of grad school and into a world-famous physics institute, but once he reaches it, he flames out. Ted Marx appears to have had all his significant physics insights while he was still an adolescent, and whatever well he visited for those insights has run dry. He's terrified of losing his job. He needs the money to shelter and feed his two adolescent children, his dying and terminally grumpy father-in-law, and his wife, whose persistent headaches are about to take a turn for the worse.
Ted worships Einstein, and frequently holds imaginary conversations with him, so imagine his surprise when he learns that his hateful, spiteful, senile father-in-law was once military guard to Einstein, part spy, part confessor. And what's more, the old man says that Einstein entrusted him with an idea that he never told anyone else, an idea that he's kept secret, true to his oath, for all these years. And if there's one thing that Ted really needs, it's an idea.
Genius is a remarkable book about some very difficult-to-illustrate subjects: creativity, inspiration, and yes, genius. Kristiansen's moody, impressionistic watercolor illustrations -- not usually my kind of thing -- perfect for the material. There's a full-blown, multi-page spread of pure abstraction that is so right and fitting that it made me wonder why we bother with words at all.
I'm not familiar with either of these creators' work (though apparently Seagle co-founded the studio that created the kids' megafranchise Ben-10). But based on this, I'm adding them to my "buy-everything-they-do" list.
Don't take my word for it -- click through below for the prolog and first couple pages of chapter one, courtesy of our pals at FirstSecond.


![]()
|
|
Skinny.honkie, nealteam and 11 others like this


05 Jul 10:27


Perdemos Douglas Engelbart, um dos criadores do mouse e pioneiro da computação
by j. noronha
Crédito da imagem: reprodução.
Douglas Engelbart, pioneiro da computação e um dos responsáveis pela criação do primeiro mouse, faleceu na última terça-feira, 2 de julho, aos 88 anos.
A morte foi confirmada por sua filha Christina Engelbart através da lista de email “Pessoas Interessantes”, mantida pelo professor de ciência da computação Dave Farber, da Carnegie Mellon:
Estou muito sentida ao informar que meu pai faleceu calmamente em casa enquanto dormia durante a noite passada. Sua saúde vinha enfraquecendo ultimamente, e piorou durante o final-de-semana.
Ele foi um dos envolvidos no desenvolvimento da ARPANET, que veio a dar origem a atual internet. Em 1968 apresentou a “mãe de todas as demonstrações” no Instituto de Pesquisas de Stanford (SRI), em Menlo Park, na Califórnia. Ali já se via o ancestral do mouse que você está acostumado a utilizar, em uma estação de trabalho batizada de NLS.
Estação de trabalho NLS. Crédido da imagem: Computer History Museum.
Esse trabalho, considerado seu mais importante, começou em 1959, quando desenvolveu tecnologias-chave que são utilizadas até hoje, incluindo o hipertexto (os links que utilizamos até hoje), a tela compartilhada, múltiplas janelas e video-conferência.
O vídeo abaixo mostra a famosa apresentação. A parte boa começa aos 4:45 e é impressionante ver o cursor em uma tela preto e branco anos antes da existência até mesmo do DOS.
Fonte: AllThingsD.
|
|
04 Jul 15:56


Magnets and Mobius Strips!
Submitted by: Unknown
Dperezv, Dbhalstead and 9 others like this
04 Jul 11:47

2) Mid-level patch discovery is a hot research topic.Saurabh Singh from CMU introduced this idea in his seminal ECCV 2012 paper, and Carl Doersch applied this idea to large-scale Google Street-View imagery in the “What makes Paris look like Paris?” SIGGRAPH 2012 paper. The idea is to automatically extract mid-level patches (which could be objects, object parts, or just chunks of stuff) from images with the constraint that those are the most informative patches. Regarding the SIGGRAPH paper, see the video below.

Carl Doersch, Saurabh Singh, Abhinav Gupta, Josef Sivic, and Alexei A. Efros. What Makes Paris Look like Paris? In SIGGRAPH 2012. [pdf]
At CVPR 2013, it was evident that the idea of "learning mid-level parts for scenes" is being pursued by other top-tier computer vision research groups. Here are some CVPR 2013 papers which capitalize on this idea:
Blocks that Shout: Distinctive Parts for Scene Classification. Mayank Juneja, Andrea Vedaldi, CV Jawahar, Andrew Zisserman. In CVPR, 2013. [pdf]
Representing Videos using Mid-level Discriminative Patches. Arpit Jain, Abhinav Gupta, Mikel Rodriguez, Larry Davis. CVPR, 2013. [pdf]
Part Discovery from Partial Correspondence. Subhransu Maji, Gregory Shakhnarovich. In CVPR, 2013. [pdf]
3) Deep-learning and feature learning are on the rise within the Computer Vision community.
It seems that everybody at Google Research is working on Deep-learning. Will it solve all vision problems? Is it the one computational ring to rule them all? Personally, I doubt it, but the rising presence of deep learning is forcing every researcher to brush up on their l33t backprop skillz. In other words, if you don't know who Geoff Hinton is, then you are in trouble.
[CVPR 2013] Three Trending Computer Vision Research Areas
by Tomasz Malisiewicz
As I walked through the large poster-filled hall at CVPR 2013, I asked myself, “Quo vadis Computer Vision?" (Where are you going, computer vision?) I see lots of papers which exploit last year’s ideas, copious amounts of incremental research, and an overabundance of off-the-shelf computational techniques being recombined in seemingly novel ways. When you are active in computer vision research for several years, it is not rare to find oneself becoming bored by a significant fraction of papers at research conferences. Right after the main CVPR conference, I felt mentally drained and needed to get a breath of fresh air, so I spent several days checking out the sights in Oregon. Here is one picture -- proof that the CVPR2013 had more to offer than ideas!


When I returned from sight-seeing, I took a more circumspect look at the field of computer vision. I immediately noticed that vision research is actually advancing and growing in a healthy way. (Unfortunately, most junior students have a hard determining which research papers are actually novel and/or significant.) A handful of new research themes arise each year, and today I’d like to briefly discuss three new computer vision research themes which are likely to rise in popularity in the foreseeable future (2-5 years).
1) RGB-D input data is trending.
Many of this year’s papers take a single 2.5D RGB-D image as input and try to parse the image into its constituent objects. The number of papers doing this with RGBD data is seemingly infinite. Some other CVPR 2013 approaches don’t try to parse the image, but instead do something else like: fit cuboids, reason about affordances in 3D, or reason about illumination. The reason why such inputs are becoming more popular is simple: RGB-D images can be obtained via cheap and readily available sensors such as Microsoft’s Kinect. Depth measurements used to be obtained by expensive time of flight sensors (in the late 90s and early 00s), but as of 2013, $150 can buy you one these depth sensing bad-boys! In fact, I had bought a Kinect just because I thought that it might come in handy one day -- and since I’ve joined MIT, I’ve been delving into the RGB-D reconstruction domain on my own. It is just a matter of time until the newest iPhone has an on-board depth sensor, so the current line of research which relies on RGB-D input is likely to become the norm within a few years.
H. Jiang and J. Xiao. A Linear Approach to Matching Cuboids in RGBD Images. In CVPR 2013. [pdf] [code]
2) Mid-level patch discovery is a hot research topic.Saurabh Singh from CMU introduced this idea in his seminal ECCV 2012 paper, and Carl Doersch applied this idea to large-scale Google Street-View imagery in the “What makes Paris look like Paris?” SIGGRAPH 2012 paper. The idea is to automatically extract mid-level patches (which could be objects, object parts, or just chunks of stuff) from images with the constraint that those are the most informative patches. Regarding the SIGGRAPH paper, see the video below.
Unsupervised Discovery of Mid-Level Discriminative Patches Saurabh Singh, Abhinav Gupta, Alexei A. Efros. In ECCV, 2012.
Carl Doersch, Saurabh Singh, Abhinav Gupta, Josef Sivic, and Alexei A. Efros. What Makes Paris Look like Paris? In SIGGRAPH 2012. [pdf]
At CVPR 2013, it was evident that the idea of "learning mid-level parts for scenes" is being pursued by other top-tier computer vision research groups. Here are some CVPR 2013 papers which capitalize on this idea:
Blocks that Shout: Distinctive Parts for Scene Classification. Mayank Juneja, Andrea Vedaldi, CV Jawahar, Andrew Zisserman. In CVPR, 2013. [pdf]
Representing Videos using Mid-level Discriminative Patches. Arpit Jain, Abhinav Gupta, Mikel Rodriguez, Larry Davis. CVPR, 2013. [pdf]
Part Discovery from Partial Correspondence. Subhransu Maji, Gregory Shakhnarovich. In CVPR, 2013. [pdf]
3) Deep-learning and feature learning are on the rise within the Computer Vision community.
It seems that everybody at Google Research is working on Deep-learning. Will it solve all vision problems? Is it the one computational ring to rule them all? Personally, I doubt it, but the rising presence of deep learning is forcing every researcher to brush up on their l33t backprop skillz. In other words, if you don't know who Geoff Hinton is, then you are in trouble.
Kentaro Mori, Albener Pessoa and one other like this
04 Jul 11:41
When NASA finds that teapot, you are all going to be so fucking...

Marília, Tertiarymatt and 2 others like this