Adam Hamilton
Shared posts
Comic for June 13, 2020
How healthy are your applications? Find out quickly with customizable Dashboard tiles
Raygun is happy to announce the release of editable Dashboard tiles.
If you haven’t already used Raygun’s Dashboard feature, you can read about it more here.
At the core of the Dashboard is the ability to provide your team with a high level view of the health of your application. It does this with customizable Dashboard tiles that can be dragged, dropped and edited as you see fit.
The data is 100% customizable. Whether you need to understand more about the locations of your end users or how many are experiencing crashes in real time, Raygun’s software intelligence platform will present what you need in a beautiful and user friendly Dashboard. Use the TV mode to display this information company-wide. The ability to save multiple dashboards is coming soon too – watch this space!

The choice is yours with Raygun dashboards – an attractive UI to give you a high level view of you app
Drag and drop editable tiles for different outcomes – the combinations are endless.
Below, we’ve created a few combinations of different tiles to show different objectives:
- Display data for a non technical person
- See a high level overview of errors and crashes affecting your users
- See a high level overview of the performance issues affecting your users
Feel free to use them as inspiration. For more details on the editable tiles and how they work, head to the documentation.
1. Show a non technical person the traffic of your application
If a non technical manager is asking how your application is doing, why not arrange tiles to show them with great UI rather than a spreadsheet filled with numbers? A graph that goes up and to the right is much more powerful. You could use tiles in this arrangement for example:
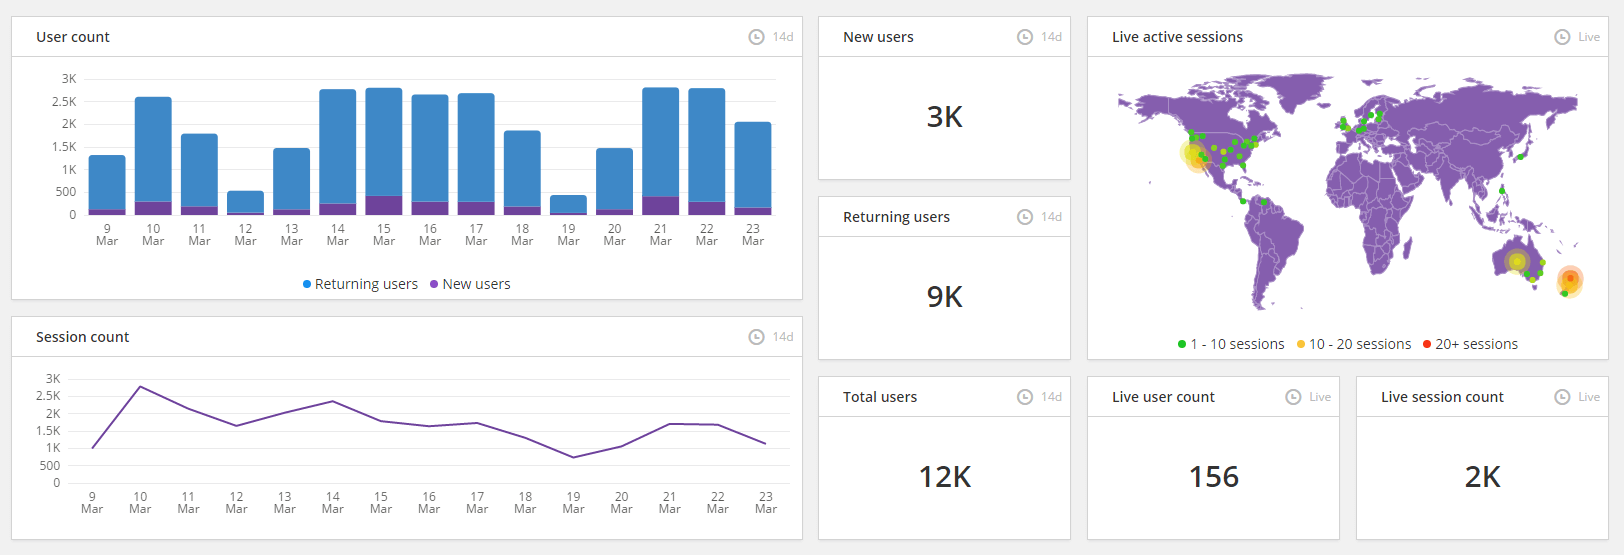
Show, don’t tell with this dashboard set up
- Total user count See the total number of returning and new users broken down by date.
- Session count The total number of sessions of your application over time.
- New, Returning and Total users Impress your investors by showing adoption rates, loyal users and total users of your applications over a given time frame.
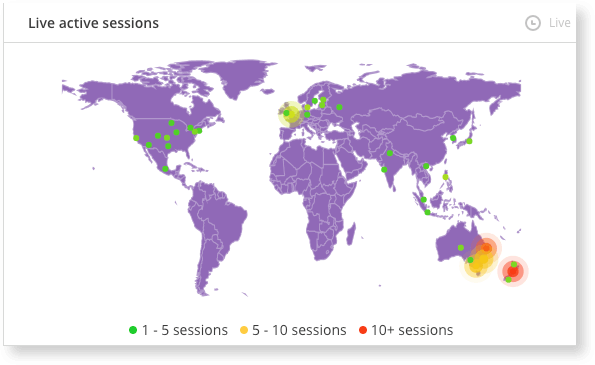
- Live active sessions Shows the geographical density of where your app is being used right this second
- Live user count How many users are in your application right now? Get a high level view to understand more about your users.
- Live session count How many sessions are currently running in your application? This information is updated live – watch out for traffic spikes at certain times of day for example.
2. Get a high level view on errors and crashes users are experiencing
Do you have a team KPI to reduce the amount of errors in your application, or maybe to reduce any technical debt? This arrangement could work for you. Below, you can see a high level view of the errors in your application, their location and how they are affecting end users:
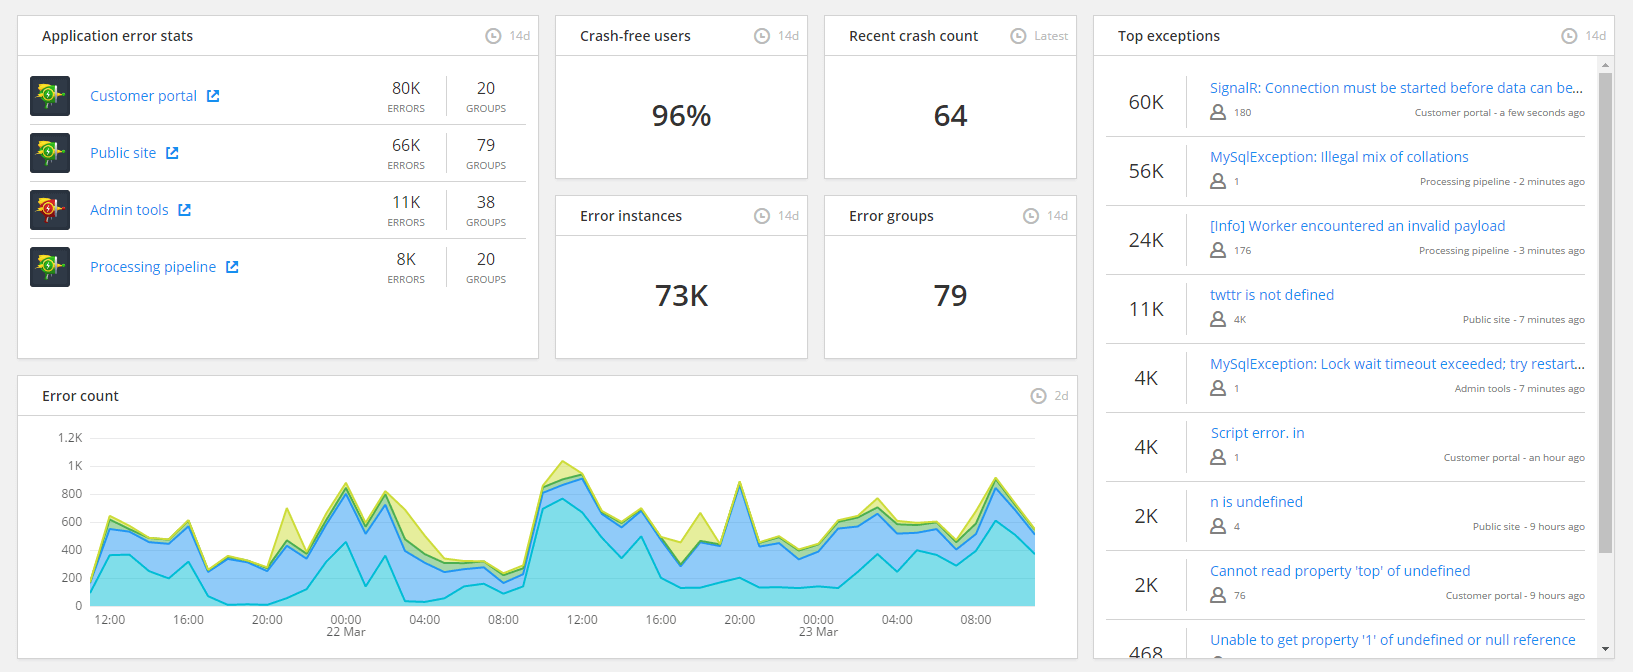
Use this example of dashboard tiles to monitor exceptions
- Application error stats A high level view of where the exceptions are mostly occurring and how many there are
- Error count A visualization over time so you can see trends in your error counts. This could allow you to spot a point in time where something changed, and address accordingly.
- Crash free users, Recent crash count, Error instances, and Error groups These four tiles collectively give a timely overview of the count of crashes happening, and the percentage of users that have been affected. ‘Error instances’ shows a sum of how many crashes have happened over time. The ‘Recent crash count’ collects the crashes that have occurred in the last 10 minutes.
- Top exceptions A list of which errors are occurring. Clicking into the errors will give you the drill-down on the information of that particular error group. They are ranked according to which errors are occurring the most over the current time range.
3. Are you providing the best possible user experience?
At the end of the day, performance issues affecting end users affect your company’s bottom line. Get everyone on your team on the same page about where performance issues lie and where you are a cut above your competition. Set team benchmarks for performance improvements – and celebrate all the hard work your team puts in every day. For this aim, you might like to use a combination like the below:

An example of the dashboard set up for monitoring user experience
- Load time distribution This geographical tile allows you to specify a time range and displays the average loading time experienced in each country. If a majority of your customers are in a specific region, and you see if they are experiencing slow load times, it might be something to give attention to.
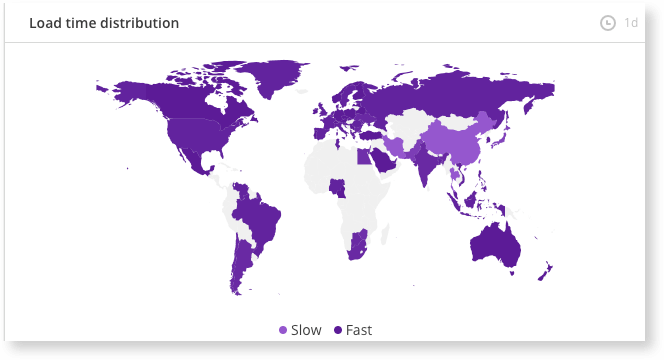
Load time distribution shows where you app is slow and fast
- New and returning users How are your users behaving? Are they signing up and staying? This is an excellent use for the new and returning users tiles.
- Crash free users, Recent crash count, Error instances, Error Groups Assess how many users are experiencing no crashes at all? Aim to improve this number over time. How many crashes did your application just experience? Assess whether they were major or minor, then address them quickly and easily by going into your Crash Reporting dashboard.
- Average load times If you have a high load time, it might be time to reassess slow loading pages. Use Raygun Pulse Insights to dive into which pages are causing problems so you can get them fixed quickly.
- Session distribution Which country is your app most popular in? Get a high level overview of the global distribution of your customers by session.
- Live health score Want to show off that you are giving your customers the best quality software experiences? The live health score will calculate overall health performance in real time, giving an accurate high level view of the health of your application.
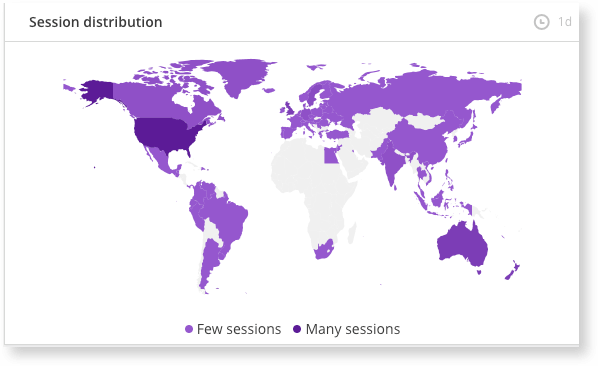
The session distribution shows where people are using your application
Getting started is easy…
Raygun’s Dashboard will give you a crystal clear overview of the health of your application. By dragging and dropping the Dashboard tiles into your preferred arrangement, you can create a rich and dynamic picture of your overall software health.
Start exploring the Dashboard tiles today, and watch this space for more tiles on their way soon!
Museum of American Revolution To Unveil Public Plaza Next Month
The Government Wants Your Fingerprint To Unlock Phones
Read more of this story at Slashdot.
Creationism Conference at Michigan State University Stirs Unease
Read more of this story at Slashdot.
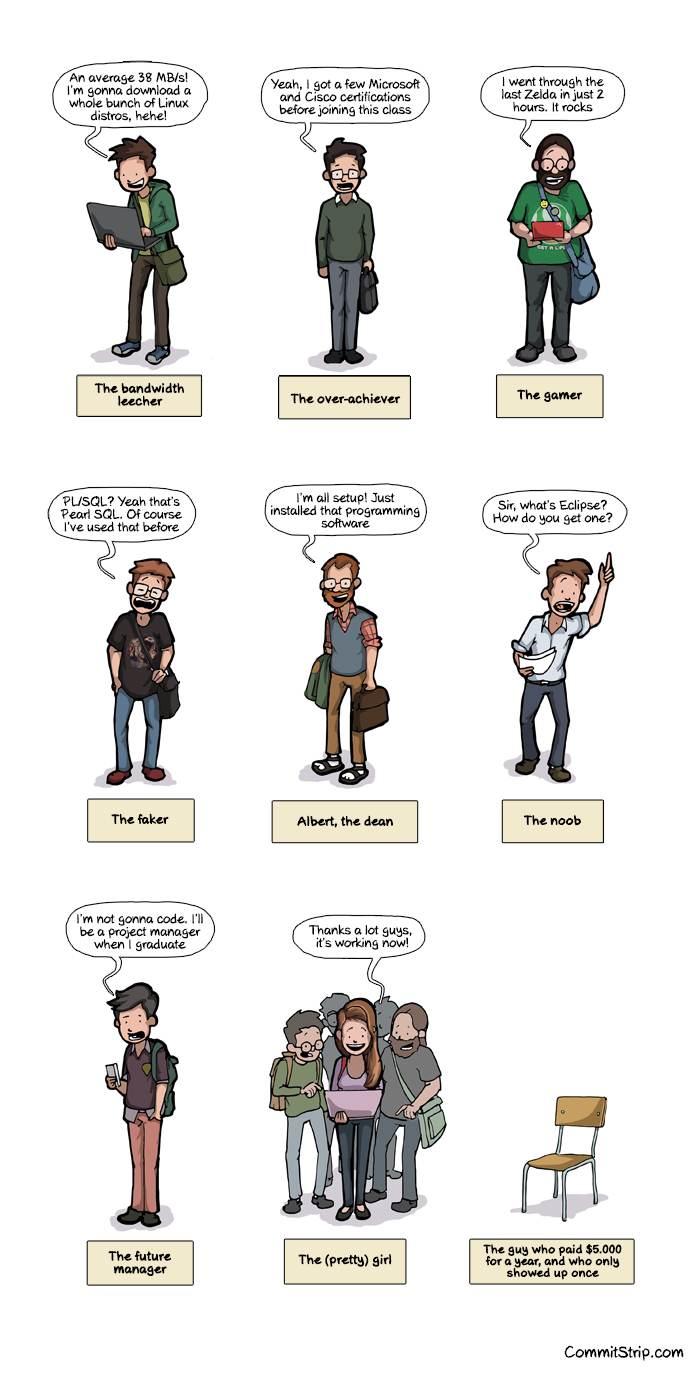
People you come across in IT schools
Add and share any web page with The Old Reader!
We’ve received a large number of requests to add a bookmarklet feature to The Old Reader. Today we are excited to be launching this functionality for our premium users. We will likely roll this functionality out to all users at some point in the future, but do not currently have a timeline in place.
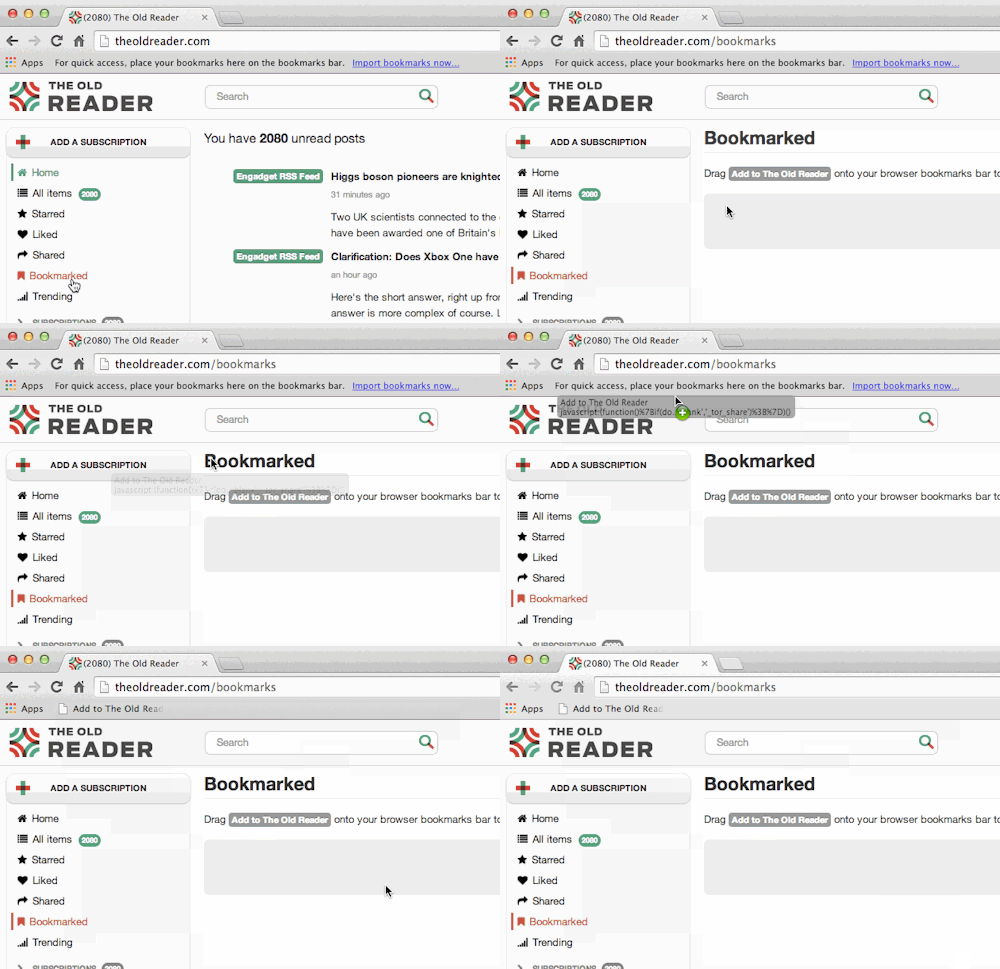
The bookmarklet is quickly and easily added to your browser bookmarks and allows you to send a copy of any web page to your TOR account. Those pages are saved in the new bookmarklets section and are also searchable and sharable.
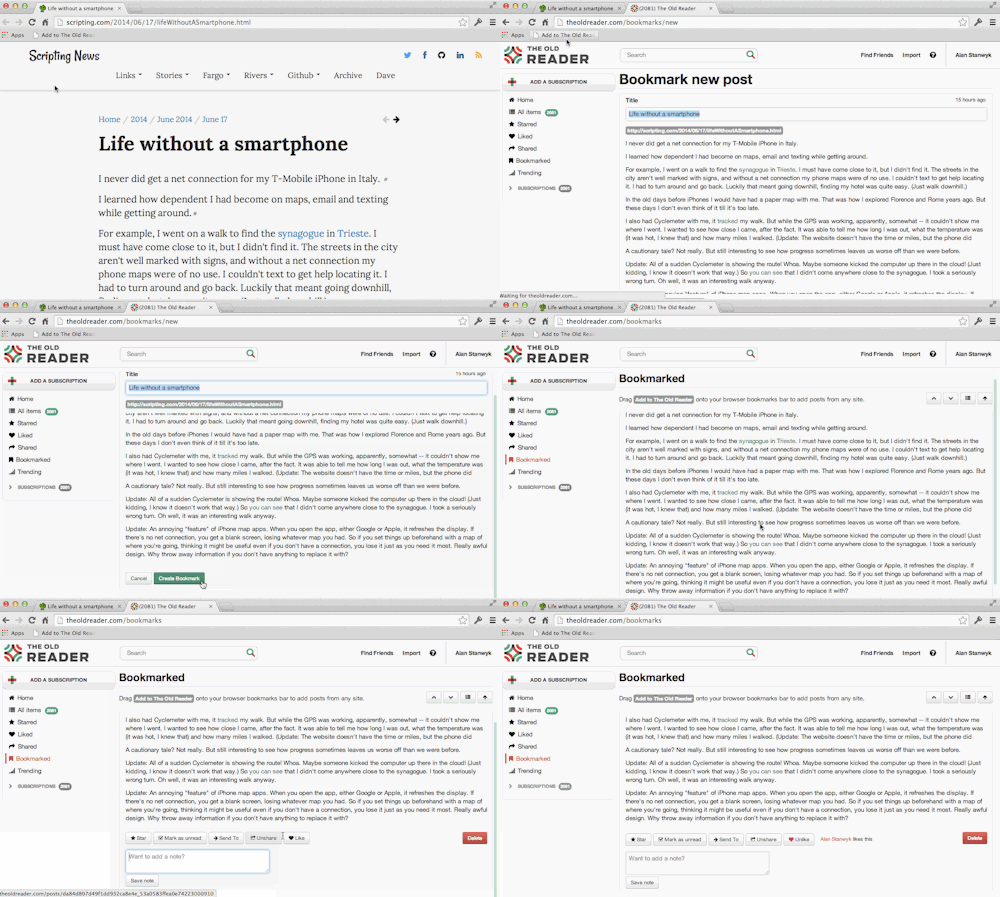
We know a lot of our users will be excited to see this new functionality and we look forward to your feedback. Thanks for using The Old Reader!
The Pie In The Sky Food Truck Festival Brings Kite Flying, Kite Making And Food Trucks To Penn Treaty Park, This Saturday, May 10

Help raise funds for Penn Treaty Park and its new planned playground by participating in the Pie in the Sky Food Truck festival complete with kite flying, kite making, food truck fare and more. (Photo by M. Kennedy for Visit Philadelphia)
Food trucks and flying kites come together for the second annual Pie in the Sky Food Truck Festival at Penn Treaty Park this Saturday, May 10 from noon to 5 p.m.
Festival-goers are encouraged to bring their own kite and fly it high above the Fishtown park.
For those who don’t own a kite, borrow one from the park or make one with supplies provided by the South Jersey Kite Flyers for $6 per person. The South Jersey Kite Flyers will also show off their kite-flying skills with competition kites.
Fill up on mobile eats from The Tot Cart, Vernalicious, Gigi’s and Big R, Spot Burger and Mary’s Mobile Diner while showing off your kite-flying skills around the park.
While noshing and flying kites, groove to tunes provided by an on-site DJ.
Like last year, the festival serves as a fundraiser for Penn Treaty Park but this year, also helps raise funds for a new playground planned for the park.
Pie In The Sky Food Truck Festival
When: Saturday, May 10, noon-5 p.m.
Where: Penn Treaty Park, 1341 N. Delaware Avenue
Cost: Free
More info: www.penntreatypark.org
a poem by me, ryan, but assigned to a fictional dinosaur juuuuust in case
| archive - contact - sexy exciting merchandise - cute - search - about | |||
| dinosaur comics returns monday!
|
|||
| ← previous | April 24th, 2014 | next | |
|
April 24th, 2014: Guys, The Midas Flesh #5 is out now! AHHH. It's the comic I'm writing about oh I don't know KING MIDAS IN SPACE WITH DINOSAURS and this issue is a big one. You can read a preview here! And you can pick the book up at your local comic book shop, or download a digital version instead (/ ALSO??)
 One year ago today: RHETORIC AT 64% AND FALLING – Ryan 
| |||
In Mississippi, Gov't Text Messages Are Officially Public Records
Read more of this story at Slashdot.
one universe over someone writes a love song and everyone looks up from their build files, their minds: blown
| archive - contact - sexy exciting merchandise - cute - search - about | |||
 |
|||
| ← previous | February 18th, 2014 | next | |
|
February 18th, 2014: GUYS you know what comes out tomorrow? The Midas Flesh #3! I wrote it and Shelli and Braden drew it and if you like the Adventure Time comic (which we also create!) we think you'll like this too! You can read more about the book here, read the first few pages of the comic here, get the book at your local comic store, or get digital copies! Man look at all those links! MY advice is to probably click at least one of them!! One year ago today: pride and prejudice and printing errors – Ryan 
| |||
Crazy Kinetic Sideways-Opening Door is Unlike any Other

What would happen if an artist decided to redesign all of the mundane things we practically ignore every day? We imagine it would be something like this door. The Evolution Door, designed by artist Klemens Torggler, takes that whole slab-of-wood-with-hinges model and rethinks it entirely.
The door consists of two squares, each able to fold diagonally and attached to each other with a spinning hinge at one corner. The corner diagonal to that one on each piece is attached to the door frame with another spinning hinge, allowing the door to rotate in the middle to open and then close.
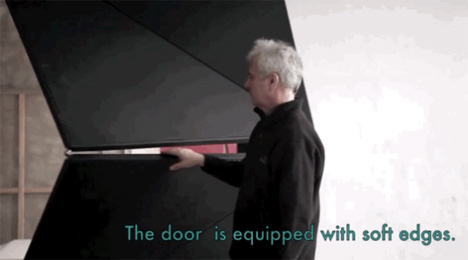
You might expect the door to be kind of dangerous, but Torggler explains that it has soft edges to avoid the eventual finger-pinching…or at least make it a little less painful. While it definitely couldn’t be used as an exterior door, the Evolution Door does look like an interesting conversation piece. It would be at home in the middle of a contemporary interior and, if the video of the door in action is any indication, it would provide endless hours of entertainment by simply opening and closing over and over.
Keep Going - Check Out These Great Related Dornob Articles:
Something Sounds Familiar About This London Ticket Gate...
But My Parents Are Deeeeeeeeeeead!
Comic for January 17, 2014
The Hardest Part About Moving into 2014
Submitted by: Unknown







![/bu|[rn]t|[coy]e|[mtg]a|j|iso|n[hl]|[ae]d|lev|sh|[lnd]i|[po]o|ls/ matches the last names of elected US presidents but not their opponents. /bu|[rn]t|[coy]e|[mtg]a|j|iso|n[hl]|[ae]d|lev|sh|[lnd]i|[po]o|ls/ matches the last names of elected US presidents but not their opponents.](http://imgs.xkcd.com/comics/regex_golf.png)