schwit1 quotes Space.com: A new explanation for a massive blast over a remote Siberian forest in 1908 is even stranger than the mysterious incident itself. Known as the Tunguska event, the blast flattened more than 80 million trees in seconds, over an area spanning nearly 800 square miles (2,000 square kilometers) — but left no crater. A meteor that exploded before hitting the ground was thought by many to be the culprit. However, a comet or asteroid would likely have left behind rocky fragments after blowing up, and no "smoking gun" remnants of a cosmic visitor have ever been found. Now, a team of researchers has proposed a solution to this long-standing puzzle: A large iron meteor hurtled toward Earth and came just close enough to generate a tremendous shock wave. But the meteor then curved away from our planet without breaking up, its mass and momentum carrying it onward in its journey through space.
An anonymous reader quotes a report from Scientific American: The tiny fossil is unassuming, as dinosaur remains go. It is not as big as an Apatosaurus femur or as impressive as a Tyrannosaurus jaw. The object is a just a scant shard of cartilage from the skull of a baby hadrosaur called Hypacrosaurus that perished more than 70 million years ago. But it may contain something never before seen from the depths of the Mesozoic era: degraded remnants of dinosaur DNA. [...] In a study published earlier this year, Chinese Academy of Sciences paleontologist Alida Bailleul and her colleagues proposed that in that fossil, they had found not only evidence of original proteins and cartilage-creating cells but a chemical signature consistent with DNA.
Recovering genetic material of such antiquity would be a major development. Working on more recently extinct creatures -- such as mammoths and giant ground sloths -- paleontologists have been able to revise family trees, explore the interrelatedness of species and even gain some insights into biological features such as variations in coloration. DNA from nonavian dinosaurs would add a wealth of new information about the biology of the "terrible lizards." Such a find would also establish the possibility that genetic material can remain detectable not just for one million years, but for tens of millions. The fossil record would not be bones and footprints alone: it would contain scraps of the genetic record that ties together all life on Earth. Yet first, paleontologists need to confirm that these possible genetic traces are the real thing. Such potential tatters of ancient DNA are not exactly Jurassic Park -- quality. At best, their biological makers seem to be degraded remnants of genes that cannot be read -- broken-down components rather than intact parts of a sequence. Still, these potential tatters of ancient DNA would be far older (by millions of years) than the next closest trace of degraded genetic material in the fossil record. "If upheld, Bailleul and her colleagues' findings would indicate that biochemical traces of organisms can persist for tens of millions of years longer than previously thought," the report adds. "And that would mean there may be an entire world of biological information experts are only just getting to know."
Iwastheone quotes Science News:
Astronomers have long known that the brightest part of the Milky Way, the pancake-shaped disk of stars that houses the sun, is some 120,000 light-years across. Beyond this stellar disk is a disk of gas. A vast halo of dark matter, presumably full of invisible particles, engulfs both disks and stretches far beyond them. But because the dark halo emits no light, its diameter is hard to measure. Now, Alis Deason, an astrophysicist at Durham University in England, and her colleagues have used nearby galaxies to locate the Milky Way's edge...
To find the Milky Way's edge, Deason's team conducted computer simulations of how giant galaxies like the Milky Way form. In particular, the scientists sought cases where two giant galaxies arose side by side, like the Milky Way and Andromeda, our nearest giant neighbor, because each galaxy's gravity tugs on the other. The simulations showed that just beyond the edge of a giant galaxy's dark halo, the velocities of small nearby galaxies drop sharply. Using existing telescope observations, Deason and her colleagues found a similar plunge in the speeds of small galaxies near the Milky Way. This occurred at a distance of about 950,000 light-years from the Milky Way's center, marking the galaxy's edge, the scientists say.
A Portuguese historian argues that Magellan's famous trip around the world in 1522 was much harder than sending humans to Mars:
Tens of guys died making this crossing; of 250 crew, only 18 returned, Henrique Leitao, a historian at the University of Lisbon, told me... [O]nce NASA or other space agencies or private entities actually launch humans on a six month trajectory to the Red planet, they will likely have mitigated the lion's share of risks to the crew. In contrast, Magellan's crew realized that at least a third of them would likely never survive their journey, says Leitao...
Is there a comparison between the Age of Discovery and drivers for the exploration and commercialization of space? One could argue that minerals on asteroids could be seen as the present-day equivalent of the Age of Discovery's highly-prized Asian spices. And that actually getting these 16th century spices back to Europe was arguably just as arduous and seemingly difficult as any initiative to return exotic materials from a near-Earth asteroid... Risk is inherent in any off-world human voyage. But when it comes to safety, today's technology and current knowledge of in situ conditions on Mars itself will arguably give future explorers an inherent edge over Magellan's generation.
The article also summarizes Leitao observation that one of the crew members who died on the trip was Magellan. "For 40 days Magellan walked around The Philippines; gets involved in a completely absurd fight with locals on a beach and is killed."
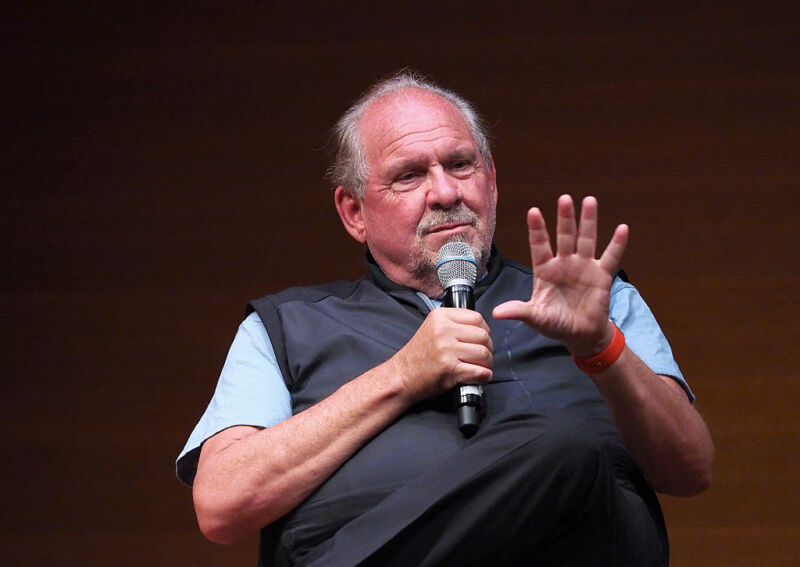
Enlarge / Producer Larry Brilliant speaks onstage at the HBO Documentary "Open Your Eyes" Special Screening At The Rubin Museum at Rubin Museum of Art on July 13, 2016 in New York City. (credit: Paul Zimmerman | Getty Images)
Larry Brilliant says he doesn’t have a crystal ball. But 14 years ago, Brilliant, the epidemiologist who helped eradicate smallpox, spoke to a TED audience and described what the next pandemic would look like. At the time, it sounded almost too horrible to take seriously. “A billion people would get sick," he said. “As many as 165 million people would die. There would be a global recession and depression, and the cost to our economy of $1 to $3 trillion would be far worse for everyone than merely 100 million people dying, because so many more people would lose their jobs and their health care benefits, that the consequences are almost unthinkable.”
Now the unthinkable is here, and Brilliant, the Chairman of the board of Ending Pandemics, is sharing expertise with those on the front lines. We are a long way from 100 million deaths due to the novel coronavirus, but it has turned our world upside down. Brilliant is trying not to say “I told you so” too often. But he did tell us so, not only in talks and writings, but as the senior technical advisor for the pandemic horror film Contagion, now a top streaming selection for the homebound. Besides working with the World Health Organization in the effort to end smallpox, Brilliant, who is now 75, has fought flu, polio, and blindness; once led Google’s nonprofit wing, Google.org; co-founded the conferencing system the Well; and has traveled with the Grateful Dead.
We've known about SARS-CoV-2 for only three months, but scientists can make some educated guesses about where it came from and why it's behaving in such an extreme way. From a report: The structure of the virus provides some clues about its success. In shape, it's essentially a spiky ball. Those spikes recognize and stick to a protein called ACE2, which is found on the surface of our cells: This is the first step to an infection. The exact contours of SARS-CoV-2's spikes allow it to stick far more strongly to ACE2 than SARS-classic did, and "it's likely that this is really crucial for person-to-person transmission," says Angela Rasmussen of Columbia University. In general terms, the tighter the bond, the less virus required to start an infection. There's another important feature. Coronavirus spikes consist of two connected halves, and the spike activates when those halves are separated; only then can the virus enter a host cell. In SARS-classic, this separation happens with some difficulty. But in SARS-CoV-2, the bridge that connects the two halves can be easily cut by an enzyme called furin, which is made by human cells and -- crucially -- is found across many tissues. "This is probably important for some of the really unusual things we see in this virus," says Kristian Andersen of Scripps Research Translational Institute. Further reading: How the Coronavirus Could Take Over Your Body (Before You Ever Feel It)
A medical device manufacturer has threatened to sue a group of volunteers in Italy that 3D printed a valve used for life-saving coronavirus treatments. From a report: The valve typically costs about $11,000 from the medical device manufacturer, but the volunteers were able to print replicas for about $1. A hospital in Italy was in need of the valves after running out while treating patients for COVID-19. The hospital's usual supplier said they could not make the valves in time to treat the patients. That launched a search for a way to 3D print a replica part, and Cristian Fracassi and Alessandro Ramaioli, who work at Italian startup Isinnova, offered their company's printer for the job. However, when the pair asked the manufacturer of the valves for blueprints they could use to print replicas, the company declined and threatened to sue for patent infringement. Fracassi and Ramaioli moved ahead anyway by measuring the valves and 3D printing three different versions of them.
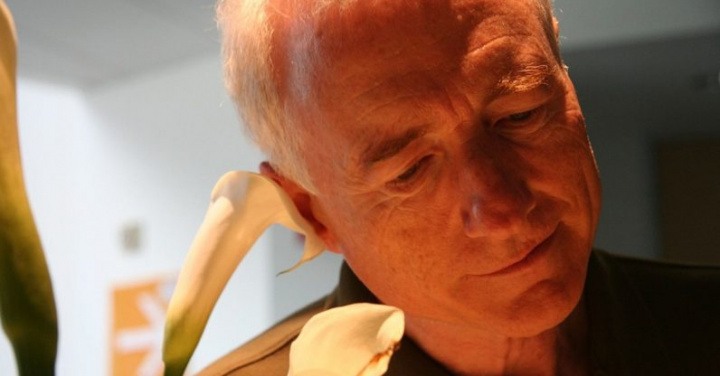
Quantos de nós não usam regularmente as funções de copiar e colar (Copy/Paste). É verdade hoje tais ações são algo banais, mas a verdade é que alguém teve de pensar nelas. Lawrence “Larry” Tesler,...
Even though it was, in most ways, identical to the present planet, the Earth still looked very different at the bottom of the last ice age 20,000 years ago. The globe was around 4°C cooler on average, and ice sheets covered large portions of the Northern Hemisphere, including Canada and Scandinavia. One thing you might wonder, given how much of the planet was barely habitable, is what migratory species did.
Given the loss of all that habitat to mile-thick glacial ice and a reduced winter-summer contrast courtesy of Earth’s orbital cycles, some researchers have hypothesized that bird migration wasn’t much of a thing then. Is it possible that bird species turned this behavior on and off through the ice ages?
A team led by Yale’s Marius Somveille tested this idea with a model of the factors controlling migratory behavior—and it predicts patterns surprisingly similar to the present day.
Recently a well-respected UI consulting firm (the Nielsen Norman Group) published their analysis of academic studies on the question of whether Dark Mode or Light Mode was better for reading?
Cosima Piepenbrock and her colleagues at the Institut für Experimentelle Psychologie in Düsseldorf, Germany studied two groups of adults with normal (or corrected-to-normal) vision: young adults (18 to 33 years old) and older adults (60 to 85 years old). None of the participants suffered from any eye diseases (e.g., cataract)... Their results showed that light mode won across all dimensions: irrespective of age, the positive contrast polarity was better for both visual-acuity tasks and for proofreading tasks...
Another study, published in the journal Human Factors by the same research group, looked at how text size interacts with contrast polarity in a proofreading task. It found that the positive-polarity advantage increased linearly as the font size was decreased: namely, the smaller the font, the better it is for users to see the text in light mode. Interestingly, even though their performance was better in the light mode, participants in the study did not report any difference in their perception of text readability (e.g., their ability to focus on text) in light versus dark mode — which only reinforces the first rule of usability: don't listen to users...
While dark mode may present some advantages for some low-vision users — in particular, those with cloudy ocular media such as cataract, the research evidence points in the direction of an advantage of positive polarity for normal-vision users. In other words, in users with normal vision, light mode leads to better performance most of the time... These findings are best explained by the fact that, with positive contrast polarity, there is more overall light and so the pupil contracts more. As a result, there are fewer spherical aberrations, greater depth of field, and overall better ability to focus on details without tiring the eyes...
That being said, we strongly recommend that designers allow users to switch to dark mode if they want to — for three reasons: (1) there may be long-term effects associated with light mode; (2) some people with visual impairments will do better with dark mode; and (3) some users simply like dark mode better.
The long-term effects associated with light mode come from an "intriguing" 2018 study they found which argued that reading white text from a black screen or tablet "may be a way to inhibit myopia, while conventional black text on white background may stimulate myopia..."
The researchers wrote that myopia "is tightly linked to the educational status and is on the rise worldwide."
Researchers have successfully bypassed the eyes with a brain implant that allows rudimentary vision. MIT Technology Review reports: "Alli," says Bernardeta Gomez in her native Spanish, pointing to a large black line running across a white sheet of cardboard propped at arm's length in front of her. "There." It isn't exactly an impressive feat for a 57-year-old woman -- except that Gomez is blind. And she's been that way for over a decade. When she was 42, toxic optic neuropathy destroyed the bundles of nerves that connect Gomez's eyes to her brain, rendering her totally without sight. She's unable even to detect light. But after 16 years of darkness, Gomez was given a six-month window during which she could see a very low-resolution semblance of the world represented by glowing white-yellow dots and shapes. This was possible thanks to a modified pair of glasses, blacked out and fitted with a tiny camera. The contraption is hooked up to a computer that processes a live video feed, turning it into electronic signals. A cable suspended from the ceiling links the system to a port embedded in the back of Gomez's skull that is wired to a 100-electrode implant in the visual cortex in the rear of her brain.
Using this, Gomez identified ceiling lights, letters, basic shapes printed on paper, and people. She even played a simple Pac-Man-like computer game piped directly into her brain. Four days a week for the duration of the experiment, Gomez was led to a lab by her sighted husband and hooked into the system. Gomez's first moment of sight, at the end of 2018, was the culmination of decades of research by Eduardo Fernandez, director of neuroengineering at the University of Miguel Hernandez, in Elche, Spain. His goal: to return sight to as many as possible of the 36 million blind people worldwide who wish to see again. Fernandez's approach is particularly exciting because it bypasses the eye and optical nerves.
Iwastheone quotes Inverse: In an incredible feat of remote engineering, NASA has fixed one of the most intrepid explorers in human history. Voyager 2, currently some 11.5 billion miles from Earth, is back online and resuming its mission to collect scientific data on the solar system and the interstellar space beyond. On Wednesday, February 5 at 10:00 p.m. Eastern, NASA's Voyager Twitter account gave out the good news: Voyager 2 is not only stable, but is back at its critical science mission. "My twin is back to taking science data, and the team at @NASAJPL is evaluating the health of the instruments after their brief shutoff," the account tweeted... In a statement, NASA confirmed that Voyager 2 is back in business. "Mission operators report that Voyager 2 continues to be stable and that communications between the Earth and the spacecraft are good...." The fix is no mean feat: It takes 17 hours one-way to communicate with Voyager 2 from Earth, which is the furthest away manmade object in space. That means a single information relay takes 34 hours.
monkeyFuzz quotes Inverse: One of the problems with solar panels is that they don't generate electricity at night, so we have to store the electricity they generate during the day to power things during the evening. That works fine, but what if we could develop solar panels that did generate electricity at night? It's possible, and the way it works is pretty surprising. Researchers from the University of California, Davis explain in a new paper that was just published in the journal ACS Photonics that if you want to create a solar panel that generates electricity at night, then you just have to create one that operates the exact opposite way solar panels work during the day. It's being referred to as the 'anti-solar panel.'
The paper's author explains to Inverse that as heat flows from Earth to outer space, "it's picking that off and converting that into power," using a thermoradiative cell instead of a photovoltaic cell, and he's now working with his team to develop prototypes.
And another paper in September from Stanford researchers also explored the idea of generating electricity at night.
NASA's Parker Solar Probe is healthy and operating as designed following its fourth close approach to the Sun, called perihelion, on Jan. 29. From a report: Mission controllers at the Johns Hopkins Applied Physics Laboratory in Laurel, Maryland, received a "status A" beacon from the spacecraft at 5:20 a.m. EST on Feb. 1. Status A is the best of four possible status signals, and indicates that the spacecraft is operating nominally and the instrument suites are collecting science data. This status also indicates that any minor issues that may have occurred were identified and resolved by Parker Solar Probe's onboard autonomy and fault management systems.
During this perihelion, Parker Solar Probe broke its own records for speed and proximity to the Sun for a human-made object. The spacecraft reached a speed of 244,255 miles per hour (about 393,044 kilometers per hour) as it whipped around the Sun at a distance of 11.6 million miles (about 18.6 million kilometers). Parker Solar Probe's heat shield, called the Thermal Protection System, or TPS, reached new record temperatures as well. At this distance from the Sun, computer modeling estimates show that the Sun-facing side of the TPS experienced a blazing 1,134 degrees Fahrenheit (612 degrees C), about 300 degrees hotter than encountered on the spacecraft's previous three perihelia. The spacecraft and instruments behind this protective heat shield remained at a temperature of about 85 F (30 C). During the spacecraft's closest three perihelia in 2024-25, the TPS will see temperatures around 2,500 F (1,370 C).
Ninety-nine used smartphones, rolling down a sunny street...
It turns out, if you're creative enough, you can use one of the most common of childhood toys to make Google Maps display false real-time data. All you need is a little red wagon—and a hundred cheap smartphones.
The little red wagon full of phones is the idea of German artist Simon Weckert, whose projects focus on "hidden layers" in technology and examine the social and moral effects of the modern electronics-based lifestyle.
Google Maps determines congestion by gathering the location and motion speed of phones in a given area. Generally speaking, those phones are going to be in the road because they're with drivers, inside vehicles, and so measuring the phones' speed is a reasonably decent proxy for measuring vehicle speed. Those data points, aggregated, make a road look green on the map if traffic seems to be moving smoothly, or they look red on the map if traffic appears to be severe. When traffic is severe, the map's navigation software will reroute drivers around the congestion when possible.
Enlarge / The Facebook logo is displayed on a TV screen on September 9, 2019, in Paris, France. (credit: Chesnot | Getty Images)
After years of promising increased transparency, Facebook is getting granular and showing you how it picks up and mashes together data about you from other companies. Facebook's new tool is indeed illuminating when it comes to getting a glimpse at who tracks you (spoiler: everyone). Its promises to give you a measure of control over the process, however, fall short.
Facebook this week launched an Off-Facebook Activity portal to give users a different and more detailed perspective on the data it hoovers up from other firms. Off-Facebook Activity is exactly what it sounds like: interactions you have with other entities, such as an app on your phone or a retailer you shop at, that Facebook receives data about. Facebook attaches that data to the rest of the information it has about you and uses it for marketing purposes.
Enlarge / Spilled garbage on the beach off the Black Sea in Bulgaria. (credit: iStock / Getty Images Plus)
The English metallurgist Alexander Parkes never saw the widespread realization of his spectacular 19th-century invention, celluloid, the first plastic. While a revolutionary breakthrough, Parkesine, as it was called, was expensive and brittle. It was used in objects like buttons and combs, but ultimately quality control issues led Parkes’ company to bankruptcy in 1868 just 12 years after the discovery.
Parkesine, however, was also the first bioplastic—a plastic made from renewable plant material instead of fossil fuels. And today with the environmental impact of plastics increasingly on the public mind, bioplastics are making a big comeback. They’re proposed by some as the solution to beaches deluged with plastic and fish bellies stuffed with bottle caps. And perhaps bioplastics can replace oil-based polymers that commonly trash oceans with materials that can break down more easily and would protect a planet already smothered in these resilient substances.
Bioplastic items already exist, of course, but whether they’re actually better for the environment or can truly compete with traditional plastics is complicated. Some bioplastics aren’t much better than fossil fuel-based polymers. And for the few that are less injurious to the planet, cost and social acceptance may stand in the way. Even if widespread adoption of bioplastics occurs down the line, it won’t be a quick or cheap fix. In the meantime, there is also some pollution caused by bioplastics themselves to consider. Even if bioplastics are often less damaging than the status quo, they aren’t a flawless solution.
sciencehabit quotes Science magazine:
Nearly 2600 years ago, a man was beheaded near modern-day York, U.K. -- for what reasons, we still don't know -- and his head was quickly buried in the clay-rich mud. When researchers found his skull in 2008, they were startled to find that his brain tissue, which normally rots rapidly after death, had survived for millennia -- even maintaining features such as folds and grooves.
Now, researchers think they know why. Using several molecular techniques to examine the remaining tissue, the researchers figured out that two structural proteins -- which act as the "skeletons" of neurons and astrocytes -- were more tightly packed in the ancient brain. In a yearlong experiment, they found that these aggregated proteins were also more stable than those in modern-day brains. In fact, the ancient protein clumps may have helped preserve the structure of the soft tissue for ages, the researchers report today in the Journal of the Royal Society Interface.
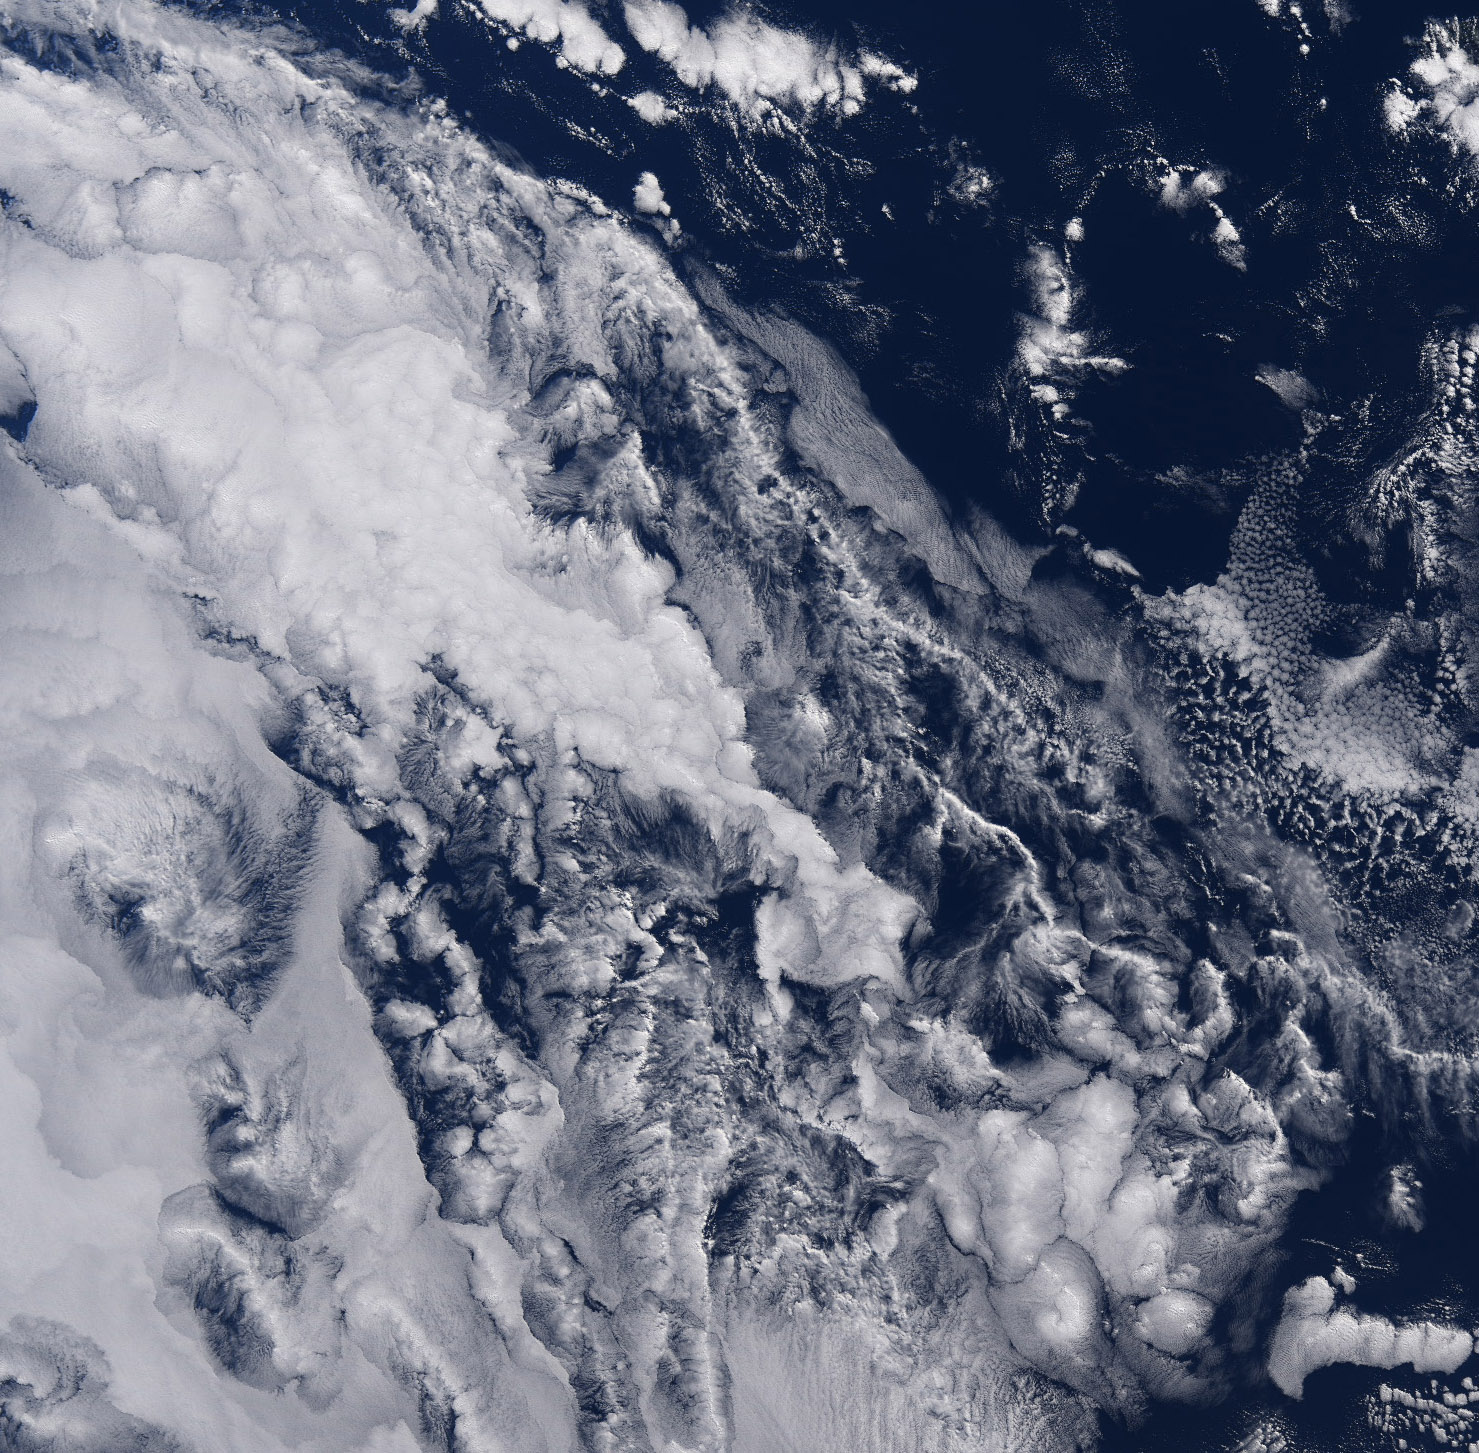
Ahead of every Intergovernmental Panel on Climate Change (IPCC) report, the world’s climate modeling centers produce a central database of standardized simulations. Over the past year, an interesting trend has become apparent in the most recent round of this effort: the latest and greatest versions of these models are, on average, more sensitive to CO2, warming more in response to it than previous iterations. So what’s behind that behavior, and what does it tell us about the real world?
Climate sensitivity is one of the most-discussed numbers in climate science. Its most common formulation is the amount of warming that occurs when the concentration of CO2 in the atmosphere is doubled and the planet gets a century or two to come to a new equilibrium. It's an easy way to get a sense of what our emissions are likely to end up doing.
In climate models, this number is not chosen in advance; it emerges from all the physics and chemistry in the model. That means that as modeled processes are updated to improve their realism, the overall climate sensitivity of the model can change. As results have trickled in from the latest generation of models, their average climate sensitivity has noticeably increased. A new study led by Mark Zelinka of the Lawrence Livermore National Laboratory analyzes these new model simulations, comparing their behavior to the previous generation.
Peter Kirstein, a British computer scientist who was widely recognized as the father of the European internet, died on Wednesday at the age of 86. According to his daughter Sara Lynn Black, the cause was a brain tumor. The New York Times reports: Professor Kirstein fashioned his pivotal role in computer networking the old-fashioned way: through human connections. In 1982, his collegial ties to American scientists working in the nascent field of computer networks led him to adopt their standards in his own London research lab. Those standards were called Transmission Control Protocol and Internet Protocol, or TCP/IP, which enable different computer networks to share information. Professor Kirstein embraced TCP/IP despite competing protocols being put forward at the time by international standards groups.
"Peter was the internet's great champion in Europe," said Vinton G. Cerf, an American internet pioneer who was a developer of TCP/IP and a colleague and friend of Professor Kirstein's. "With skill and finesse, he resisted enormous pressure to adopt alternatives." Professor Kirstein was so avid a fan of computer networking that he gave Queen Elizabeth II her own email address, HME2. In 1976, while christening a telecommunications research center in Malvern, England, the queen became one of the first heads of state to send an email.
harrymcc writes: This week at CES, Delta is previewing a display technology called parallel reality. Created by a startup called Misapplied Sciences, it uses pixels that can aim different colors at different physical locations, allowing for signage that shows different information to multiple people at the same time. Delta plans to install it at the Detroit Metropolitan Airport by midyear to allow travelers to see just their own travel info rather than a sea of flights. I talked with the CEOs of Delta and Misapplied Sciences, along with others, for a story on the tech over at Fast Company.
sciencehabit writes: Millions of years from now, advanced humans -- or perhaps visiting aliens -- may dig up the remnants of today's civilizations. What are they likely to find, and how will they interpret our relationship with the creatures around us? A new study reveals that archaeologists will need to rely on bones, not any of our former technology. "If you read a lot of postapocalyptic science fiction, one of the things that disappears in almost all cases is written records, computer records, things like that," says one of the scientists. "There are computer records and code from decades ago that modern computers can't recognize because it's so far out of alignment. So imagine two million years from now... So what are we left with? It's whatever is buried in the ground." And what will that be? Well, lots of humans, cows, and chickens. And, of course, tons of cats and dogs. "Of all the animals, dogs and cats are more likely to be buried in a manner similar to people," says another scientist. "There are pet cemeteries that are set up similar to human memorial parks. So if anything like that is stumbled upon, that's going to say something different than a pit that people threw a bunch of pigs into randomly. I think it's going to be obvious that we felt differently about dogs and cats versus pigs and cows and chickens."
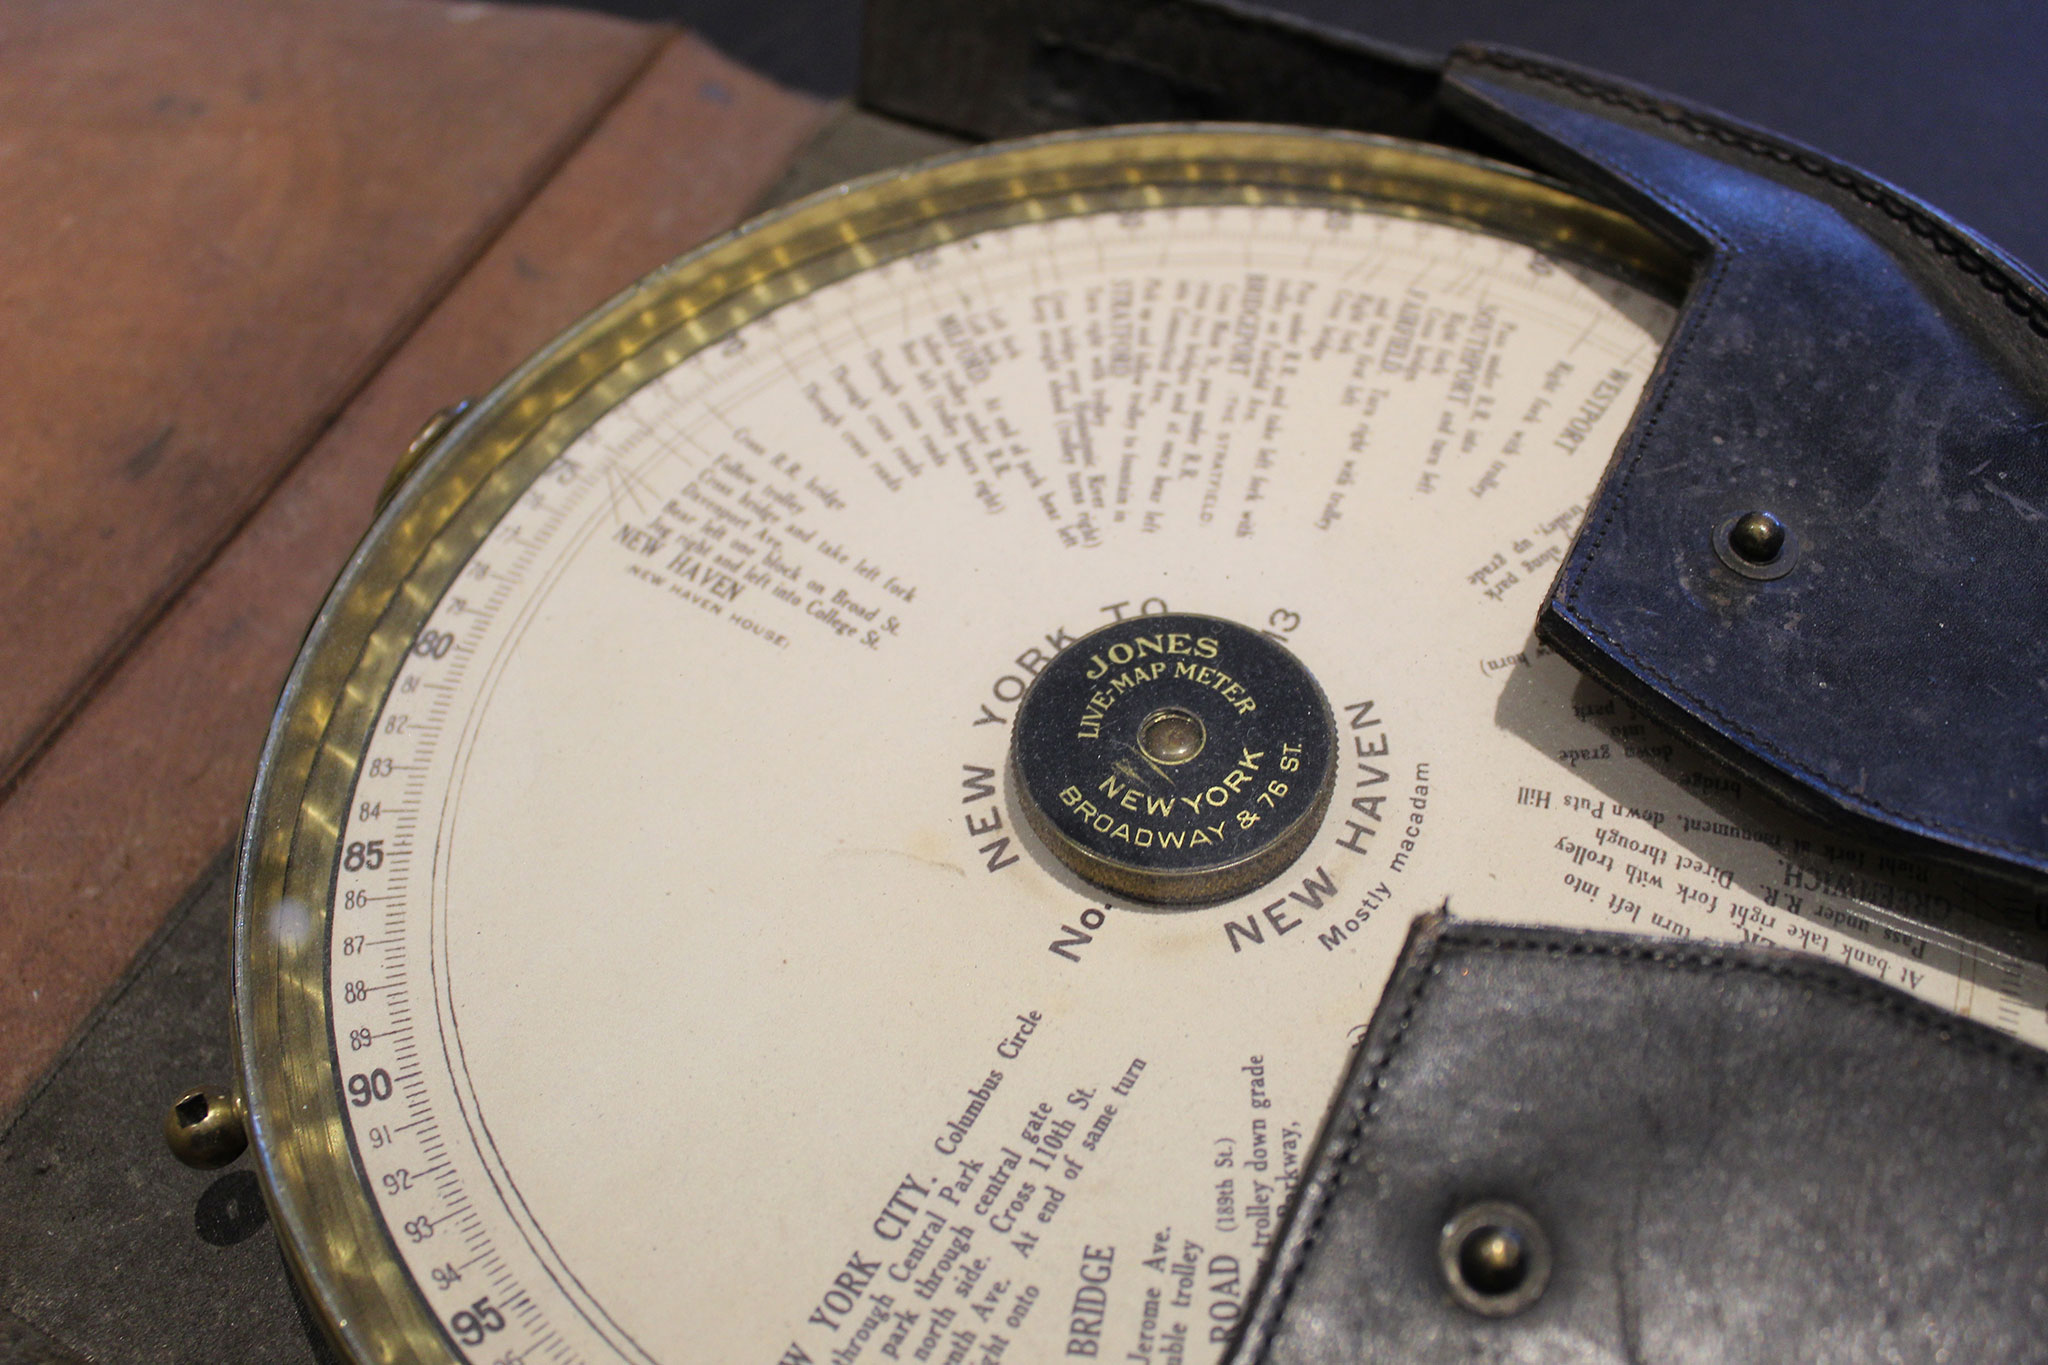
Enlarge / The Jones Live Map was an early 20th century attempt at turn-by-turn navigation. (credit: Seal Cove Auto Museum)
It’s easy to take modern GPS navigation for granted; it’s no longer a novelty. Not only is it offered on the dashboard of your car, it’s on every smartphone in everyone’s purse or pocket. But if you think in-car navigation systems started with Garmin in 1991, guess again.
The more savvy amateur car historians might think in-car navigation began with the Etak Navigator. The brainchild of engineer Stan Honey and financier Nolan Bushnell (the cofounder of Atari), Etak was launched in 1985 without use of the US Military’s Global Positioning System—the addition of GPS wouldn’t happen for another decade. Yet Etak paved the way for the systems that followed, using digitized maps stored on cassette tapes since they could resist a bumpy car ride or the heat of a car interior on a hot day. Information was posted on a vector-based CRT screen. Each tape held 3.5MB of map data. A windshield-mounted electronic compass mated to wheel sensors to determine the vehicle’s speed and direction. Two models were offered: the 700, with a 7-inch screen for $1,595, and the 450, with a 4.5-inch screen for $1,395. Map cassettes cost $35 each. Initially offered only with San Francisco-area maps, Etak soon offered other major metro areas, with installation provided by local car stereo and cell phone shops.
Initially successful, sales inevitably slumped. In 1989, Etak was purchased by News Corporation for $25 million, followed by Sony Corporation and others before being absorbed into Tom Tom.
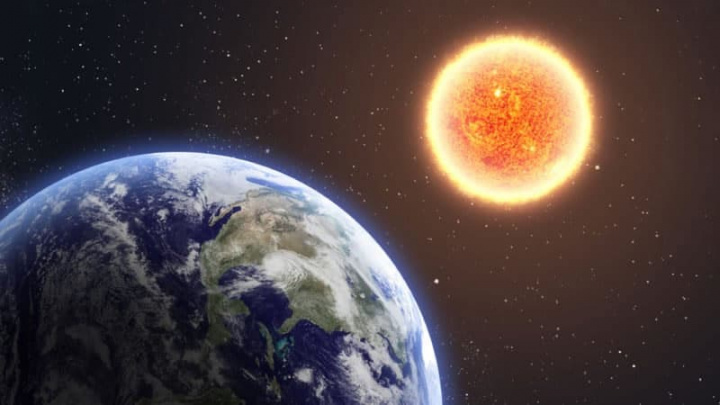
A Terra atinge hoje o periélio da sua órbita. Assim, o planeta estará no ponto mais próximo do Sol na sua trajetória. Então, quando um corpo se encontra no periélio, ele tem a maior...


