Shared posts

02 Apr 06:47

The Mystery of the Sea Unicorn

by Carl Zimmer

In 1577, the English explorer Martin Frobisher led an expedition of 150 men to the northern reaches of Canada, in search of a passage to India and a fortune in gold. As they surveyed the islands near the coast, they came across something Frobisher could never have anticipated: a unicorn fish.

“Upon another small island here,” Frobisher wrote in his journal, “was also found a great dead fish, which, as it would seem, had been embayed with ice, and was in proportion round like to a porpoise, being about twelve foot long, and in bigness answerable, having a horn of two yards long growing out of the snout or nostrils. This horn is wreathed and straight, like in fashion to a taper made of wax, and may truly thought to be the sea-unicorn.”

When Frobisher returned to England, he presented the horn to Queen Elizabeth, who commanded that it be kept with the crown jewels.

Unicorn horns–or at least what traders claimed were unicorn horns–had circulated around Europe for centuries before Frobisher’s voyage. They were worth many times their weight in gold; Elizabeth was said to have paid 10,000 pounds for a unicorn horn, the price of a castle. Unicorn horn was in the cups that monarchs drank from, the scepters that they wielded.

The myth of the unicorn reaches back to the classical world, but the business of unicorn horn trade was sustained through the Middle Ages and the Renaissance by Vikings who killed the so-called sea unicorns in the North Atlantic, cut off their horns, and sold them at astronomical prices–never revealing their origin.

As Europeans naturalists became more familiar with the world’s animals, the myth of the unicorn faded, and it became clear that Frobisher’s sea-unicorn was actually a whale–what is known today as the narwhal. But while the source of the horn has become clear, the horn itself still inspires confusion and debate among scientists.

Narwhals outside Pond Inlet in Tremblay Sound, Canada. Photo: Glenn Williams

Narwhals outside Pond Inlet in Tremblay Sound, Canada. Photo: Glenn Williams

The horn is not a horn at all, but a tooth. The relatives of narwhals include species like beluga whales, orcas, and dolphins. They all have sets of simple, peg-like teeth in their mouths they use to catch prey. In the mouth of male narwhals, one tooth has grown to monstrous proportions, its counterpart usually growing to a much shorter length. The narwhal’s tooth is comparable to the tusks of elephants or warthogs, but doesn’t have a hint of a curve to it.

But why should a whale grow a tusk? Or, more precisely, how did such a freakish tooth evolve in this one species after its ancestors branched off from whales with ordinary teeth?

The ideas scientists have put forward over the years have been legion. The list includes–but is not limited to–an acoustic probe, a means for dumping extra heat, a rudder, an ice-picker, and a spear for battling predators or perhaps other narwhals. Most of those ideas emerged not from close observation but speculation. The narwhals live in remote Arctic fjords and the ice-strewn ocean. They do not make it easy for scientists to see them use their tusk for anything at all.

Martin Nweeia, a Connecticut dentist and a clinical instructor at the Harvard School of Dental Medicine, has been traveling to the Arctic for fourteen years to study narwhals, and, in particular, their tusks. He’s given some scientific talks about his research over the years and published some details in book chapters. But now he and a team of colleagues from Harvard, the Smithsonian, the University of Minnesota, Fisheries and Oceans Canada, and elsewhere have published a detailed account of their studies on the narwhal tusk in the Anatomical Record. They conclude that the tusk is a sense organ that lets male narwhals perceive the ocean, possibly helping them find mates or food.

Part of their argument is based on the anatomy of the tusk. Rather than being a solid hunk of bone, it’s shot through with nerves. And it appears specially adapted to bring those nerves nearly in contact with sea water. In us and in other mammals, teeth are armored in sheets of enamel. Narwals don’t have enamel on their tusks. Instead, the surface of the tusk is covered in fine channels that can bring water down into the tusk’s interior, close to the nerve endings there. And some of those nerve endings have the structure you find in nerves sensitive to pain.

To see if the narwhals used this intricate anatomy to sense their surroundings, Nweeia and his colleagues captured live narwhals off of Baffin Island and slipped a conical jacket over their tusks. The scientists then pumped water into the jacket, either with a high or a low level of salt. Electrodes that Nweeia’s team put on the skin of the narwhals measured their heart rate through the experiment, which only lasted less than half an hour per animal.

When the scientists put salt water into the tusk jacket, they recorded an average heartbeat of 60.42 beats per minute. But when they poured in fresh water, the heart beat more slowly, at 52.56 beats per minute. The difference was statistically significant, and the scientists took it to mean that the narwhals could sense the difference between salt and fresh water with their tusk alone. It’s possible that when the narwhals swim into salty water, they feel a pain akin to a toothache. It’s also possible that other nerve endings in the tusk sense other things, such as temperature or pressure.

Here is a figure that elegantly sums up the anatomy they found:

Neeiwa et al, Anatomical Record. Click to enlarge

Neeiwa et al, Anatomical Record. Click to enlarge

If the narwhal tusk is indeed a sensory organ, it’s only benefiting the males. Nweeia and his colleagues suggest that the males may use it to sense things that can help them win mates. They may be able to track down female narwhals by sampling the chemicals in the water, searching for the ones found where the females feed. They might even be able to sense whether females are receptive for mating from the chemicals they release. Some males might be able to use their tusk to find food for newborn calves. Males with more sensitive tusks would have better luck at reproducing than others, and that difference would drive the evolution of the wildly elongated tusk.

I got in touch with some other experts on whale anatomy to see what they thought of all this. In general, they were pretty dazzled by the data Nweeia and his colleagues have brought together.

“They have done a great job collating several hundred years of hypotheses about narwhal tusk function, and then throwing nearly every existing line of evidence at the problem,” Nick Pyenson, the curator of marine mammals of the Smithsonian Institution told me.

Joy Reidenberg, the Icahn School of Medicine anatomist whom I wrote about last year, summed up her reaction as, “WOW.” Each line of evidence they compiled could have been a separate paper, and she gave Nweeia and his colleagues high praise for combining them all into one coherent account. “It is so refreshing to see a paper where the focus is not on the least publishable unit, but rather, on a comprehensive understanding of form, function, and evolution.”

small-boy-with-tusk

Inuit boy with narwhal tusk. Maynard Owen Williams/National Geographic Creative

But some researchers were not persuaded by the conclusions that Nweeia and his colleagues drew from all that data. Their biggest critic was Kristin Laidre of the University of Washington. For starters, she notes that having sensitive teeth is not unique to narwhals. “When you eat ice cream, your teeth hurt, and the nerves in your teeth tell your brain you’re eating something cold,” she told me.

That’s good information to have, but it wouldn’t make sense to say that our teeth are sense organs. They evolved to let us bite and grind food.

Nweeia and his colleagues acknowledge that teeth can sense things in other species, but they argue that the narwhal tusk is doing something beyond what ordinary teeth are capable of. Laidre doesn’t think that the heartbeat readings let them reach that conclusion. “Heart rate collected 30 minutes after an animal has been put through an invasive net capture event and beached in shallow water tells you the animal is stressed, not how it reacts to various saline solutions on its tooth,” she told me.

Laidre also disputes the scenarios Nweeia and his colleagues present for how males might use their tusks for sensing. Studies on the stomach contents of narwhals have revealed that males and females feed on the same kind of prey, in the same parts of the ocean, at the same times of year. And it’s females that care for young narwhals, without any evidence that males provide any help. Females are so important for the survival of young narwhals, in fact, that Laidre has a hard time imagining males having such a sensitive organ and the females lacking it.

The notion of the tusk being a critical sensory organ, says Laidre, “remains a toothless theory with no supporting data.”

Instead, Laidre suspects male narwhals use their tusks to compete for mates. Scientists can’t watch them use their tusks as easily as they can watch elk lock antlers or fiddler crabs flip each other over with their giant claws. But they have seen male narwhals “tusking”–that is, crossing their tusks at the surface of the water. And they’ve seen females nearby when this happens, where they may be developing a preference for a particular male.

The last person I consulted about the narwhal study was not a whale expert at all, but a biologist who studies beetles. Douglas Emlen of the University of Montana studies the absurdly giant horns of rhinoceros beetles and other species. He’s taught me a lot about animal weapons in general as we’ve co-authored a textbook on evolution. (On a related note, you can pre-order his fabulous book on weapons, that’s coming out in November).

When I asked him what he thought about the debate over narwhal tusks, he pointed me to a fascinating study published by his student Erin McCullough last year with Robert Zinna of Washington State University. They took a close look at the horn of the Giant Rhinoceros Beetle from Japan. Its surface turns out to be covered with touch-sensitive hairs. Some parts of the horn are densely covered in hair, while others are sparser.

Photo by Seongbin Im http://flic.kr/p/7dYo5v

Photo by Seongbin Im http://flic.kr/p/7dYo5v

And McCullough and Zinna found a pattern to the hairs. When two male beetles prepare for battle on a tree branch, they approach each other and tap their horns together. If one is much smaller than the other, it will then back away. If they’re equally matched, they then take the conflict to the next level, and try to toss each other off the branch. It turns out that the densest patches of sensory hairs are precisely where the beetle horns make contact with the horns of their enemies.

Perhaps narwhals are the beetles of the whale world. Choosing between a sensory organ and a weapon may be a false choice. Perhaps male narwhals do go into battle, but they size up their opponents first.

Even if someone were to run with that idea, it would probably be a long time before they confirmed it–if they ever did. It’s been 437 years since Frobisher laid eyes on a dead narwhal, and it’s not that much easier today for scientists to see much more of this strange but elusive species.

[Related: "Narwhal's Trademark Tusk Acts Like a Sensor, Scientist Says."]

[Reference: Sensory Ability in the Narwhal Tooth Organ System, Nweeia et al, Anatomical Record 2013, in press]

24 Mar 19:13

Answers

Tertiarymatt

It's just metabolically expensive to be awake all the damn time, I reckon. Enough that trying to do all your "awake" stuff and perform the sorts of tasks that seem to happen during sleep is probably not a great idea for organismal fitness.

Stanford sleep researcher William Dement said that after 50 years of studying sleep, the only really solid explanation he knows for why we do it is 'because we get sleepy'.
24 Mar 18:26

New edition of Ubersleep out.

Tertiarymatt

For all who think sleep is bullshit, and want to do as little of it as possible.

A bit of history on Ubersleep: Nap-Based Sleep Schedules and the Polyphasic Lifestyle I published the First Edition of this book in 2008. It collects all the information I gained from my early experiments and discussions with polyphasers, back when the only other writings on the topic were Stampi’s highly-technical report and my Everything2 node on Uberman. (I swear, when I first wrote about Uberman I thought, “Surely the ‘Net knows all about this already, and people just call it something else…” I spent about 2 weeks scouring the online world, in multiple languages, trying to find links to give to all of the people who were suddenly emailing me! …Then I rather foolishly decided that if I started collecting and publishing the information I had gathered from being polyphasic myself and helping other people adjust, I would get less emails. …I’ve grown a bit wiser since then, obviously… ;) Ubersleep: Nap-Based Sleep Schedules and the Polyphasic Lifestyle started out as an instruction manual, but grew much bigger as I wrote it. It’s now everything I know about polyphasic sleep, including the whole ridiculous list of stuff you see below, masquerading as a Table of Contents. Right now the book is self-published, which means that a) it’s pretty cheap, and b) you can only get it on the Internet (NOTE: This is likely to change, as the Second Edition will be offered to bookstores starting in late 2013). Feel free to leave any comments you have on the book here; or, if you’d like to review it, you can do so at the book’s page on Lulu or on Amazon. Thanks very much to everyone who encouraged the writing of this book, and to everyone who’s bought it or will buy it, and who starred it or reviewed it — Thanks tons! The whole project has been immensely fulfilling for me, not to mention having made me a few bucks. ;) Thanks!!

24 Mar 17:31

life or death

by Ian

life or death

22 Mar 08:27

DOOM, DOOM, DOOM, DEPRESSION AND BEING DOOMED

by Islander
Tertiarymatt

Global doom.

(In this post DGR takes us on a globe-hopping tour of recent releases that fall within the varied realms of doom.)

It’s hard to believe that it is already March. Of course, I say that every year because February feels like a bullshit month with its short amount of days, but still. Sacramento has decided to park its hot ass right at about eighty degrees for the next week or so, yet I still find myself feeling bleak and down. Maybe it was the promise of grey skies and rain, but I found myself surfing the web seeking out doom in all its various forms and today I’d like to share with you some of the discoveries that I made.

A couple were found by just wading through circles on Facebook and by the random band button on Metal-Archives, which is always an interesting experiment in its own right. You could probably do a whole feature on that some day with the right amount of time and investment. As I wrote this over the past week or so, I kept adding more and more bands that I was coming across and wanted to talk about, so I apologize if this gets a little too verbose, but I figured it might be worth it to concentrate a bunch of smaller reviews into a post than spread out a bunch of giant tomes on a group of really good EPs.

Plus, maybe we’ll expose people to multiple groups in this one post. On top of that, I’m going to add in a little mini-review of an artist we’ve covered before in one of our ‘free music’ updates — as they released a new album earlier this year and it’ll be a good change of pace from all the roiling waters and restless seas you’re about to get dragged through. If anything, the tempo change will probably be appreciated.


Frequency Of Butterfly Wings

Frequency Of Butterfly Wings are a melodeath/doom band hailing from Tehran, Iran. You may have noticed that I made a small crack about finding them via surfing Facebook in my Separatist review. The group is relatively new (in as much as a band that has been going for five years can be) in terms of releases, with one album, a single, and an EP to their name, yet they play with the skill of seasoned musicians with tremendous knowledge of the genre.

The group’s EP The Weight Of Existence is available for free on a variety of outlets (I’ve found SoundCloud to be the most reliable) and runs five tracks and about twenty minutes long. The band alternate between music with a heavy early Anathema feel to the more common circle of groups like Daylight Dies and Enshine, with anguished growls being the order of the day — but that doesn’t really limit the band much in the way of sound. At times, they even channel the slow gloomy despair of a group like My Dying Bride as well as even ripping out some blues-inspired guitar solos with a ton of soul to them.

The music is more related to the European ethereal and pretty styles of doom than the fuzzed-out, punishingly slow doom side of the genre. The group rely heavily on dual vocals, with female accompaniment often traveling alongside vocalist Ashkan Mousavi.

The Weight Of Existence came out in late January and it’s a good mark for a band that is starting to make its way into the doom spectrum’s collective consciousness. As of right now they have no one sitting behind the kit, so on the off chance anyone reads this and can help them out so we can get more from these dudes in the future, that would be great.

https://soundcloud.com/f-o-b-w


Mist Of Nihil

We’ll continue our bit of globe-trotting and catch a flight from Iran to Greece and hail a cab into Athens where we meet up with Mist Of Nihil, a just-starting-out band with their February release Buried Laments, available at name your own price right now. The band tread in circles similar to those of Frequency Of Butterfly Wings in terms of influences, but play it a little straighter in terms of the slow pace, anguished growls, and ethereal guitar work. The group are like crashing waves on the side of a rocky cliff and can bring on that drowning feeling that you’re looking for when you come to the doom genre.

The main meat of this release consists of three, almost seven-minute-long songs with a three-minute bookender on each one, meaning you’ll get about twenty-five minutes of sheer misery in the company of the band. The group claim Insomnium as an influence and you can certainly hear it in some of the slower passages, and they have a knack for writing in the same guitar-playing style. The song “Light The Fire” is pretty close on that front, especially as it switches from its clean intro to distorted guitars and the whole band kicks in.

As a young group, Mist Of Nihil have taken a solid first step with Buried Laments and now they just have to work on getting out there for people to hear. Hopefully, Buried Laments does so on that front.

http://mistofnihil.bandcamp.com/


Shattered Hope

We remain in Athens, Greece! This time, things get crushingly slow with the funereal doom and death march of Shattered Hope and their release Waters Of Lethe  out on Solitude Productions. There’s only six tracks on Waters Of Lethe and the reason why should be familiar to people who may have seen me review bands like Inborn Suffering or The Howling Void – each song easily surpasses the ten-minute mark, no question, and the last song sits comfortably at seventeen. That means this disc is like wading through a swamp of despair, with the wind screaming around you.

Each song is full of moments of sheer punishment and gloom, as well as the swells of beauty that often feel like an oasis in a desert, recharging the listeners as we lumber through each track, belabored movement and all. This is one of those discs for which you really need to be prepared for a journey, because it extends into the far reaches of an immense, barren landscape — yet if you are prepared, this is an albums that overcomes the incredibly difficult challenge of keeping a listener locked in place. It’s like having to crawl your way out of a pit that you’ve fallen into, and sometimes you’re just in the mood for that sort of crushing despair — something that Shattered Hope have had years to perfect, and they deal in it in spades.

The band are asking for $4 USD right now on Bandcamp for this disc, and it is easily worth it.

http://shatteredhope.bandcamp.com/album/waters-of-lethe


Antimatter

If you’ve followed the site for a bit then you know that one of the few bands I will personally champion as ‘One of the groups people MUST listen to’ is the UK’s Antimatter. Antimatter was initially formed as project that featured musicians Duncan Patterson (of Anathema, who would quit that band to work on Antimatter) and Mick Moss, who over the years has become the lead figure of the band as well as having been its voice for so many years.

The music is highly intelligent and depressing in the way only Mick can do, which leads me to believe that the guy must lead a relentlessly cheerful life outside of his musical career, because if the body of work that he’s put out with Antimatter is to be believed, you wouldn’t fault him one bit if he decided to walk out in front of a bus one day. Dude can evoke a grey sky and rain like no other, and few doom bands are even able to achieve the sense of melancholy that Antimatter can put forth in their music.

I sang the praises of their previous release Fear Of A Unique Identity back when it came out, especially the lead-off single “Uniformed And Black”, but over time found myself more drawn to the slower acoustic numbers like “A Place In The Sun”. The group released a new single on March 18th entitled “Too Late” that seems to be forging further ahead with the sound found on Fear Of A Unique Identity — itself a refinement of earlier works like “Portrait Of A Young Man As An Artist” (a highly recommended listen) from Planetary Confinement and “Another Face In The Window” from Leaving Eden. Rambling story short, “Too Late” is probably the lightest fare featured by this group, but it is still enough to cloud one’s mood even though its currently in the high 70s with beautiful blue skies where I am in sunny (and dry) California.

http://antimatteronline.bandcamp.com/track/too-late


The Ragnarok Prophecy

Finally I bring you to lovely America with The Ragnarok Prophecy, whom we have featured before as part of a series on free music; they are a melodeath solo project of musician A.C. Riddle — hailing from Corona, California. Earlier this year he released a fifteen-song disc entitled The Dark Realms, which sees The Ragnarok Prophecy working hard to improve its production style and streamline its sound from previous releases like The Path Of Passage and the EP Valley Of The Forgotten.

It changes things a bit for the project, as it loses the lo-fi sound that may have attracted earlier melodeath listeners who will long for the halcyon days of its sound, but the change also makes it possible to understand everything happening within the music. The album consists of a lot of call-and-response guitar riffing and keeps things pretty mid-tempo while Riddle goes through multiple descriptions of battles, war, and things being destroyed.

As you now know, despite earlier predictions, Ragnarok never happened, but the Prophecy aspect of it is still putting out some pretty good music, and fifteen songs is A LOT of material to travel through. There are a plethora of ideas in play on The Dark Realms, though, that could be fantastic if they are expounded upon in the future and could take The Ragnarok Prophecy to a variety of places in terms of future sound, all of which could be pretty exciting for their unpredictability.

The Dark Realms is available at name-your-own price on Bandcamp and has been out since early February.

http://theragnarokprophecy.bandcamp.com/album/the-dark-realms

21 Mar 23:02

Art of the day: do a little dance!


Art of the day: do a little dance!

21 Mar 23:02

Detail from page 327 of Family Man. (Now without Instagram...


Detail from page 327 of Family Man. (Now without Instagram filtration!)

21 Mar 07:44

Cowl of Remorse

Tertiarymatt

#batshare

no one gets out of coffee alive.
20 Mar 07:46

Data Science Workshops in Seattle

by Greg Wilson
Tertiarymatt

For non-coding Seattle peeps...

if I know any.

Via Sumana Harihareswara: the Community Data Science Workshops are a series of project-based workshops being held at the University of Washington for anyone interested in learning how to use programming and data science tools to ask and answer questions about online communities like Wikipedia, Twitter, free and open source software, and civic media.

The workshops are for people with no previous programming experience. The goal is to bring together both researchers and academics as well as participants and leaders in online communities. The workshops will all be free of charge. Participants from outside UW are encouraged to apply.

There will be three workshops held from 9am-4pm on three Saturdays in April and May. Each session will involve a period for lecture and technical demonstrations in the morning. This will be followed by a lunch graciously provided by the eSciences Institute at UW. The rest of the day will be followed by group work on programming and data science projects supported by more experienced mentors.

For more information, see the full announcement.

Originally posted 2014-03-18 by Greg Wilson in Community, Noticed, Announcements.

19 Mar 21:39

Empirical Software Engineering Papers

by Greg Wilson
Tertiarymatt

linkdump

When I teach scientists programming, I frequently cite empirical studies in software engineering to back up my claims about various tools and practices making people more productive. No good, short survey of those papers exists—writing one has been on my to-do list for several years—but I hope the pointers below will be a useful substitute.

The best short introduction to empirical software engineering is Robert Glass's book Facts and Fallacies of Software Engineering, but it's twelve years old now, and the field has exploded since it was published. Steve McConnell's Code Complete: A Practical Handbook of Software Construction is slightly more up to date, and the anthology Making Software: What Really Works, and Why We Believe It is more recent still, but they are both too long and too dense for most people.

If all you want is a sense of what's out there, It Will Never Work in Theory is an infrequently-updated blog of interesting new results. Some of my favorite entries are:

I'd welcome pointers to other openly-access papers reporting empirical studies that are relevant to what we teach. (Unfortunately, and ironically, the ACM and IEEE are among the most backward of professional societies when it comes to open access publishing. As a result, a lot of really interesting work in this field currently languishes in unfindable obscurity behind their paywalls.)

Originally posted 2014-03-19 by Greg Wilson in Research, Teaching.

19 Mar 04:02

Big Brother Sweden

by Scandinavia and the World
Tertiarymatt

I like Finland.

Big Brother Sweden

Big Brother Sweden

View Comic!


19 Mar 00:44

Species occurrence data

The rOpenSci projects aims to provide programmatic access to scientific data repositories on the web. A vast majority of the packages in our current suite retrieve some form of biodiversity or taxonomic data. Since several of these datasets have been georeferenced, it provides numerous opportunities for visualizing species distributions, building species distribution maps, and for using it analyses such as species distribution models. In an effort to streamline access to these data, we have developed a package called Spocc, which provides a unified API to all the biodiversity sources that we provide. The obvious advantage is that a user can interact with a common API and not worry about the nuances in syntax that differ between packages. As more data sources come online, users can access even more data without significant changes to their code. However, it is important to note that spocc will never replicate the full functionality that exists within specific packages. Therefore users with a strong interest in one of the specific data sources listed below would benefit from familiarising themselves with the inner working of the appropriate packages.

Data Sources

spocc currently interfaces with five major biodiversity repositories. Many of these packages have been part of the rOpenSci suite:

  1. Global Biodiversity Information Facility (rgbif)
    GBIF is a government funded open data repository with several partner organizations with the express goal of providing access to data on Earth's biodiversity. The data are made available by a network of member nodes, coordinating information from various participant organizations and government agencies.

  2. Berkeley Ecoengine (ecoengine)
    The ecoengine is an open API built by the Berkeley Initiative for Global Change Biology. The repository provides access to over 3 million specimens from various Berkeley natural history museums. These data span more than a century and provide access to georeferenced specimens, species checklists, photographs, vegetation surveys and resurveys and a variety of measurements from environmental sensors located at reserves across University of California's natural reserve system. (related blog post)

  3. iNaturalist (rinat) iNaturalist provides access to crowd sourced citizen science data on species observations.

  4. VertNet (rvertnet) Similar to rgbif, ecoengine, and rbison (see below), VertNet provides access to more than 80 million vertebrate records spanning a large number of institutions and museums primarly covering four major disciplines (mammology, herpetology, ornithology, and icthyology). Note that we don't currenlty support VertNet data in this package, but we should soon

  5. Biodiversity Information Serving Our Nation (rbison)
    Built by the US Geological Survey's core science analytic team, BISON is a portal that provides access to species occurrence data from several participating institutions.

  6. eBird (rebird)
    ebird is a database developed and maintained by the Cornell Lab of Ornithology and the National Audubon Society. It provides real-time access to checklist data, data on bird abundance and distribution, and communtiy reports from birders.

  7. AntWeb (AntWeb)
    AntWeb is the world's largest online database of images, specimen records, and natural history information on ants. It is community driven and open to contribution from anyone with specimen records, natural history comments, or images. (related blog post)

Note: It's important to keep in mind that several data providers interface with many of the above mentioned repositories. This means that occurence data obtained from BISON may be duplicates of data that are also available through GBIF. We do not have a way to resolve these duplicates or overlaps at this time but it is an issue we are hoping to address in future versions of the package.

Installing the package

install.packages("spocc")
# or install the most recent version
devtools::install_github("ropensci/spocc")
library(spocc)

Searching species occurrence data

The main workhorse function of the package is called occ. The function allows you to search for occurrence records on a single species or list of species and from particular sources of interest or several. The main input is a query with sources specified under the argument from. So to look at a really simply query:

results <- occ(query = 'Accipiter striatus', from = 'gbif')
results
#> Summary of results - occurrences found for:
#>  gbif  : 25 records across 1 species
#>  bison :  0 records across 1 species
#>  inat  :  0 records across 1 species
#>  ebird :  0 records across 1 species
#>  ecoengine :  0 records across 1 species
#>  antweb :  0 records across 1 species

This returns the results as an S3 class with a slot for each data source. Since we only requested data from gbif, the remaining slots are empty. To view the data:

results$gbif
#> $meta
#> $meta$source
#> [1] "gbif"
#>
#> $meta$time
#> [1] "2014-03-16 17:39:31.716 PDT"
#>
#> $meta$query
#> [1] "Accipiter striatus"
#>
#> $meta$type
#> [1] "sci"
#>
#> $meta$opts
#> list()
#>
#>
#> $data
#> $data$Accipiter_striatus
#>                  name       key longitude latitude prov
#> 1  Accipiter striatus 891040018    -97.65   30.158 gbif
#> 2  Accipiter striatus 891040169   -122.44   37.490 gbif
#> 3  Accipiter striatus 891035119    -71.73   18.270 gbif
#> 4  Accipiter striatus 891035349    -72.53   43.132 gbif
#> 5  Accipiter striatus 891038901    -97.20   32.860 gbif
#> 6  Accipiter striatus 891048899    -73.07   43.632 gbif
#> 7  Accipiter striatus 891049443    -99.10   26.491 gbif
#> 8  Accipiter striatus 891050439    -97.88   26.102 gbif
#> 9  Accipiter striatus 891043765    -76.64   41.856 gbif
#> 10 Accipiter striatus 891056214   -117.15   32.704 gbif
#> 11 Accipiter striatus 891054792    -73.24   44.315 gbif
#> 12 Accipiter striatus 768992325    -76.10    4.724 gbif
#> 13 Accipiter striatus 859267562   -108.34   36.732 gbif
#> 14 Accipiter striatus 859267548   -108.34   36.732 gbif
#> 15 Accipiter striatus 859267717   -108.34   36.732 gbif
#> 16 Accipiter striatus 891043784    -73.05   43.605 gbif
#> 17 Accipiter striatus 891118711   -122.18   37.786 gbif
#> 18 Accipiter striatus 891116600    -97.32   32.821 gbif
#> 19 Accipiter striatus 891124493   -117.11   32.632 gbif
#> 20 Accipiter striatus 891125442   -122.88   38.612 gbif
#> 21 Accipiter striatus 891127900   -122.36   37.778 gbif
#> 22 Accipiter striatus 891128609    -97.98   32.761 gbif
#> 23 Accipiter striatus 891121966    -76.55   38.672 gbif
#> 24 Accipiter striatus 868487120    -83.83   42.333 gbif
#> 25 Accipiter striatus 891131416    -72.59   43.853 gbif

If you prefer data from more than one source, simply pass a vector of source names for the from argument. Example:

occ(query = 'Accipiter striatus', from = c('ecoengine', 'gbif'))
#> Summary of results - occurrences found for:
#>  gbif  : 25 records across 1 species
#>  bison :  0 records across 1 species
#>  inat  :  0 records across 1 species
#>  ebird :  0 records across 1 species
#>  ecoengine :  25 records across 1 species
#>  antweb :  0 records across 1 species

We can also search for multiple species across multiple engines.

species_list <- c("Accipiter gentilis", "Accipiter poliogaster", "Accipiter badius")
res_set <- occ(species_list, from = c('gbif', 'ecoengine'))

Similarly, we can search for data on the Sharp-shinned Hawk from other data sources too.

occ(query = 'Accipiter striatus', from = 'ecoengine')
# or look for data on other species
occ(query = 'Danaus plexippus', from = 'inat')
occ(query = 'Bison bison', from = 'bison')
occ(query = "acanthognathus brevicornis", from = "antweb")

occ is also extremely flexible and can take package specific arguments for any source you might be querying. You can pass these as a list under pacakge_name_opts (e.g. antweb_opts, ecoengine_opts). See the help file for ?occ for more information.

Visualizing biodiversity data

We provide several methods to visualize the resulting data. Current options include Leaflet.js, ggmap, a Mapbox implementation in a GitHub gist, or a static map.

Mapping with Leaflet

spp <- c("Danaus plexippus", "Accipiter striatus", "Pinus contorta")
dat <- occ(query = spp, from = "gbif", gbifopts = list(georeferenced = TRUE))
# occ2df, as the name suggests converts data contained inside an occ class to a R data.frame
data <- occ2df(dat)
mapleaflet(data = data, dest = ".")

Render a geojson file automatically as a GitHub gist

To have a map automatically posted as a gist, you'll need to set up your GitHub credentials ahead of time. You can either pass these as variables github.username and github.password, or store them in your options (taking regular precautions as you would with passwords of course). If you don't have these stored, you'll be prompted to enter them before posting.

spp <- c("Danaus plexippus", "Accipiter striatus", "Pinus contorta")
dat <- occ(query = spp, from = "gbif", gbifopts = list(georeferenced = TRUE))
dat <- fixnames(dat)
dat <- occ2df(dat)
mapgist(data = dat, color = c("#976AAE", "#6B944D", "#BD5945"))

Static maps

If interactive maps aren't your cup of tea, or you prefer to have one that you can embed in a paper, try one of our static map options. You can go with the more elegant ggmap option or stick with something from base graphics.

ecoengine_data <- occ(query = "Lynx rufus californicus", from = "ecoengine")
mapggplot(ecoengine_data)

spnames <- c("Accipiter striatus", "Setophaga caerulescens", "Spinus tristis")
base_data <- occ(query = spnames, from = "gbif", gbifopts = list(georeferenced = TRUE))
plot(base_data, cex = 1, pch = 10)

What's next?

  • As soon as we have an updated rvertnet package, we'll add the ability to query VertNet data from spocc.
  • We will add rCharts as an official import once the package is on CRAN (Eta end of March)
  • We're helping on a new package rMaps to make interactive maps using various Javascript mapping libraries, which will give access to a variety of awesome interactive maps. We will integrate rMaps once it's on CRAN.
  • We'll add a function to make interactive maps using RStudio's Shiny in a future version.

As always, issues or pull requests are welcome directly on the repo.

19 Mar 00:26

More ancient history! A little warmup doodle I did quite a few...

Tertiarymatt

King David the Knob. Ha


More ancient history! A little warmup doodle I did quite a few years ago of a few of the women of the Old Testament. I keep running into it on my hard drive and saying “aw.”

On my long-term wishlist is getting to do a book’s worth of scrabbly sideways comics versions of a bunch of these stories.

Poor Bathsheba. King David was such a knob.

19 Mar 00:26

Art of the day: deco doggie


Art of the day: deco doggie

18 Mar 21:36

You Are Not a Product: Why Premium Pricing is Here

Tertiarymatt

Some assertiveness here. Interesting.

It made us angry to see great products like Google Reader shut down for no good reason. It was frightening when we heard The Old Reader might have to close its doors.

It’s easy to shrug your shoulders and just hope that there will always be great free software for content delivery. And if you do eventually have to join some closed social network, it can’t be that terrible, right? It might be controlled by a giant Internet company, but hey, it’ll be free, right?

Why Freemium is the Thing

Since we introduced Premium pricing for The Old Reader, we’ve gotten some thoughtful comments, as well as some pushback. Why should I pay for a technology that’s always been free? Isn’t the whole point of RSS that it’s part of the free Internet? I want to explain why we’re here and why we’ve adopted the Premium pricing plan ($2/month for 500 subscriptions with full-text search).

RSS has been neglected and abused, but as I’ve said before, I believe it will be the preferred content-delivery format once people tire of private/closed networks. Twitter, Facebook and the rest aren’t delivering content- they’re delivering you to advertisers. RSS doesn’t fit that model. That’s why the big players aren’t supporting it. 

Get Your Sponsored Content Somewhere Else

One of the most common questions we get is why didn’t we just bring in advertising. We settled on the freemium model because its the one that supports the service the best while doing the least harm. The more I use Facebook, Twitter, and other platforms, the more I see the subtle and insidious ways they control what I see, what I do, and what I can say, all in the name of advertising.

We’re trying to provide something the closed Internet doesn’t do- give you unfiltered access to the content you choose. The value in RSS is that it doesn’t try to make money by observing your online habits and feeding you sponsored content. But there are costs to making that possible.

We can learn more about you by building closed systems and tracking and targeting your every move and serving up ad content. But as we’ve said, ads introduce bias and distract from the primary purpose of RSS readers. RSS should aggregate the content you choose from the web, not push advertising to you.  

Besides, ads won’t work. Most of you won’t look at the ads. You will do what I do- block them with Adblock or some other tool or just flat out ignore them. Advertisements that don’t get attention don’t pay any bills. Then we’re forced to find ways to make those ads effective, or lose advertisers. That means putting our resources into forcing you to watch more ads, click on more ads, or some other gambit that has nothing to do with getting the content you want.

Finally, an RSS reader knows a lot about people’s interests, but we don’t want to exploit that fact. We should be using that information to find more stuff you like, not selling it to advertisers. We believe in privacy and do our best to protect it. To maximize ad revenues we’d need to violate your privacy to some degree.

It’s Not a Free Ride

But why should Premium users have to pay the bill for the free users? It’s important to remember that this is a social network, and the more friends you have to share with, the better. Not all your friends will be Premium/power RSS users. But the more people using the service, the more great content you can find. (And not sponsored content from advertisers.)

In addition, we hope that over time we are able to attract more and more of our free users to Premium accounts. We know it’ll be a small percentage but we’re working hard to build incredible functionality worthy of a small monthly fee. Besides, I know you’ve heard the “it’s less than cup of coffee” line a thousand times, but we REALLY think it’s a reasonable amount for the power you have. If you’re a power user, know that the money we make from your subscription will be plowed into development. Real, honest-to-goodness development.

I know that there are still free RSS readers available. The Old Reader was completely free until a couple weeks ago. And for the VAST majority of our users it still can be completely free. The freemium model is important because we’re focused on making this a sustainable service that won’t be closing.

In The Words of a Wise Man…

Our goal isn’t just to keep The Old Reader chugging along, but to build an online platform and community that is an alternative to the Facebooks and Twitters of the world. I think Dave Winer said it best when he wrote in our blog comments:

We have as a community, been boring the hell out of users.

This what happens when a product doesn’t introduce any new features for 10 years! :-)

I’m talking about RSS, as a product — vs its competitors, Twitter and Facebook, which have been actively pushing new goodies for users.

We are not doing that in RSS.

So if we want to get users on board, and other developers, we have to move.

Everyone’s been doing it for themselves, and no one has been willing to go first with a new feature that might delight users, and inspire their competitors to follow them.

If we want to have a good open alternative to Twitter and Facebook, we have to do some new stuff!

We’re committed to the open web and giving you the best possible reading experience without sneaking in ads. And we’re also not going to be using your private information to sell you anything or help others sell you anything. That’s not just a promise. That’s the principle behind Premium membership. 

18 Mar 16:02

Weed: A Gateway Drug Across Generations?

by Virginia Hughes
Tertiarymatt

Studies exposing rats to THC alone aren't much of anything like how people are exposed to marijuana in reality. THC by itself is definitely implicated as being not that great for you, but in "balanced" strains of marijuana it's counterbalanced by other compounds.

If you haven’t seen marijuana in the news lately then you haven’t been paying attention. This week lawmakers in Maryland, Maine, Massachusetts, Colorado, WashingtonKentucky, and Georgia are all talking about weed. Some doctors are using the drug to treat epilepsymultiple sclerosis, and chronic pain. Journalists are finding stories of marijuana lobbyists and marijuana job fairs and multi-day cannabis tours.

Most of these news stories mention that little is known about the long-term effects of marijuana use. But I bet the average Joe is much more likely to make jokes about weed than fret about its potential harms. I was in the joking camp last week. My perspective is beginning to shift, however, thanks to a new rat study suggesting that steady marijuana exposure causes brain and behavioral problems not only in the animals exposed, but in their future ratlets.

“When I was in school you were taught that the only thing you pass on to your kids is your DNA sequence. Now we know that what you do in your lifetime impacts the next generation more than we thought,” says lead investigator Yasmin Hurd, a neuroscientist at the Mount Sinai School of Medicine in New York. “It’s important for people to think about that as we have these public discussions about marijuana.”

Marijuana is the most commonly used illicit drug in the United States, and seems to be getting more popular by the day. An estimated 18.9 million people have used it sometime in the past month, according to a 2012 survey done by the U.S. Department of Health and Human Services. That’s up from 14.5 million in 2007. As more people use it, more people seem to think it’s safe. That same survey showed that, in 2007, 55 percent of kids between 12 and 17 perceived “great risk” in smoking pot. In 2012, only 44 percent did.

But just how risky is it? Scientists are only beginning to figure that out.

Several years ago, Hurd and her colleagues showed that adolescent rats exposed to THC (the molecule primarily responsible for pot’s mind-altering effects) are more likely to self-administer heroin as adults than are rats not exposed to THC. This pointed to weed as a “gateway” into other kinds of addictive drugs.

The new study aimed to see whether any of these effects carried into the next generation. Over the past decade or so, many researchers have reported that a wide variety of environmental exposures leave chemical marks on DNA that stick around in the germ line, sometimes for several generations. (I just wrote a feature for Nature about this avenue of research.) To give one well-known example, a 2002 study of Swedish historical records found that men who had experienced famine in childhood were less likely to have grandsons with heart disease or diabetes than those who were well fed.

Just as they did in previous studies, Hurd’s team gave male and female rats periodic injections of THC throughout their adolescent period. This pattern of exposure is meant to mimic the typical pot-smoking teen. “Every few days they got about a joint’s worth of THC,” Hurd says.

Several weeks after the exposure ends (enough time for all traces of THC to disappear), the researchers allowed the animals to mate. Immediately after delivery, their pups were transferred to another cage to be raised by a female rat who had never been exposed to THC.

When those babies reached adulthood, even though they themselves had never been exposed to THC, their brains showed a range of molecular abnormalities. They had unusually low expression of the receptors for glutamate and dopamine, two important chemical messengers, in the striatum, a brain region involved in compulsive behaviors and the reward system. What’s more, brain cells in this region had abnormal firing patterns, the study found.

“I really didn’t expect such significant differences,” Hurd says. “The fact that you see significant changes, molecular changes, in how the neurons communicate with each other — that’s very significant to me.”

This second generation had altered behaviors as well. Compared with controls, rats whose parents had been exposed to THC were more sensitive to novelty in their environment and were more likely to self-administer heroin by repeatedly pressing a lever. All of this would suggest, as the authors wrote in the paper, that marijuana has a “cross-generational gateway” effect.

“It’s always important to recognize that animal models are just that, and not always perfect predictors of human behavior. That said, these data are striking,” says Chris Pierce, a neuroscientist at the University of Pennsylvania, who was not involved in the new study. Last year Pierce’s team reported a similar kind of epigenetic inheritance: Male offspring of rats that had been exposed to cocaine showed increased resistance to cocaine addiction compared with controls.

As is true of so many epigenetic studies, the researchers don’t know much about the biological mechanism that might allow THC exposure to carry over to the next generation. Pierce points out that because both the mother and father were exposed to THC, it’s unclear whether one or both parents must be exposed in order for the offspring to be affected.

Hurd’s team is now analyzing the sperm of the exposed males to see whether it carries abnormal patterns of DNA methylation, a common epigenetic marker. The researchers also also investigating whether some of these effects extend to a third generation.

Epigenetic influences may seem scary — it’s awful to think that dumb choices I made in college might one day mess up my kid’s brain. But Hurd puts a more optimistic spin on it. Just as drug exposures can leave harmful marks on the genome, our other experiences or behaviors may be able to undo the damage, or have other positive effects. “Some things could counter it, and others could exacerbate it,” she says. “We don’t appreciate this plasticity enough.”

This kind of scientific research, in Hurd’s views, too often gets left out of the public debate over the legalization of marijuana. “If anyone brings any science into the discussion you’re seen as this negative group trying to stop the freedom of individuals, and that’s not the case,” she says. “I think we need to have the debate, with science being a huge part of that.”

17 Mar 21:52

Collaborative Lesson Development - Why Not?

by Justin Kitzes

A few weeks ago, Greg Wilson asked me:

Why is there so little open, collaborative development of lesson plans and curricula? Is there something that makes teaching different from coding (e.g., open source software) and from writing (e.g., Wikipedia)?

A dozen emails later, I can't claim that we're much closer to a definitive answer, but we have come up with a working hypothesis. We'd be very interested in feedback.

Three key ingredients appear to be required for collaborative development of any sort of material:

  1. a host who provides the infrastructure for the project,
  2. lead developers and maintainers who integrate and manage contributions, and
  3. contributors who create the actual materials themselves.

For example, the continued development of IPython requires GitHub, the core development team (especially Fernando Pérez and Brian Granger), and scientists/coders who understand pull requests. The growth of Wikipedia required the Wikimedia Foundation, the core admins, and interested readers who understand how to use a browser-based Wiki editor.

The non-existence of open, collaborative lessons could be caused by any of these three factors being absent. Greg believes that the biggest limitation is #2: while lots of people in education can write and edit lesson plans, they appear not to have taken on the broader role of managing the development of collaborative materials. However, the existence of edited books suggests that this shouldn't seem like a strange activity.

My vote is that the biggest limitation is #3: potential contributors need a certain level of familiarity and comfort with the tools that enable contributions (such as version control or a browser-based Wiki editor). I suspect that these skills may be lacking among educators, whereas they're not lacking to the same extent among coders or even among Wikipedia readers.

An interesting exception is the lesson materials Software Carpentry is developing. Software Carpentry arguably works because of GitHub, Greg and other topic editors, and instructors who understand pull requests. The first and third of these are possible largely because the contributors to the Software Carpentry lessons are, by design, also scientists and coders.

Importantly, the intervention required to promote collaborative lesson development will depend on where the bottleneck lies:

  1. If the shortcoming is in hosting and infrastructure, somebody needs to fund, maintain, and (most importantly) advertise a central website for open curriculum development. Curriki appears to be having a go at this (although Greg notes that many similar efforts have failed in the past). An important design consideration should be to make the skill level required for contribution as low as possible (think Wiki editor rather than fork/pull).
  2. If the shortcoming is in developers/maintainers, a set of current leaders in education need to volunteer or be offered incentives to play a lead role in developing and managing a set of materials for their areas of expertise. This role could and should be recognized as equivalent to being the editor of a published book.
  3. If the shortcoming is in the contributors, training in collaborative web tools should be provided to educators who express interest in the ideas of open lesson development. While incentives could also be useful here, contributors to open source software and Wikipedia generally receive no direct compensation for their work.

Or maybe all of this is a work in progress and we just need to wait for the next generation of tech-savvy educators (and students).

So, that's about as far as we've gotten. What do you think?

Originally posted 2014-03-14 by Justin Kitzes in Teaching, Education.

17 Mar 16:20

❋ budgie theme park ❋ BERD


budgie theme park

BERD

17 Mar 08:42

Not exactly good news:

Tertiarymatt

What the title says.

http://www.theguardian.com/environment/earth-insight/2014/mar/14/nasa-civilisation-irreversible-collapse-study-scientists

A new study sponsored by Nasa’s Goddard Space Flight Center has highlighted the prospect that global industrial civilisation could collapse in coming decades due to unsustainable resource exploitation and increasingly unequal wealth distribution.

Noting that warnings of ‘collapse’ are often seen to be fringe or controversial, the study attempts to make sense of compelling historical data showing that “the process of rise-and-collapse is actually a recurrent cycle found throughout history.” Cases of severe civilisational disruption due to “precipitous collapse - often lasting centuries - have been quite common.”

The research project is based on a new cross-disciplinary ‘Human And Nature DYnamical’ (HANDY) model, led by applied mathematician Safa Motesharri of the US National Science Foundation-supported National Socio-Environmental Synthesis Center, in association with a team of natural and social scientists. The study based on the HANDY model has been accepted for publication in the peer-reviewed Elsevier journal, Ecological Economics.

It finds that according to the historical record even advanced, complex civilisations are susceptible to collapse, raising questions about the sustainability of modern civilisation:

"The fall of the Roman Empire, and the equally (if not more) advanced Han, Mauryan, and Gupta Empires, as well as so many advanced Mesopotamian Empires, are all testimony to the fact that advanced, sophisticated, complex, and creative civilizations can be both fragile and impermanent."

By investigating the human-nature dynamics of these past cases of collapse, the project identifies the most salient interrelated factors which explain civilisational decline, and which may help determine the risk of collapse today: namely, Population, Climate, Water, Agriculture, andEnergy.

These factors can lead to collapse when they converge to generate two crucial social features: “the stretching of resources due to the strain placed on the ecological carrying capacity”; and “the economic stratification of society into Elites [rich] and Masses (or “Commoners”) [poor]” These social phenomena have played “a central role in the character or in the process of the collapse,” in all such cases over “the last five thousand years.”

Currently, high levels of economic stratification are linked directly to overconsumption of resources, with “Elites” based largely in industrialised countries responsible for both:

"… accumulated surplus is not evenly distributed throughout society, but rather has been controlled by an elite. The mass of the population, while producing the wealth, is only allocated a small portion of it by elites, usually at or just above subsistence levels."

The study challenges those who argue that technology will resolve these challenges by increasing efficiency:

"Technological change can raise the efficiency of resource use, but it also tends to raise both per capita resource consumption and the scale of resource extraction, so that, absent policy effects, the increases in consumption often compensate for the increased efficiency of resource use."

Productivity increases in agriculture and industry over the last two centuries has come from “increased (rather than decreased) resource throughput,” despite dramatic efficiency gains over the same period.

Modelling a range of different scenarios, Motesharri and his colleagues conclude that under conditions “closely reflecting the reality of the world today… we find that collapse is difficult to avoid.” In the first of these scenarios, civilisation:

"…. appears to be on a sustainable path for quite a long time, but even using an optimal depletion rate and starting with a very small number of Elites, the Elites eventually consume too much, resulting in a famine among Commoners that eventually causes the collapse of society. It is important to note that this Type-L collapse is due to an inequality-induced famine that causes a loss of workers, rather than a collapse of Nature."

Another scenario focuses on the role of continued resource exploitation, finding that “with a larger depletion rate, the decline of the Commoners occurs faster, while the Elites are still thriving, but eventually the Commoners collapse completely, followed by the Elites.”

In both scenarios, Elite wealth monopolies mean that they are buffered from the most “detrimental effects of the environmental collapse until much later than the Commoners”, allowing them to “continue ‘business as usual’ despite the impending catastrophe.” The same mechanism, they argue, could explain how “historical collapses were allowed to occur by elites who appear to be oblivious to the catastrophic trajectory (most clearly apparent in the Roman and Mayan cases).”

Applying this lesson to our contemporary predicament, the study warns that:

"While some members of society might raise the alarm that the system is moving towards an impending collapse and therefore advocate structural changes to society in order to avoid it, Elites and their supporters, who opposed making these changes, could point to the long sustainable trajectory ‘so far’ in support of doing nothing."

However, the scientists point out that the worst-case scenarios are by no means inevitable, and suggest that appropriate policy and structural changes could avoid collapse, if not pave the way toward a more stable civilisation.

The two key solutions are to reduce economic inequality so as to ensure fairer distribution of resources, and to dramatically reduce resource consumption by relying on less intensive renewable resources and reducing population growth:

"Collapse can be avoided and population can reach equilibrium if the per capita rate of depletion of nature is reduced to a sustainable level, and if resources are distributed in a reasonably equitable fashion."

The NASA-funded HANDY model offers a highly credible wake-up call to governments, corporations and business - and consumers - to recognise that ‘business as usual’ cannot be sustained, and that policy and structural changes are required immediately.

Although the study is largely theoretical, a number of other more empirically-focused studies - by KPMG and the UK Government Office of Science for instance - have warned that the convergence of food, water and energy crises could create a ‘perfect storm’ within about fifteen years. But these ‘business as usual’ forecasts could be very conservative.

Link to the paper: http://www.atmos.umd.edu/~ekalnay/pubs/handy-paper-for-submission-2.pdf

17 Mar 08:40

On Cosmos

by Ian

On Cosmos

15 Mar 03:46

benito-cereno: benito-cereno: Mythursday: Be Aware of the Ides...

Tertiarymatt

GROIN STABBIN' AND CALENDARS


benito-cereno:

benito-cereno:

Mythursday: Be Aware of the Ides of March

Okay, so:

I know I said I was going to twice weekly updates to cover the story of Theseus, but I was away from home all day Tuesday this week, and I suddenly find myself short on time today, and worse, I find myself forced to make the decision to do something topical rather than the obviously timeless story of Theseus.

Today is March 15, which, as many of you may know, is the Ides of March, the day on which Gaius Julius Caesar was assassinated in 44 BCE. But what ARE the Ides of March? This is what I thought I would answer today. Admittedly, this is not a mythology topic, but Romanhistoryandcultursday isn’t quite as snappy.

Here is what you need to know:

Romans didn’t think of dates the same way we do. They would never say, “Oh, we’ll go down to Brundisium on April 7th. Can’t wait!” Every date was named based on its relation to a particular landmark day in the month. The three landmarks were the Kalends, the Nones, and the Ides.

How were these days determined? Most likely by the lunar cycle. No one can say for sure, but it is incredibly likely that the original Roman calendar was lunar in nature. The Kalends, then, as the first day of every month, were the day of the new moon. (The name Kalends most likely derives from the Greek “kaleo,” meaning to announce, as in “to announce the new moon.” It is, as you may have guessed, the source of our word calendar.)

And so the Nones are the day of the half moon and the Ides the day of the full moon (Macrobius states that the name Ides comes from an Estruscan word meaning to divide, as in to divide the month in half, but more likely it is related to a Sanskrit word meaning to shine, as the full moon). Originally the dates of these days would vary, being determined by someone who is looking super closely at the moon, but eventually they were regulated so that the Nones fell on the fifth of each month (except for March, May, July and October, when they fell on the seventh) and the Ides fell on the thirteenth of each month (except for March, May, July and October, when they fell on the fifteenth).

Why do they change? It has to do with the lunar cycle and how it doesn’t complete itself in full days. Moving the Ides had more or less the same purpose as leap years, except for the moon, rather than the sun. When the Ides move, the Nones move, because the Nones (from the word for “ninth”) are the ninth day before the Ides.

“But wait!” I hear you cry. “I don’t know much about math learnin’, but I know thirteen minus five is eight, not nine!” Yes, well, here is the next trick: Roman counting was inclusive, meaning if you’re counting backwards from today, you include today. So Tuesday would be considered the third day before Thursday, not two days before as we would count it today.

With me so far?

The other thing you have to understand is that Roman dates always looked forward, never backwards, as they were always looking forward to the next phase of the moon (presumably). So you would never say, “Meet me the day after the Ides,” but rather, “Meet me the Nth day before the Kalends.”

So while today is the Ides of March, tomorrow wouldn’t be reckoned the day after the Ides, it instead would be called ante diem XVII Kalendas Apriles, or the seventeenth day before the Kalends of April. (It would not, in fact, be called this, as in the Roman calendar, March did not have thirty-one days, but don’t worry about that part.)

Surprising no one, it is actually a little more complicated than this once you account for intercalary months, but that is something you can look up on your own if you are interested. Needless to say, there is a reason there have been a couple of major calendar reforms since the original Roman calendar.

(One of these major reforms was made by Julius Caesar himself: it’s called the Julian calendar. Since he began it and his heir Augustus finished instituting it, the months of July and August were renamed after those dudes.)

(Also! Ironically, due to the reforms of Julius Caesar himself, we are commemorating his death on the wrong day. While the Ides of March by pre-Julian reckoning would in fact have been March 15, the day on which Caesar was actually assassinated would be March 14 by our current method. THINGS THAT MAKE YOU GO HMMM.)

It is worth noting that the Ides were the days on which teachers were paid each month. Just, you know, just pointing that out.

Also, it’s a good day for stabbing your friend in the groin until he dies, but only if he has just been named dictator-for-life and your other friends really egg you on about it, playing on your sense of honor and the fact that you are the descendant of your culture’s most famous tyrannicide. ONLY IF YOU MEET ALL THOSE CONDITIONS.

Otherwise, don’t stab any groins.

In anticipation of tomorrow, a post outlining the proper celebration of Groin Stabbing Day

15 Mar 03:41

Mailpile: Crowdfunding to Alpha (by Brennan Novak) New from the...


Mailpile: Crowdfunding to Alpha (by Brennan Novak)

New from the MailPile folks.

14 Mar 22:31

I found this little pattern in my archives today! (I think it...


I found this little pattern in my archives today! (I think it was originally a submission for a sock design contest? WHO KNOWS.)

At any rate, I hope you enjoy these fancy little ladies, who don’t seem annoyed at all for having been lost at sea all these months.

14 Mar 21:56

In the Previous Episodes of the Tale of Social Priming and Reproducibility

by Åse Innes-Ker
Tertiarymatt

Priming is an interesting bit of psychology.

We have lined up a nice set of posts responding to the recent special section in PoPS on social priming and replication/reproducibility, which we will publish in the coming weeks. It has proven easier to find critics of social priming than to find defenders of the phenomenon, and if there are primers out there who want to chime in they are most welcome and may contact us at oscblog@googlegroups.com.

The special section in PoPS was immediately prompted by this wonderful November 2012 issue from PoPS on replicability in psychology (open access!), but the Problems with Priming started prior to this. For those of you who didn’t seat yourself in front of the screen with a tub of well-buttered pop-corn every time behavioral priming made it outside the trade journals, I’ll provide some back-story, and links to posts and articles that frames the current response.

The mitochondrial Eve of behavioral priming is Bargh’s Elderly Prime1. The unsuspecting participants were given scrambled sentences, and were asked to create proper sentences out of four of the five words in each. Some of the sentences included words like Bingo or Flordia – words that may have made you think of the elderly, if you were a student in New York in the mid nineties. Then, they measured the speed with which the participant walked down the corridor to return their work, and, surprising to many, those that unscrambled sentences that included “Bingo” and “Florida” walked slower than those that did not. Conclusion: the construct of “elderly” had been primed, causing participants to adjust their behavior (slower walk) accordingly. You can check out sample sentences in this Marginal Revolution post – yes, priming made it to this high-traffic economy blog.

This paper has been cited 2571 times, so far (according to Google Scholar). It even appears in Kahneman’s Thinking, Fast and Slow, and has been high on the wish-list for replication on Pashler’s PsychFile Drawer. (No longer in the top 20, though).

Finally, in January 2012, Doyen, Klein, Pichon & Cleeremans (a Belgian group) published a replication attempt in PLOSone where they suggest the effect was due to demand. Ed Yong did this nice write-up of the research.

Bargh was not amused, and wrote a scathing rebuttal on his blog in the Psychology Today domain. He took it down after some time (for good reason – I think it can be found, but I won’t look for it.). Ed commented on this too.

A number of good posts from blogging psychological scientists also commented on the story. A sampling are Sanjay Srivastava on his blog Hardest Science, Chris Chambers on NeuroChambers, and Cedar Riener on his Cedarsdigest.

The British Psychological Society published a notice about it in The Psychologist which links to additional commentary. In May, Ed Yong had an article in Nature discussing the status of non-replication in psychology in general, but where he also brings up the Doyen/Bargh controversy. On January 13, the Chronicle published a summary of what had happened.

But, prior to that, Daniel Kahneman made a call for psychologists to clean up their act as far as behavioral priming goes. Ed Yong (again) published two pieces about it. One in Nature and one on his blog.

The controversies surrounding priming continued in the spring of 2013. This time it was David Shanks who, as a hobby (from his video - scroll down below the fold) had taken to attempting to replicate priming of intelligence, work originally done by Dijksterhuis and van Knippenberg in 1998. He had his students perform a series of replications, all of which showed no effect, and was then collected in this PLOSone paper.

Dijksterhuis retorted in the comment section2. Rolf Zwaan blogged about it. Then, Nature posted a breathless article suggesting that this was a fresh blow for us who are Social Psychologists.

Now, most of us who do science thought instead that this was science working just like it ought to be working, and blogged up a storm about it – with some of the posts (including one of mine) linked in Ed Yong’s “Missing links” feature. The links are all in the fourth paragraph, above the scroll, and includes additional links to discussions on replicability, and the damage done by a certain Dutch fraudster.

So here you are, ready for the next set of installments.

1 Ancestral to this is Srull & Wyer’s (1979) story of Donald, who is either hostile or kind, depending on which set of sentences the participant unscrambled in that earlier experiment that had nothing to do with judging Donald.

2 A nice feature. No waiting years for the retorts to be published in the dead tree variant we all get as PDF’s anyway.

14 Mar 21:49

PLOS Opens Roundup (March 7)

by Catriona MacCallum
Tertiarymatt

" In a somewhat related article on the same day as the Nature story above, Elizabeth Dzeng discusses the state of science evaluation with Nobel prize winner Sydney Brenner. Her interview starts out with a fascinating insight into the emerging field of genetics and molecular biology when individuals at the Laboratory for Molecular Biology at Cambridge, such as Brenner, Fred Sanger and Francis Crick, were seen as extremists – part of some kind of evangelical sect. But Brenner goes on to note that the culture of innovation that facilitated their discoveries no longer exists because it has been replaced by a new culture in [US] science that relies on ‘the slavery of graduate students’ and the ‘post-doc as an indentured labourer’. And peer-review is hindering science, he says, and has become ‘completely corrupt’ – “it’s not publish or perish, it’s publish in the okay places [or perish]” – while a system of publishing where the author hands over copyright to publishers perpetuates this. He concludes that the open access movement is beginning to shift the culture back and that even journals like Cell, Nature and Science will have to bow in the end."


In this issue, Obama signals a commitment to open access and the Dutch libraries start cloudsharing, whilst in other news there is a new science magazine published by the Wellcome Trust, a round-up of the posts surrounding the withdrawal of nonsense papers published by Springer and IEEE, a curious case of the London mathematical society,  an interview with Sydney Brenner discussing why the current culture of some labs stifles innovation, a thought experiment of why publishers don’t need embargoes, a brief review of the cost of hybrid publishing, and the odd mention of data sharing policies….[and see the update added on March 09 to the entry 'PLOS's Bold Data policy']

With thanks to Heather Joseph, Alma Swan, Ginny Barbour and Susan Au for links and tip-offs.

POLICY DEVELOPMENTS

US: The President’s 2015 Budget Request – Public Access Language

US Flag 04 March: President Obama released his FY15 Budget request. As you may know, this request essentially represents the President’s policy “wish list” for the year, and signals the official start to the federal budget process. In the budget released on the 3rd, there is a section titled “Creating a 21st Century Government,” which includes a subsection on “Economic Growth: Open Government Assets as a Platform for Innovation and Job Creation.” It includes language discussing the need for greater public access to government-generated assets, including scientific research. The budget explicitly states:

By opening up Government-generated assets including data and the fruits of federally funded research and development (R&D)—such as intellectual property and scientific publications—to the public, Government can empower individuals and businesses to significantly increase the public’s return on investment in terms of innovation, job creation, and economic prosperity.

While it carries no executive or legislative force, the language signals a continued commitment to the issue of ensuring public access to the results of publicly funded research. For full details and context, please see pages 41-42 of the main link. (Thanks to Heather Joseph for providing this update)

Australia: The National Health and Medical Council sign up to DORA and a guide for researchers to the ARC data management plan

Feb 24: Both announcements are noted by Stephen Matchett in different issues of the ‘Campus Morning Mail’ (you need to scroll down).  On the San Francisco Declaration on Research Assessment (DORA), he notes that the Australian Research Council (ARC) have still to sign up to this (and should). He also adds that “hoping the publishers will actually acknowledge a reform not in their interests is probably too much to expect.” But there are several publishers, such as PLOS, the Royal Society and AAAS, as well as individual journals that have signed up to DORA, in addition to the growing number of funders. Lagging behind even some publishers, however, are the signatories of actual institutions. On the data front, the Australian National Data Service has produced a guide for researchers about creating the required data management plan for ARC, which has to include details for how they will store and share their data (sound familiar – see later).

Netherlands: Dutch consortium of university libraries and the National Library of the Netherlands move to cloudshare their metadata with OCLC Worldshare

Netherlands FlagFeb 19: Not strictly a policy move but a significant move by the libraries of an entire country to shift their services services to OCLC WorldShare. “WorldShare provides an open cloud-based approach for sharing metadata, applications and innovation, enabling library consortia to collaborate at a national or regional level as well as connecting globally to raise visibility and awareness of their institutions on the web, and take advantage of the economies of scale that global collaboration brings.” As Eric van Lubeek, Managing Director, OCLC EMEA notes in the press release: “UKB’s move will serve as an example for other libraries and library consortia, not just in the Netherlands, but around the world.”

AND IN OTHER NEWS

Thoughts on journal embargoes

March 05: Ben Johnson provides a thoughtful thought experiment re-imagining scholarly communication and deconstructing the arguments about why publishers think they need to impose embargoes on the final version of the manuscript. He discusses what publishers add that is considered ‘essential’ – i.e. peer-review and ‘brand-recognition’ – and shows that neither has to be supplied by the publisher or subject to embargo because both are available via the accepted version of the article, which can generally be posted to a repository immediately. He goes on to argue that if embargoes were completely lifted, libraries would still continue to subscribe to journals because 1) that’s how articles get cited, 2) readers like all the peripheral content in journals (book reviews etc) , 3) it’s easier to find the article, 4) librarians cancel journals because of price, rather than embargo length, and 5) most librarians won’t cancel anyway as they are tied into big deals.

It’s an interesting analysis and I think he’s right but I think that it also omits one other service. He doesn’t discuss the role of either marking up the html or xml version of the article or ensuring that the article adheres to the appropriate standards of metadata (including metadata that enables you to know what licence is associated with the article). Again, this is not something that publishers need to do but it is currently a service that most established publishers provide because it makes their content more discoverable on the web (until you come up against that paywall). And it is also these jewels of the digital age that subscription publishers are protecting by trying to restrict text mining. They want you to find their version of the article but only to use it under the conditions they stipulate (thus protecting potential revenue stream).

A new way to explore the science of life: Mosaic launches today

Mosaics LogoMarch 04: In another pioneering move, the Wellcome Trust has launched a new #OA magazine about science called ‘Mosaic’, which will feature in-depth stories (including video) across the biosciences but will also include some topics from the humanities (reflecting Wellcome’s roots and focus of funding). A cross between a blog and more formal online magazine, with a wonderfully sleek design, it has a really strong line-up of regular contributors including people like Oliver Burkman (well known to Guardian readers) whose opening feature is an interview with Steven Pinker, as well as Emily Anthes writing on the female condom (no interest there then…) and Michael Regnier exploring Alzheimer’s Disease. Mosaic actively encourages you to not only read the written content for free but also share it and, yes, even republish it –  even commercial re-use is permitted (as long as there is appropriate attribution). Giles Nelson, the editor of Mosaic, provides the rationale for why they opted for a CC BY licence. Such a licence is still rare for this type of ‘ front-section’ content and represents a potential game changer among science writing – (although note it doesn’t apply to all of the content). For example, it is sometimes argued that the front section of journals like Science and Nature could never convert to OA because the work is often commissioned from e.g. science writers and journalists and you therefore have to charge for access because it is not feasible to recoup the cost with e.g. an APC (although this wouldn’t apply to practicing scientists writing in these sections – they generally aren’t paid a commission and often acknowledge funders). Certainly there is a cost that has to be paid for somewhere – but Wellcome have obviously decided that footing the entire bill for the sake of engaging the public with the research they are funding is worth it. Fantastic initiative.

Update (March 07): The SpotOn London conference last fall had a session on Creative Commons journalism and the video is available.

UKSG official journal fully Open Access (without publishing charges) with special issue on OA

Insights coverMarch 04: UKSG, an organisation with a mission to “connect the information community and encourage the exchange of ideas on scholarly communication”, has just flipped its official journal, Insights, to OA. To mark the occasion, they commissioned a special issue on Open Access, featuring articles from speakers at a conference they hosted last year. Among contributions are those focusing on policy (e.g. about Finch by Michael Jubb, and HEFCE from David Sweeny and Ben Johnson), on publishers (e.g. by PLOS ONE’s Damian Pattinson and myself, and by Taylor and Francis on how they’re riding out the transition), on OA in the humanities (by Caroline Edwards, co-founder and co-director of the Open Library of Humanities) as well as OA developments in China by Xiaolin Zhang (Chinese Academy of Sciences).

PLOS’ Bold Data Policy

Image by planeta (CC BY-SA 2.0)

Image by planeta (CC BY-SA 2.0)

March 04: There will be more to come on the PLOS data policy* [see update below] but in the meantime, here is a list to some of the many links and posts that have discussed it. From PLOS, there is an article in PLOS Biology detailing the policy, our FAQ page, and a  post on the EveryONE blog. As well as the numerous tweets, there are reactions from Ian Dworkin, Edmund Hart, Practical Data Management for Bug Counters, DrugMonkey, the MacManes Lab., Erin C. McKiernan, Neuropolarbear, motorcar nine, Small Pond Science and David Crotty over at Scholarly Kitchen (main link). Note that the comments are often as interesting and revealing as the posts and there is a focus on behavioural, neurological and ecological data. Be sure to check out related discussion articles by e.g.  by Joel Hartter et al , Bryan Drew et al and Dominique Roche et al all in PLOS Biology with  associated blog posts from Roli Roberts and Emma Ganley (editors on PLOS Biology). And then read Cameron Neylon’s post ‘Open is a state of mind’.

Update (March 07): Please also see this post by Björn Brembs and another by ecologist Timothée Poisot .

*Update March 09: Theo Bloom (PLOS Editorial Director, Biology) has provided a correction, apology and further clarification about our data sharing policy given “the extraordinary outpouring of discussions on open data and its place in scientific publishing”. As she notes, much of the discussion centered on a misunderstanding in a previous PLOS ONE blog post and also on our site for PLOS ONE Academic Editors: “an attempt to simplify our policy did not represent the policy correctly and we sincerely apologize for that and for the confusion it has caused”. ….”We have struck out the paragraph in the original PLOS ONE blog post headed “What do we mean by data”, as we think it led to much of the confusion.”

As Ivan Oransky reports on Retraction Watch: “The move looks like the right thing to do. The problem seemed to have stemmed from how the policy was communicated, rather than what PLOS actually wanted to accomplish, which is better data sharing. In a time when reproducibility is a growing concern, the latter is a must.

Here’s the salient points of the clarified policy:

“Two key things to summarize about the policy are:

  1. The policy does not aim to say anything new about what data types, forms and amounts should be shared.
  2. The policy does aim to make transparent where the data can be found, and says that it shouldn’t be just on the authors’ own hard drive.”

“We ask you to make available the data underlying the findings in the paper, which would be needed by someone wishing to understand, validate or replicate the work. Our policy has not changed in this regard. What has changed is that we now ask you to say where the data can be found.

As the PLOS data policy applies to all fields in which we publish, we recognize that we’ll need to work closely with authors in some subject areas to ensure adherence to the new policy. Some fields have very well established standards and practices around data, while others are still evolving, and we would like to work with any field that is developing data standards. We are aiming to ensure transparency about data availability.”

She then goes on to demonstrate with an example question and answer. If you have further questions you can post comments to her post, or contact PLOS by email at data@plos.org, and via all the usual channels.

Access and Accessibility for the London Mathematical Society Journals

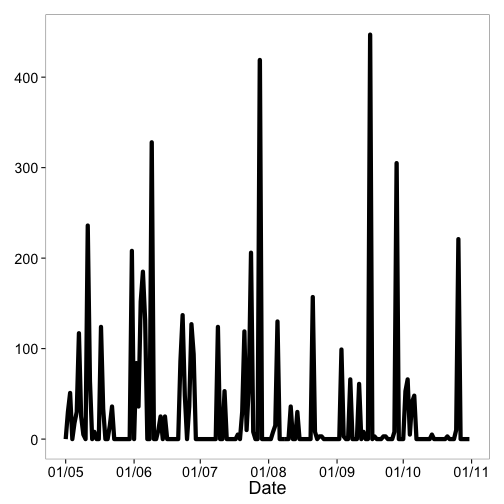
March 03: Fascinating article by Susan Hezlet in the March issue of ‘Notices of the American Mathematical Society’ about whether the presence of a preprint version on the arXiv has an effect on the usage of the final published version and what the LMS is thinking about open access. The key conclusion is that there is essentially no difference between their usage figures for papers in/not in ArXiv but they still fear that their revenues will be undermined by the UK Government’s open access policies – “…it seems the danger does not lie in the ArXiv version…I believe there would be a threat to the subscription base if we were required to deposit the final published version and not just the authors accepted manuscript. I should be clear that no one is asking this…”.  It is also curious to see that even in a mathematics journal they don’t provide confidence limits on their data (e.g. Fig 1).

Opening Science

Some rights reserved by Martin Clavey. Attribution-ShareAlike 2.0 Generic (CC BY-SA 2.0)

Montage Photoshop by Martin Clavey. Attribution-ShareAlike 2.0 Generic (CC BY-SA 2.0)

March 02: A new book on open science released in January under a CC-BY-NC licence  but with the latest version just out (see menu in the top left). Each chapter has a different author and can be downloaded as a separate pdf (with its own DOI). The chapters span a wide range of topics that covers the basics, such as what ‘open science’ means by Benedikt Fecher and Sascha Friesike, and another on why impact factors and publication pressure reduce the quality of scientific publications by economist Mathias Binswanger, as well as a host of chapters on the tools and the vision for the future. It’s a euro-centric compilation that also includes chapters by many you’ll recognise including Pete Binfield, John Willinsky and Martin Fenner, who told me that they hope to keep the work updated and will consider adding chapters in the future as needed. Be sure to note the fact that you can take all the code for this from Github (‘Fork me on Github’ – top right) and remix it as you see fit (although you can’t then sell it). A great resource

Small firms lack resources to make most of open access

Feb 27: In Times Higher, Paul Jump discusses Elsevier’s contention that small firms lack resources to make the most of open access and that just providing access to the literature wasn’t going to lead to the sort of economic innovation that David Willets (the UK Minister for Sciences) thought it would. According to  David Mullen, Elsevier’s regional sales director of corporate markets in Europe, the Middle East and Asia, when Elsevier provided access to their journals to a dozen small firms in the Netherlands, it had little impact. This directly contradicts a study of small and medium enterprise firms in Denmark however, by John Houghton, Alma Swan and Sheridan Brown. Hougton et al. showed that  it would have taken an average of 2.2 years longer to develop or introduce the new products or processes in the absence of contributing academic research and would cost around DKK210 000 per firm in lost savings (DKK 10 million per year in total across the sample) – see page 47 of the pdf. Elsevier also don’t note that a 2007 study across the EU showed a very weak link between innovative enterprises and public research institutes and universities (see slide 13 and rest of talk given by Alma Swan at the UHMLG Spring Forum).

Mullen does have a point though  – open access to literature is not enough – there also needs to be the social, technological and policy infrastructure in place to ensure seamless searching and filtering between different platforms regardless of the content provider. But I don’t think that Mullen’s solution is the one to adopt. He concludes that the key would be “to provide companies with Elsevier’s entire set of tools for identifying useful research among its journals at an affordable price to help them quickly find the information they needed”…. .

Update (Mar 6): John Houghton responded to the article in Times Higher: “the proposed “tools”, in the form of paywall-controlled proprietary access silos, are the problem, not the solution

Publishers withdraw more than 120 gibberish papers

L0031339 Nonsense talked by a cobbler compared to the talk of a parso

Credit: L0031339 – Wellcome Library, London Nonsense talked by a cobbler compared to the talk of a parson and a surgeon-apothecary. Coloured etching attributed to C. Williams, ca. 1812. (CC BY) http://wellcomeimages.org/

Feb 24:  Richard van Noorden (Nature) covers the story that two publishers – IEE and Springer – have published computer generated papers and were selling them as part of their subscription services. Springer swiftly released a statement on 27th Feb stating that they were removing rather than retracting the papers ‘since they are all nonsense’. The news was covered by both the science press (not just Nature but also in Retraction Watch) and more general media, such as Slate magazine, Fox News, the Wire, and the Telegraph. Most of the posts linked the generation of fake papers with the pressure to publish (and the problems of the impact factor) while raising questions about  whether the rash of fake papers was indicative of ‘slipping standards among scientists’ or the fact that salaries of some professors are linked to the number of papers they publish.

Achilleas Kostoulas lays bare many of the underlying problems in his aptly titled post Fake Papers are not the real problem in Science where he discusses the long history of hoaxes and retractions in science, drawing on Curt Rice’s article in the Guardian about why you can’t trust research. Although papers published as conference proceedings are often not subject to the same rigour of peer-review as articles submitted to journals, there is no doubt that this mess, like others before it (e.g. the OA sting by John Bohannon or the ‘Arsenic Life’ paper in Science), is a larger symptom of a system of peer-review and research evaluation that is increasingly failing. It is not, however, an indictment of the rigour of peer-review for subscription services. Regardless of the type of publisher – OA or subscription –  there is an urgent need to research how research itself is evaluated both before and after publication. One question that remains unanswered is why these computer-generated papers were submitted in the first place. One possibility is that they come from scientists wanting to boost their publication records, although as Richard van Noorden notes (main link), some of the authors were unaware of the submissions. An alternative is that conference organisers might be trying to boost their profile although there is no direct evidence of this.

How Academia and Publishing are Destroying Scientific Innovation: A Conversation with Sydney Brenner

C0009284 Credit: Wellcome Library, London A traditional glass lightbulb with a metal filament against a glowing yellow background. Photograph 1/9/2001 Collection: Wellcome Images

C0009284 Credit: Wellcome Library, London Collection: Wellcome Images Copyrighted work available under CC BY 2.0

Feb 24: In a somewhat related article on the same day as the Nature story above, Elizabeth Dzeng discusses the state of science evaluation with Nobel prize winner Sydney Brenner. Her interview starts out with a fascinating insight into the emerging field of genetics and molecular biology when individuals at the Laboratory for Molecular Biology at Cambridge, such as Brenner, Fred Sanger and Francis Crick, were seen as extremists – part of some kind of evangelical sect. But Brenner goes on to note that the culture of innovation that facilitated their discoveries no longer exists because it has been replaced by a new culture in [US] science that relies on ‘the slavery of graduate students’ and the ‘post-doc as an indentured labourer’. And peer-review is hindering science, he says, and has become ‘completely corrupt’ – “it’s not publish or perish, it’s publish in the okay places [or perish] – while a system of publishing where the author hands over copyright to publishers perpetuates this. He concludes that the open access movement is beginning to shift the culture back  and that even journals like Cell, Nature and Science will have to bow in the end.

ALM community site launched

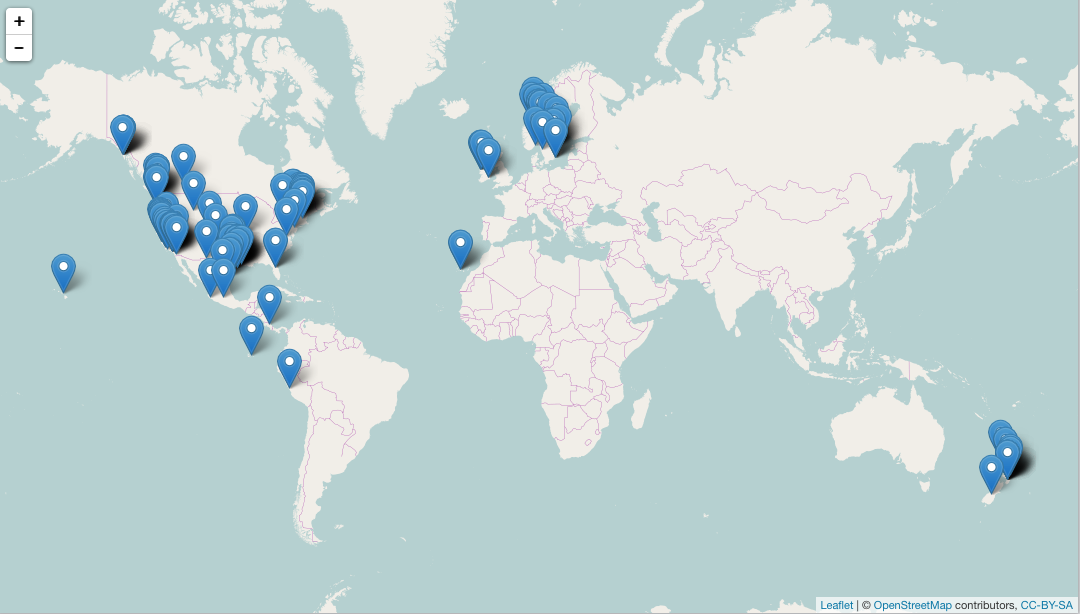
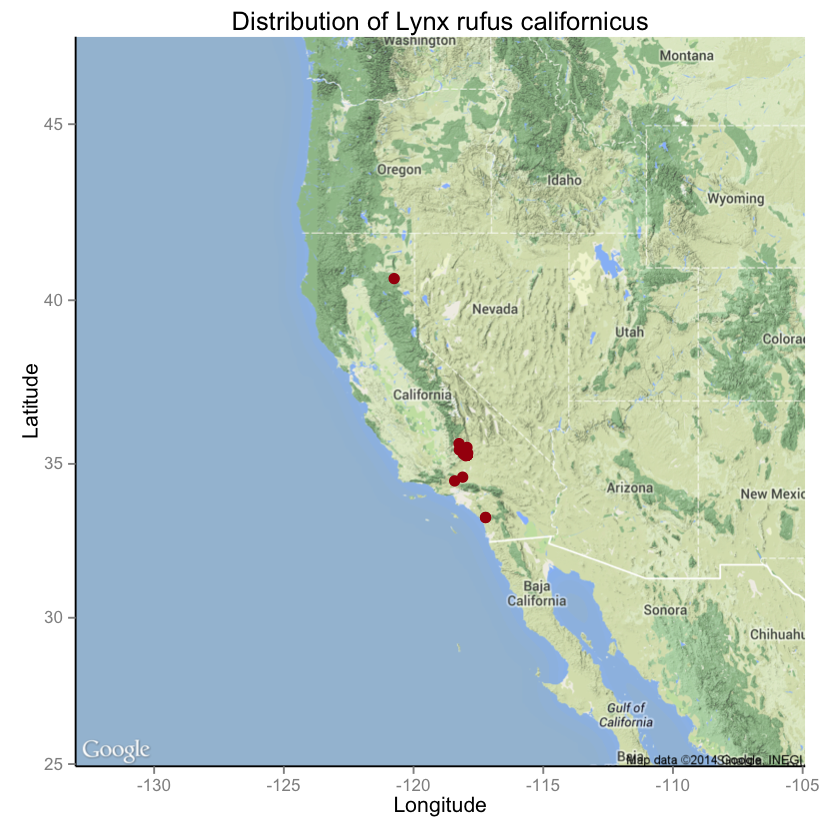
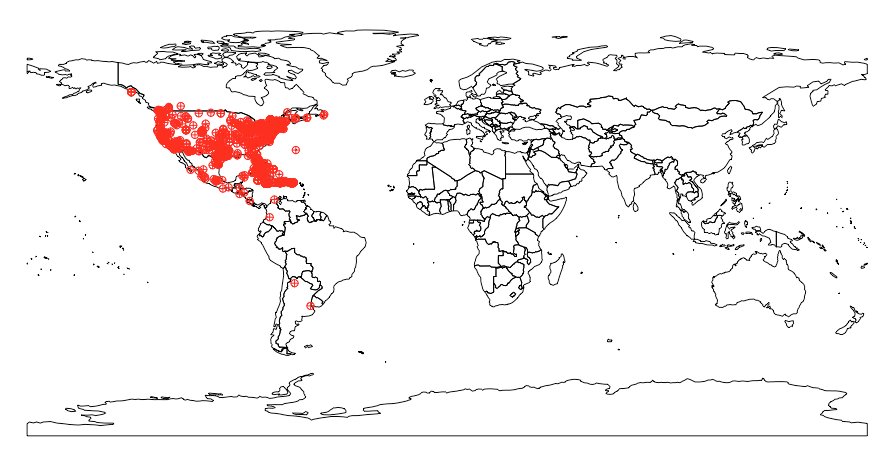
Feb 24: Jennifer Lin and Martin Fenner have launched a community site, including a blog, which aims to aggregate all the information about ALMs from different sites and to help showcase ALM visualizations of examples “done with d3.js and R, with source code and data openly available to make it easier for people to get started using ALM data.” A great one is the top ten most cited articles on Wikipedia (measured as the number of pages citing a particular article) which lists a paper from Science about life on Mars at the top and also features two PLOS ONE articles (e.g. one about a new species of river dolphin). Notice the source code on the main page re wikipedia citations – which you can lift and use to host the metrics on your own site (you will need an appropriate API key to make it work though).

Update (March 07) from Martin Fenner: The Wikipedia example is based on roughly 320,000 articles from January/February 2014 loaded by CrossRef Labs. So it indicates what recently published papers are popular, not all Wikipedia content (yet!)

Collaborate, co-operate, communicate!

Photo by Krista Baltroka (CC BY)

Feb 20: Over at scholarly kitchen, Alice Medows provides a refreshing post about the need for more collaboration and communication between open access advocates and those from the more traditional wing of the publishing industry with the aim of celebrating success regardless of where it comes from. This is partly in response to less than positive acclaim for initiatives like the ‘Access to Public Research’ (e.g. by Cameron). Much of the discussion has been about the tone adopted by one side or the other and it is worth distinguishing between tone and a genuine difference in substance. As Cameron  notes in his more recent response to this, “Discussion is always more useful than shouting matches. And sometimes that discussion will be robust, and sometimes people will get angry. It’s always worth trying to understand why someone has a strong response. Of course a strong response will always be better received if it focuses on issues. And that goes regardless of which side of any particular fence we might be standing on.”

Cost of hybrid

From Andrew Theo (2012), “Gold Open Access: Counting the Costs”, published in Ariadne, 3 December 2012, maps the cost of article processing fees against journal impact factor.Published under Creative Commons Attribution 3.0 Unported (CC BY 3.0) licence.

From Andrew Theo (2012), “Gold Open Access: Counting the Costs”, published in Ariadne, 3 December 2012, maps the cost of article processing fees against journal impact factor.Published under Creative Commons Attribution 3.0 Unported (CC BY 3.0) licence.

Feb 20: Danny Kingsley discusses the cost of publishing OA in a hybrid journal at the Australian Open Access Support Group blog, including providing this figure of the cost on publishing in a hybrid journal compared with a pure OA journal with an APC. The APC of hybrids are higher, regardless of impact factor of the journal (i.e. used as a surrogate of journal quality). She also discusses other research that shows that most hybrid journals charge about $3000 for access to OA articles. She doesn’t discuss why $3000 is a magic figure but I believe it was a legacy-based estimate that resulted from a calculation by a publisher several years ago. Note that the AOASG also has a page about how different publishers are dealing with accusations of double dipping.

March 5: In a related post Wouter Gerritsma discusses how much the Netherlands is currently spending on article processing charges based on the full list of publications with a Dutch affiliation. It’s worth following the calculation in detail because many more of these estimations will be made over the next few years as the debate on implementing Open Access increases. In particular he reaches a conclusion that a move to Open Access for all Dutch publications at the current average of €1087 per article would increase the cost over what the Netherlands pays in subscriptions by a total of €10.5M. However a similar study in the UK by Alma Swan and John Houghton showed that even the most research intensive UK institutions would save money in an Open Access world once the costs of co-authored papers are evenly distributed. Gerritsma notes that 50% of Dutch papers involve international collaboration suggesting the potential for a saving of up to €10M. Getting the details of these calculations right matters. Look back here next week for a discussion of how these calculations can vary.

Why open access should be a key issue for university leaders

Feb 18: Martin Hall (chair of Jisc and vice-chancellor of the University of Salford) makes an impassioned plea in the Guardian for Universities to be far more proactive about ‘openness’ – “the extent to which those working and studying within the university and college system can get access to any digitally-based information they need without encountering a virtual gateway: a password, subscription requirement or payment.”… “Without openness across global digital networks,” he adds “it is doubtful that large and complex problems in areas such as economics, climate change and health can be solved.” The tagline for the Guardian piece states it’s time senior leaders made openness – and its consequences – their concern.  But everyone can be a leader in this regard; individual researchers, readers and publishers all have the power to influence those in positions to take action.

The post PLOS Opens Roundup (March 7) appeared first on PLOS Opens.

14 Mar 21:43

Why FIRST is a Trojan Horse

by Cameron Neylon
Tertiarymatt

Well, this is maybe less relevant now than if I'd seen it a few days ago, but still useful.

Bill would be a major setback to progress on public access to US federally funded research

PLOS opposes the public access language set out within a bill introduced to the US House of Representatives on Monday, March 10. Section 303 of H.R. 4186, the Frontiers in Innovation, Research, Science and Technology (FIRST) Act would undercut the ability of federal agencies to effectively implement the widely supported White House Directive on Public Access to the Results of Federally Funded Research and undermine the successful public access program pioneered by the National Institutes of Health (NIH) – recently expanded through the FY14 Omnibus Appropriations Act to include the Departments Labor, Education and Health and Human Services.  Adoption of Section 303 would be a step backward from existing federal policy in the directive, and put the U.S. at a disadvantage among its global competitors.

PLOS has never previously opposed public access provisions in US legislation but the passage of FIRST as currently written would reduce access to tax-payer funded publications and data, restrict searching, text-mining and crowdsourcing and place US scientists and businesses at a competitive disadvantage.

“PLOS stands firmly alongside those seeking to advance public access to publicly funded knowledge”, said PLOS Chief Executive Officer Elizabeth Marincola. “This legislation would be a substantial step backwards compared to the existing U.S. policy as set out by the White House and in the recent Omnibus Bill.”

As the Scholarly Publishing and Academic Resources Coalition (SPARC) outlines, Section 303 would:

  • Slow the pace of scientific discovery by restricting public access to articles reporting on federally funded research for up to three years after initial publication.  This stands in stark contrast to the policies in use around the world, which call for maximum embargo periods of no more than six to 12 months.
  • Fail to support provisions that allow for shorter embargo periods to publicly funded research results.  This provision ignores the potential harm to stakeholders that can accrue through unnecessarily long delays.
  • Fail to ensure that federal agencies have full text copies of their funded research articles to archive and provide to the public for full use, and for long-term archiving.  By condoning a link to an article on a publisher’s website as an acceptable compliance mechanism, this provision puts the long term accessibility and utility of federally funded research articles at serious risk.
  • Stifle researchers’ ability to share their own research and to access the works of others, slowing progress towards scientific discoveries, medical breakthroughs, treatments and cures.
  • Make it harder for U.S. companies – especially small businesses and start-ups – to access cutting-edge research, thereby slowing their ability to innovate, create new products and services and generate new jobs.
  • Waste further time and taxpayer dollars by calling for a needless, additional 18-month delay while agencies “develop plans for” policies.  This is a duplication of federal agency work that was required by the White House Directive and has, in large part, already been completed.
  • Impose unnecessary costs on federal agency public access programs by conflating access and preservation policies as applied to articles and data.  The legislation does not make clear enough what data must be made accessible, nor adequately articulate the location of where such data would reside, or its terms of use.

The FIRST Act was introduced in the House of Representatives by Chairman Lamar Smith (R-TX) and Rep. Larry Bucshon (R-IN). It is expected to be referred to the House Committee on Science, Space, and Technology.

Take Action Before Thursday, March 13:

Encourage federal agencies to implement the White House Directive and ensure the passage of the bipartisan, bicameral Fair Access to Science and Technology Research (FASTR) Act.

The post Why FIRST is a Trojan Horse appeared first on PLOS Opens.

14 Mar 21:40

rnoaa - Access to NOAA National Climatic Data Center data

Tertiarymatt

This is pretty sweet.

We recently pushed the first version of rnoaa to CRAN - version 0.1. NOAA has a lot of data, some of which is provided via the National Climatic Data Center, or NCDC. NOAA has provided access to NCDC climate data via a RESTful API - which is great because people like us can create clients for different programming languages to access their data programatically. If you are so inclined to write a bit of R code, this means you can get to NCDC data in the R environment where your workflow is reproducible, and you can connect data acquisition to a suite of tools for data manipulation (e.g., plyr), visualization (e.g., ggplot2), and statistics (e.g., lme4, etc.).

In addition to NCDC climate data, we have functions to access sea ice cover data via FTP, as well as the Severe Weather Data Inventory (SWDI) via API. We will continue to add in other data sources as we have time.

Some notes:

The below examples uses the development version, but most things can be done with the CRAN version. Here's a quick run down of some things you can do with rnoaa:

First, install and load taxize

install.packages("rnoaa")

or development version from GitHub

install.packages("devtools")
library(devtools)
install_github("rnoaa", "ropensci")
library(rnoaa)
library(rnoaa)

API keys - authentication

You'll need an API key to use this package (essentially a password). Go to the NCDC website to get one. You can't use this package without an API key.

Once you obtain a key, there are two ways to use it.

a) Pass it inline with each function call (somewhat cumbersome and wordy)

noaa(datasetid = "PRECIP_HLY", locationid = "ZIP:28801", datatypeid = "HPCP",
    limit = 5, token = "YOUR_TOKEN")

b) Alternatively, you might find it easier to set this as an option, either by adding this line to the top of a script or somewhere in your .Rprofile file

options(noaakey = "KEY_EMAILED_TO_YOU")

Specifically use the name noaakey as the functions in the rnoaa package are looking for a key by that name.

Fetch list of city locations in descending order

noaa_locs(locationcategoryid = "CITY", sortfield = "name", sortorder = "desc",
    limit = 5)
## $meta
## $meta$totalCount
## [1] 1654
##
## $meta$pageCount
## [1] 5
##
## $meta$offset
## [1] 1
##
##
## $data
##              id           name datacoverage    mindate    maxdate
## 1 CITY:NL000012     Zwolle, NL       1.0000 1892-08-01 2014-01-31
## 2 CITY:SZ000007     Zurich, SZ       1.0000 1901-01-01 2014-03-11
## 3 CITY:NG000004     Zinder, NG       0.8678 1906-01-01 1980-12-31
## 4 CITY:UP000025  Zhytomyra, UP       0.9726 1938-01-01 2014-03-11
## 5 CITY:KZ000017 Zhezkazgan, KZ       0.9279 1948-03-01 2014-03-10
##
## attr(,"class")
## [1] "noaa_locs"

Get info on a station by specifcying a dataset, locationtype, location, and station

noaa_stations(datasetid = "GHCND", locationid = "FIPS:12017", stationid = "GHCND:USC00084289")
## $meta
## NULL
##
## $data
##                  id                  name datacoverage    mindate
## 1 GHCND:USC00084289 INVERNESS 3 SE, FL US            1 1899-02-01
##      maxdate
## 1 2014-03-12
##
## attr(,"class")
## [1] "noaa_stations"

Search for data

out <- noaa(datasetid = "GHCND", stationid = "GHCND:USW00014895", datatypeid = "PRCP",
    startdate = "2010-05-01", enddate = "2010-10-31")

See a data.frame

head(out$data)
##             station value attributes datatype                date
## 1 GHCND:USW00014895     0  T,,0,2400     PRCP 2010-05-01T00:00:00
## 2 GHCND:USW00014895    30   ,,0,2400     PRCP 2010-05-02T00:00:00
## 3 GHCND:USW00014895    51   ,,0,2400     PRCP 2010-05-03T00:00:00
## 4 GHCND:USW00014895     0  T,,0,2400     PRCP 2010-05-04T00:00:00
## 5 GHCND:USW00014895    18   ,,0,2400     PRCP 2010-05-05T00:00:00
## 6 GHCND:USW00014895    30   ,,0,2400     PRCP 2010-05-06T00:00:00

Get table of all datasets

res <- noaa_datasets()
res$data
##                     uid         id                    name datacoverage
## 1  gov.noaa.ncdc:C00040     ANNUAL        Annual Summaries         1.00
## 2  gov.noaa.ncdc:C00861      GHCND         Daily Summaries         1.00
## 3  gov.noaa.ncdc:C00841    GHCNDMS       Monthly Summaries         1.00
## 4  gov.noaa.ncdc:C00345    NEXRAD2         Nexrad Level II         0.95
## 5  gov.noaa.ncdc:C00708    NEXRAD3        Nexrad Level III         0.95
## 6  gov.noaa.ncdc:C00821 NORMAL_ANN Normals Annual/Seasonal         1.00
## 7  gov.noaa.ncdc:C00823 NORMAL_DLY           Normals Daily         1.00
## 8  gov.noaa.ncdc:C00824 NORMAL_HLY          Normals Hourly         1.00
## 9  gov.noaa.ncdc:C00822 NORMAL_MLY         Normals Monthly         1.00
## 10 gov.noaa.ncdc:C00505  PRECIP_15 Precipitation 15 Minute         0.25
## 11 gov.noaa.ncdc:C00313 PRECIP_HLY    Precipitation Hourly         1.00
##       mindate    maxdate
## 1  1831-02-01 2013-11-01
## 2  1763-01-01 2014-03-13
## 3  1763-01-01 2014-01-01
## 4  1991-06-05 2014-03-12
## 5  1994-05-20 2014-03-09
## 6  2010-01-01 2010-01-01
## 7  2010-01-01 2010-12-31
## 8  2010-01-01 2010-12-31
## 9  2010-01-01 2010-12-01
## 10 1970-05-12 2013-03-01
## 11 1900-01-01 2013-03-01

Get data category data and metadata

noaa_datacats(locationid = "CITY:US390029", limit = 5)
## $meta
## $meta$totalCount
## [1] 37
##
## $meta$pageCount
## [1] 5
##
## $meta$offset
## [1] 1
##
##
## $data
##        id                 name
## 1  ANNAGR  Annual Agricultural
## 2   ANNDD   Annual Degree Days
## 3 ANNPRCP Annual Precipitation
## 4 ANNTEMP   Annual Temperature
## 5   AUAGR  Autumn Agricultural
##
## attr(,"class")
## [1] "noaa_datacats"

Plotting

Plot data, super simple, but it's a start

out <- noaa(datasetid = "GHCND", stationid = "GHCND:USW00014895", datatypeid = "PRCP",
    startdate = "2010-05-01", enddate = "2010-10-31", limit = 500)
noaa_plot(out, breaks = "1 month", dateformat = "%d/%m")

More plotting

You can pass many outputs from calls to the noaa function in to the noaa_plot function.

out1 <- noaa(datasetid = "GHCND", stationid = "GHCND:USW00014895", datatypeid = "PRCP",
    startdate = "2010-03-01", enddate = "2010-05-31", limit = 500)
out2 <- noaa(datasetid = "GHCND", stationid = "GHCND:USW00014895", datatypeid = "PRCP",
    startdate = "2010-09-01", enddate = "2010-10-31", limit = 500)
noaa_plot(out1, out2, breaks = "45 days")

Sea ice cover data

Get urls for ftp files

urls <- sapply(seq(1979, 1990, 1), function(x) seaiceeurls(yr = x, mo = "Feb",
    pole = "S"))

Call the noaa_seaice function on each url, which downloads shape files, and reads them in to R as sp objects

out <- lapply(urls, noaa_seaice)

Then plot

library(plyr)
library(ggplot2)
names(out) <- seq(1979, 1990, 1)
df <- ldply(out)
ggplot(df, aes(long, lat, group = group)) + geom_polygon(fill = "steelblue") +
    theme_ice() + facet_wrap(~.id)

Severe weather data

Search for nx3tvs data from 5 May 2006 to 6 May 2006

noaa_swdi(dataset = "nx3tvs", startdate = "20060505", enddate = "20060506",
    limit = 3)
## $meta
## $meta$totalCount
## [1] 3
##
## $meta$totalTimeInSeconds
## [1] 0.004
##
##
## $data
##                  ztime wsr_id cell_id cell_type range azimuth max_shear
## 1 2006-05-05T00:05:50Z   KBMX      Q0       TVS     7     217       403
## 2 2006-05-05T00:10:02Z   KBMX      Q0       TVS     5     208       421
## 3 2006-05-05T00:12:34Z   KSJT      P2       TVS    49     106        17
##   mxdv
## 1  116
## 2  120
## 3   52
##
## $shape
##                                        shape
## 1 POINT (-86.8535716274277 33.0786326913943)
## 2 POINT (-86.8165772540846 33.0982820681588)
## 3 POINT (-99.5771091971025 31.1421609654838)
##
## attr(,"class")
## [1] "noaa_swdi"

Get all 'plsr' within the bounding box (-91,30,-90,31)

noaa_swdi(dataset = "plsr", startdate = "20060505", enddate = "20060510", bbox = c(-91,
    30, -90, 31), limit = 3)
## $meta
## $meta$totalCount
## [1] 3
##
## $meta$totalTimeInSeconds
## [1] 0.015
##
##
## $data
##                  ztime     id        event magnitude         city
## 1 2006-05-09T02:20:00Z 427540         HAIL         1 5 E KENTWOOD
## 2 2006-05-09T02:40:00Z 427536         HAIL         1 MOUNT HERMAN
## 3 2006-05-09T02:40:00Z 427537 TSTM WND DMG     -9999 MOUNT HERMAN
##       county state          source
## 1 TANGIPAHOA    LA TRAINED SPOTTER
## 2 WASHINGTON    LA TRAINED SPOTTER
## 3 WASHINGTON    LA TRAINED SPOTTER
##
## $shape
##                  shape
## 1 POINT (-90.43 30.93)
## 2  POINT (-90.3 30.96)
## 3  POINT (-90.3 30.96)
##
## attr(,"class")
## [1] "noaa_swdi"

Get all 'nx3tvs' within the tile -102.1/32.6

noaa_swdi(dataset = "nx3tvs", startdate = "20060506", enddate = "20060507",
    tile = c(-102.12, 32.62), limit = 3)
## $meta
## $meta$totalCount
## [1] 3
##
## $meta$totalTimeInSeconds
## [1] 0.021
##
##
## $data
##                  ztime wsr_id cell_id cell_type range azimuth max_shear
## 1 2006-05-06T00:41:29Z   KMAF      D9       TVS    37       6        39
## 2 2006-05-06T03:56:18Z   KMAF      N4       TVS    39       3        30
## 3 2006-05-06T03:56:18Z   KMAF      N4       TVS    42       4        20
##   mxdv
## 1   85
## 2   73
## 3   52
##
## $shape
##                                        shape
## 1 POINT (-102.112726356403 32.5574494581267)
## 2  POINT (-102.14873079873 32.5933553250156)
## 3 POINT (-102.131167022161 32.6426287452898)
##
## attr(,"class")
## [1] "noaa_swdi"

Counts

Get number of 'nx3tvs' within 15 miles of latitude = 32.7 and longitude = -102.0

noaa_swdi(dataset = "nx3tvs", startdate = "20060505", enddate = "20060516",
    radius = 15, center = c(-102, 32.7), stat = "count")
## $meta
## $meta$totalCount
## [1] 1
##
## $meta$totalTimeInSeconds
## [1] 0.02
##
##
## $data
## [1] "37"
##
## $shape
## data frame with 0 columns and 1 rows
##
## attr(,"class")
## [1] "noaa_swdi"
14 Mar 21:31

You and Jimi Hendrix

by Greg Wilson

I had a discussion a couple of weeks ago about software development tools and processes with some undergraduate students I'm mentoring. They asked why I'm so finicky about putting things under version control, writing unit tests, and creating tickets to keep track of what still needs to be done. The short answer is, because that's what Jimi Hendrix would have done.

The long answer goes something like this: if you want to be able to improvise without falling flat on your face, you need to have rock-solid technique. Hendrix couldn't have done what he did with wah-wah pedals and overdriven amplifiers if he couldn't first play scales and arpeggios; as one "artist" after another has shown over the last forty years, people who try to do the former without mastering the latter are just making noise. The same is true of jazz greats like Parker and Coltrane, and of classical musicians like Yehudi Menuhin.

I think it's true of programmers as well. I don't think I code nearly as well as Hendrix played guitar, but I know people who do. They don't actually put everything they care about under version control, and they certainly don't always write unit tests before writing code. However, they're fluent enough with those practices to decide when not using them is the right choice.

More importantly, good programmers have done things the right way for so long that they revert to good practice out of habit when they're stressed and tired. That's the real reason I push novices so hard to do things the right way every time: when the deadline is just hours away and nothing is working, throwing away your workflow and reverting to feral coding is exactly the wrong strategy. Practicing arpeggios might not seem like fun when you're starting out, but getting the fundamentals right will make anyone a better programmer, just as learning how to play a twelve-bar blues will let pretty much anyone sit in with the local bar band.

Note 1: much of my thinking about improvisation in music, programming, and teaching was shaped by Ted Gioia's thought-provoking book The Imperfect Art.

Note 2: several of the people who reviewed this post on GitHub had comments too good not to share:

  • "You don't have to strive to be Jimi Hendrix, but if nothing else if you can at least master a few chords you can play in a punk band and still rock."
  • "I see inspired instructors burning their laptops on stage at the end of the git lesson..."
  • "I see fire marshals :-) How 'bout just inspired instructors typing behind their backs?"

Originally posted 2014-03-14 by Greg Wilson in Opinion.

14 Mar 07:54

Confidence Intervals for Effect Sizes from Noncentral Distributions

by Russ Clay
Tertiarymatt

It's kind of frustrating that I will never really be a good enough statistician.

(Thanks to Shauna Gordon-McKeon, Fred Hasselman, Daniël Lakens, Sean Mackinnon, and Sheila Miguez for their contributions and feedback to this post.)

I recently took on the task of calculating a confidence interval around an effect size stemming from a noncentral statistical distribution (the F-distribution to be precise). This was new to me, and as I am of the view that such statistical procedures would add value to the work being done in the social and behavioral sciences, but that they are not common in practice at the present time, potentially due to lack of awareness, I wanted to pass along some of the things that I found.
In an effort to estimate the replicability of psychological science, an important first step is to determine the criteria for declaring a given replication attempt as successful. Lacking clear consensus around this criteria, the OpenScience group determined that rather than settling on a single set of criteria by which the replicability of psychological research would be assessed, multiple methods would be employed, all which provide a measure of valuable insight regarding the reproducibility of published findings in psychology (OpenScience Collaboration, 2012). One such method is to examine the confidence interval around the original target effect and to see if this confidence interval overlaps with the confidence interval from the replication effect. However, estimating the confidence interval around many effects in social science research requires the use of non-central probability distributions, and most mainstream statistical packages (e.g. SAS, SPSS) do not provide off the shelf capabilities for deriving confidence intervals from these distributions (Kelley, 2007).

Most of us probably picture common statistical distributions such as the t-distribution, the F-distribution, and the χ2 distribution as being two dimensional, with the x-axis representing the value of the test statistic and the area under the curve representing the likelihood of observing such a value in a sample population. When first learning to conduct these statistical tests, such visual representations likely provided a helpful way to convey the concept that more extreme values of the test statistic were less likely. In the realm of null hypothesis statistical testing (NHST), this provides a tool for visualizing how extreme the test statistic would need to be before we would be willing to reject a null hypothesis. However, it is important to remember that these distributions vary along a third parameter as well: the noncentrality parameter. The distribution that we use to determine the cut-off points for rejecting a null hypothesis is a special, central case of the distribution when the noncentrality parameter is zero. This special-case distribution gives the probabilities of test statistic values when the null hypothesis is true (i.e., when the population effect is zero). As the noncentrality parameter changes (i.e., when we assume that an effect does exist), the shape of the distribution which defines the probabilities of obtaining various values of the parameter in our statistical tests changes as well. The following figure (copied from the Wikipedia page for the noncentral t-distribution) might help provide a sense of how the shape of the t-distribution changes as the noncentrality parameter varies.

non-central T distribution
Figure by Skbkekas, licensed CC BY 3.0.

The first two plots (orange and purple) illustrate the different shapes of the distribution under the assumption that the true population parameter (the difference in means) is zero. The value of v indicates the degrees of freedom used to determine the probabilities under the curve. The difference between these first two curves stems from the fact that the purple curve has more degrees of freedom (a larger sample), and thus there will be a higher probability of observing values near the mean. These distributions are central (and symmetrical), and as such, values of x that are equally higher or lower than the mean are equally probable. The second two plots (blue and green) illustrate the shapes of the distribution under the assumption that the true population parameter is two. Notice that both of these curves are positively skewed, and that this skewness is particularly pronounced in the blue curve as it is based on fewer degrees of freedom (smaller sample size). The important thing to note is that for these plots, values of x that are equally higher or lower than the mean are NOT equally probable. Observing a value of x = 4 under the assumption that the true value of x is two is considerably more probable than observing a value of x = 0. Because of this, a confidence interval around an effect that is anything other than zero will be asymmetrical and will require a bit of work to calculate.

Because the shape (and thus the degree of symmetry) of many statistical distributions depends on the size of the effect that is present in the population, we need a noncentrality parameter to aid in determining the shape of the distribution and the boundaries of any confidence interval of the population effect. As mentioned previously, these complexities do not arise as often as we might expect in everyday research because when we use these distributions in the context of null-hypothesis statistical testing (NHST), we can assume a special, ‘centralized’ case of the distributions that occurs when the true population effect of interest is zero (the typical null hypothesis). However, confidence intervals can provide different information than what can be obtained through NHST. When testing a null hypothesis, what we glean from our statistics is the probability of obtaining the effect observed in our sample if the true population effect is zero. The p-value represents this probability, and is derived from a probability curve with a noncentrality parameter of zero. As mentioned above, these special cases of statistical distributions such as the t, F, and χ2 are ‘central’ distributions. On the other hand, when we wish to construct a confidence interval of a population effect, we are no longer in the NHST world, and we no longer operate under the assumption of ‘no effect’. In fact, when we build a confidence interval, we are not necessarily making assumptions at all about the existence or non-existence of an effect. Instead, when we build a confidence interval, we want a range of values that is likely to contain the true population effect with some degree of confidence. To be crystal clear, when we construct a 95% confidence interval around a test statistic, what we are saying is that if we repeatedly tested random samples of the same size from the target population under identical conditions, the true population parameter will be bounded by the 95% confidence interval derived from these samples 95% of the time.

From a practical standpoint, a confidence interval can tell us everything that NHST can, and then some. If the 95% confidence interval of a given effect contains the value of zero, then there is a good chance that there is a negligible effect in the relationship you are testing. In this case, as a researcher, the conclusion that you would reach is conceptually similar to declaring that you are not willing to reject a null hypothesis of zero effect on the grounds that there is greater than a 5% chance that the effect is actually zero. However, a confidence interval allows the researcher to say a bit more about the potential size of a population effect as well as the degree of variability that exists in it’s estimate, whereas NHST only permits the researcher to state, with a specified level of confidence, the likelihood that an effect exists at all.

Why, then, is NHST the overwhelming choice of statisticians in the social sciences? The likely answer has to do with the idea of non-centrality stated above. When we build a confidence interval around an effect size, we generally do not build the confidence interval around an effect of zero. Instead, we build the confidence interval around the effect that we find in our sample. As such, we are unable to build the confidence interval using the symmetrical, special case instances of many of our statistical distributions. We have to build it using an asymmetrical distribution that has a shape (a degree of non-centrality) that depends on the effect that we found in our sample. This gets messy, complicated, and requires a lot of computation. As such, the calculation of these confidence intervals was not practical until it became commonplace for researchers to have at their disposal the computational power available in modern computing systems. However, research in the social sciences has been around much longer than your everyday, affordable, quad-core laptop, and because building confidence intervals around effects from non-central distributions was impractical for much of the history of the social sciences, these statistical techniques were not often taught, and their lack of use is likely to be an artifact of institutional history (Steiger & Fouladi, 1997). All of this to say that in today’s world, researchers generally have more than enough computational power at their disposal to easily and efficiently construct a confidence interval around an effect from a non-central distribution. The barriers to these statistical techniques have been largely removed, and as the value of the information obtained from a confidence interval exceeds the value of the information that can be obtained from NHST, it is useful to spread the word about resources that can help in the computation of confidence intervals around common effect size metrics in the social and behavioral sciences.

One resource that I found to be particularly useful is the MBESS (Methods for the Behavioral, Educational, and Social Sciences) package for the R statistical software platform. For those unfamiliar with R, it is a free, open-source statistical software package which can be run on Unix, Mac, and Windows platforms. The standard R software contains basic statistics functionality, but also provides the capability for contributors to develop their own functionality (typically referred to as ‘packages’) which can be made available to the larger user community for download. MBESS is one such package which provides ninety-seven different functions for statistical procedures that are readily applicable to statistical analysis techniques in the behavioral, educational, and social sciences. Twenty-five of these functions involve the calculation of confidence intervals or confidence limits, mostly for statistics stemming from noncentral distributions.

For example, I used the ci.pvaf (confidence interval of the proportion of variance accounted for) function from the MBESS package to obtain a 95% confidence interval around an η2 effect of 0.11 from a one-way between groups analysis of variance. In order to do this, I only needed to supply the function with several relevant arguments:

F-value: This is the F-value from a fixed-effects ANOVA
df: The numerator and denominator degrees of freedom from the analysis
N: The sample size
Confidence Level: The confidence level coverage that you desire (i.e. 95%)

No more information is required. Based on this, the function can calculate the desired confidence interval around the effect. Here is a copy of the code that I entered and what was produced (with comments in italics to explain what is going on in each step):

library(MBESS);

once you have installed the MBESS package, this command makes it available for your current session of R

ci.pvaf(F.value=4.97, df.1=2, df.2=81, N=84, conf.level=.95)

this uses the ci.pvaf function in the MBESS package to calculate the confidence interval. I have given # the function an F-value (F.value) of 4.97, with 2 degrees of freedom between groups (df.1), and 81 # degrees of freedom within groups (df.2), a sample size (N) of 84, and have asked it to produce a 95% confidence interval (conf.level). Executing the above command produces the following output:

$Lower.Limit.Proportion.of.Variance.Accounted.for
[1] 0.007611619

$Probability.Less.Lower.Limit
[1] 0.025

$Upper.Limit.Proportion.of.Variance.Accounted.for
[1] 0.2320935

$Probability.Greater.Upper.Limit
[1] 0.025

$Actual.Coverage
[1] 0.95

Thus, the 95% confidence interval around my η2 effect is [0.01 - 0.23].

Similar functions are available in the MBESS package for calculating confidence intervals around a contrast in a fixed-effects ANOVA, multiple correlation coefficient, squared multiple correlation coefficient, regression coefficient, reliability coefficient, RMSEA, standardized mean difference, signal-to-noise ratio, and χ2 parameters, among others.

Additional Resources
  • Fred Hasselman has created a brief tutorial for computing effect size confidence intervals using R.

  • For those more familiar with conducting statistics in an SPSS environment, Dr. Karl Wuensch at East Carolina University provides links to several SPSS programs on his Web Page. This program is for calculating confidence intervals for a standardized mean difference (Cohen’s d).

  • In addition, I came across several publications that I found useful in providing background information regarding non-central distributions (a few of which are cited above). I’m sure there are more, but I found these to be a good place to start:

Cumming, G. (2006). How the noncentral t distribution got its hump. Paper presented at the seventh International Conference on Teaching Statistics, Salvador, Bahia, Brazil.

Cumming, G. (2014). The new statistics: Why and how. Psychological Science, 25, 7-29. DOI: 10.1177/0956797613504966

Kelley, K. (2007). Confidence intervals for standardized effect sizes: Theory, application, and implementation. Journal of Statistical Software, 20, 1-24.

Smithson, M. (2001). Correct confidence intervals for various regression effect sizes and parameters: The importance of noncentral distributions in computing intervals. Educational And Psychological Measurement, 61(4), 605-632. doi:10.1177/00131640121971392

Steiger, J. H., & Fouladi, R. T. (1997). Noncentrality interval estimation and the evaluation of statistical models. In L. Harlow, S. > Mulaik, & J. Steiger (Eds.), What if there were no significance tests? (pp. 221-256). Mahwah, NJ: Erlbaum.

Hopefully others find this information as useful as I did!

14 Mar 03:18

Art of the day: a little in-process slice panel of Circe.


Art of the day: a little in-process slice panel of Circe.