Shared posts

03 Mar 12:13

YANSS Podcast 019 – Placebo sleep and other new discoveries in placebo research

by David McRaney

The Topic: The Placebo Effect

The Guest: Kristi Erdal

The Episode: DownloadiTunesStitcherRSSSoundcloud

Photo Illustration by Candy (it's aspirin)

Photo Illustration by the artist known as Candy (it’s aspirin)

How powerful is the placebo effect? After a good night’s sleep could a scientist convince you that you had tossed and turned, and if so, how would that affect your perceptions and behavior? What if a doctor told you that you had slept like a baby when in reality you had barely slept at all? Would hearing those words improve your performance on a difficult test?

In this episode we learn the answers to these questions and more as we explore how research continues to unravel the mysteries behind the placebo effect and how it can drastically alter our bodies and minds.

Kristi ErdalOur guest is Kristi Erdal, a psychologist at Colorado College who discovered placebo sleep along with one of her students, Christina Draganich. Draganich wondered if such a thing might exist after reading all the literature on placebos, and Erdal helped her create the research methods she used to test her hypothesis. Erdal’s page at Colorado College can be found here.

After the interview, I discuss a news story about how important eccentricity is when it comes to evaluating an artist’s work.

In every episode, before I read a bit of self delusion news, I taste a cookie baked from a recipe sent in by a listener/reader. That listener/reader wins a signed copy of my new book, “You Are Now Less Dumb,” and I post the recipe on the YANSS Pinterest page. This episode’s winner is Natalie Sun who submitted a recipe for White Chocolate Oreo Cookies. Send your own recipes to david {at} youarenotsosmart.com.

White Chocolate Oreos

Links and Sources

The Episode: Download – iTunes – Stitcher – RSS – Soundcloud

Boing Boing Podcasts

Cookie Recipes

Steve Silberman’s Article About The Placebo Effect

Kristi Erdal’s Page at Colorado College

The Placebo Sleep Press Release

The Placebo Sleep Abstract

Eccentricity of Artists Article

Beecher’s Paper: The Powerful Placebo

Ben Goldacher Talks About the Placebo Effect

Daniel Keogh’s Video About the Placebo Effect

21 Dec 07:02

全球调查显示中国人最物质至上

by BREE FENG

针对财富观的一项全球调查证实了国内很多批评者已经发现的问题:当今的中国人太现实了。

这项调查由法国市场调查公司益普索(Ipsos)在9月份开展,调查对象涉及20个国家的逾1.6万成年人。

上周发布的调查结果显示,在用财产来衡量成功方面,中国受访者名列榜首,人数比例是世界平均水平的两倍多。有71%接受调查的中国人认同“我以自己拥有的东西来作为衡量成功的标准”这个说法,远高于东亚邻国:认同这一说法的韩国人占45%,日本人占22%。发达经济体的受访者一般不认同这一说法。略超过20%的美国人和加拿大人、以及仅仅7%的瑞典人认同这一观点。中国人也最有可能认同“我感到取得成功和赚钱的压力很大”这个说法。68%的中国受访者认同这一说法,排在其后的是南非和俄罗斯(均为66%),之后是印度(60%)。认同这一观点的美国人占46%,与世界平均水平相符。虽然中国人对自己国家前景的看法要比其他很多国家的人更乐观,但在对个人未来的乐观态度方面,中国人的排名低于世界平均水平。

在一财网将这些调查结果发布到网站上以后,人们在网上对此展开了大量讨论,到周五中午,对这篇文章的评论数量已经超过23000条。

辽宁一名用户的评论得到的“同意”次数最多,这一评论说,“一个没有信仰的国家,崇拜金钱和权势,一点都不令人吃惊!”

其他评论似乎没有认为调查结果有什么问题。

一条安徽用户的评论称,金钱是“万能的”,而有钱就意味着“荣耀、女人和权力。”

另一名来自浙江的用户说,“在中国,金钱可以办到很多在其他国家办不到的事情,所以所谓的资本主义或社会主义似乎只是个空洞的口号。中国社会的意识形态甚至比资本主义国家更现实。”

虽然中国的相当大部分地区依然贫穷,但如今中国拥有一个不断壮大的中产阶层,几乎每个大城市都有一两个奢侈品购物区。根据调研公司欧睿信息咨询公司(Euromonitor International)的调查,中国已在2012年超越法国,成为世界第三大奢侈品市场。

对那些认为中国社会沉迷于金钱的人来说,这些调查结果应该在意料之中。一些中国人毫无顾忌地炫富,这在网上引发愤怒、嘲讽和嫉妒交织的情绪。中国互联网使用越来越普及让贫富差距更容易暴露,很多“土豪”照片在中国社交媒体迅速走红,“土豪”是人们为嘲笑恶俗消费主义而发明的一个词。

然而,人们应当谨慎权衡这些调查结果。益普索称,来自中国的调查结果“并不能反映一般人群”,因为中国的互联网普及率仍不到60%。但是,该公司称,与尚未达到这个门槛的其它被调查国家(包括印度、俄罗斯和巴西)一样,参与调查的人士被认为是“主流参与市民”,他们的教育程度、收入水平和互联网使用与较发达国家人士相仿。

这份研究的结果是该公司“全球趋势调查”系列的第一份研究结果,该系列调查旨在衡量人们的价值观以及对政府和世界的看法。该公司计划在2014年发布更多调查结果。

叶非凡对本文有研究贡献。

翻译:张亮亮

纽约时报中文网

19 Nov 13:12

Extract the *uvfit file into an ASCII file in GILDAS

by directus

This script is for extracting the velocity, flux and flux error in each channel for the current *uvfit, after UVFIT is done, into an ASCII file. And then you can use IDL or other tools to analyze the spectrum.

!** DEFINE THE VARIABLE 'sou0' AND THE FILENAME 
! 'name'.uvfit
  say 'name'
  say  "please check the name before using this scripts"
  say  "***********************************************"
 
!** INPUT THE var(sou0) NAME BELOW **
  define image sou0 'name'.uvfit read
!*************************************
 
!** BELOW...FOR ON COMPONENT POINT SOURCE FITTING ONLY...
 
  sic dele 'name'.dat
  sic out 'name'.dat
 
  for i 1 to sou0%dim[1]
  say 'i' 'sou0[i,4]' 'sou0[i,12]' 'sou0[i,13]' 
  next
 
 
!** OR FOR TWO POINT COMPONENTS, BEFORE USING, UNCOMMENT IT
!** Please modify the following according to your fitting model
! for i 1 to sou0%dim[1]
! say 'i' 'sou0[i,4]' 'sou0[i,12]' 'sou0[i,13]' 'sou0[i,29]' 'sou0[i,30]' 
! next
 
  sic out

You can save this script as "uvfit2txt.map" to the current working directory and then just type "@./uvfit2txt.map" to execute the script.
10 Nov 14:10

河内分子云的磁场和条形结构:∥,或者⊥?

by Xing Lu

标题:The Link between Magnetic Fields and Filamentary Clouds: Bimodal Cloud Orientations in the Gould Belt
作者:Hua-bai Li, Min Fang, Thomas Henning, Jouni Kainulainen
论文索引:arXiv:1310.6261
编辑供稿:南京大学 吕行

 祝大家光棍节快乐!

磁场和恒星形成

磁场在恒星形成有着重要的作用,小到几百AU的原恒星盘,大到几百pc的巨分子云,都要考虑磁场的存在。比如,原恒星喷流的模型中,需要磁场(e.g. X-wind model);为了解释原恒星盘的存在需要考虑磁场的耗散,否则会导magnetic braking catastrophe;磁场和湍流可能能够支撑分子云对抗引力,从而解释为何其中的恒星形成率低于预期值。

从观测的角度来看,在较小尺度上,关于恒星形成区中磁场和吸积盘/外流的关系,最近CARMA的TADPOL项目利用尘埃偏振观测得到了很多结果(TADPOL主页Hull et al. 2013aHull et al. 2013b相关报告下载)。在较大尺度上,Li & Henning 2011发现M33中巨分子云中的磁场与旋臂方向有很好的相关性,以及Li et al. 2009发现分子云中的磁场在100pc到1pc尺度上的方向是一致的。

这篇文章则在1-10 pc尺度上,分析了磁场与分子云中的条形结构的几何关系,试图用磁场解释条形结构的成因。

Filaments,HFS,Network

分子云的filaments(条形结构)在临近的分子云中早已被发现(例如猎户分子云中的条形结构),在Hershcel空间红外望远镜的数据中更是发现这种结构在河内分子云中几乎无处不在。Herschel发现的filaments的典型长度1-10 pc,宽度0.1 pc。另外,Myers 2009分析了临近分子云的几何形状,发现其中存在大量hub-filament system(HFS),也就是中心有一个密度大(柱密度N>10^{23}cm^{-2})、质量大(M>10^3M_{\odot})的“hub”,周围辐射出细长的filaments。这些filaments经常是互相平行的,而hub通常在某个方向上被拉长(像一只蜈蚣…)。另一种包含很多filaments的结构,network of filaments,也就是很多并不平行的filaments交错在一起,没有明显的hub(例如Busquet et al. 2012)。

peretto

一个典型的HFS,Fig.4 of Peretto et al. 2013

对于这种结构,有很多问题需要回答:它们是真实存在的,或是视线方向上不相关成分的叠加(参见”The Bones of the MW”)?它们是怎么形成的(Nagai et al. 1998; Van Loo et al. 2013; Mark Krumholz在PPVI上的报告)?是如何保持细长的形状而不被gravitational collapse/turbulence/feedback等因素破坏的?对于其中的恒星形成有何影响(Polychroni et al. 2013)?HFS/network又是如何形成的?

磁场和Filament

谈到磁场,我们也许会想到小时候玩磁铁时,铁屑沿磁力线方向整齐排列的样子。也许磁场在filaments中也起到了类似的作用?要证实这个猜想,首先要有观测证据。如果我们看到磁场方向和条形结构的方向完全没有相关,那么两者很可能毫无关系。

本文利用了现有的光学偏振观测所指示的磁场方向,又利用近红外消光得到了条形结构的方向。为了尽量排除前景和背景辐射对偏振的影响,作者挑选了高银纬的几个分子云。为了量化分子云的方向,作者对消光的数据做了autocorrelation。又由于三维空间中的角度投影到二维平面上存在很大不确定性,作者做了Monte-Carlo模拟,确保所发现的两者夹角的趋势是真实的。总之经过小心地检验后,作者发现,磁场和条形结构趋向于平行或者垂直,相关性比较明显,如下图所示。

figure4

Fig. 4 of Li et al. 2013

如何解释这种相关性?这篇文章提出了一个简单的模型:磁场在分子云中是动力学重要的,也就是气体被磁场束缚,就像铁屑被磁铁的磁场束缚;在这个前提下,分子云被冻结在磁力线上,如下图所示,就只有两种命运:如果内部湍流动能足以支撑自引力势能,就保持沿磁场方向的条形结构;湍流不能支撑引力,被压扁,从侧面看就成为垂直于磁场方向的条形。

figure3

Fig. 3 of Li et al. 2013

这个模型也自然地解释了HFS的形成:HFS中心的拉长的hub,对应密度大所以被自身重力压扁的cloud 2,向周围辐射出的filaments,对应密度较小,可以沿磁场方向伸展的cloud 1。

最后值得一提的是作者通过比较不同柱密度下磁场的强度,推测出分子云开始坍缩的临界柱密度。因为考虑到磁冻结效应,分子云坍缩时磁场强度也会随之增大,磁场强度开始增大时对应的柱密度也就是坍缩时的柱密度。如下图所示,柱密度在\gtrsim 10^{22}\ cm^{-2}时(由Zeeman分裂测得的视线方向上的)磁场强度开始变大。这对应着分子云坍缩的临界柱密度。

figure7

Fig. 7 of Li et al. 2013

14 Oct 03:15

Read Better Books To Be a Better Person

by timothy
directus

it will boost you EQ

00_NOP writes "Researchers from the New School for Social Research in New York have demonstrated that if you read quality literary fiction you become a better person, in the sense that you are more likely to empathize with others [paper abstract]. Presumably we can all think of books that have changed the way we feel about the world — so this is, in a sense, a scientific confirmation of something fairly intuitive."

Share on Google+

Read more of this story at Slashdot.


01 Oct 05:34

IPCC:气候变化要比原来认识到的更加严重

by 橡树村

本文作者:橡树村

global_warming_by_teabing2013年9月27日,联合国政府间气候变化专门委员会IPCC发布了第五次评估报告第一工作组的决策者摘要。第一工作组的任务是就气候变化的相关科学问题进行分析阐述,对气候变化的原因进行归因,并对未来的变化趋势进行预估。与2007年发布的第四次评估报告相比,新的评估报告认为,气候变化要比原来认识到的更加严重,而有95%以上的把握认为气候变化是人类的行为造成的。

气候变化的相关研究非常复杂,涉及到多个学科,不过对于普通人来讲,可以归结到四个问题:全球气候真的在变暖吗?导致气候变化的原因都有什么,哪个是主要的?气候变化会带来什么样的后果?人类如何应对气候变化?IPCC使用三个工作组来回答人们的这些疑问,其中前两个问题由第一工作组来回答。

新的报告坚持了以往报告的说法,认为气候变暖是明确的。这个结论有多方面的观察结果支持,地表气温是最直接的指标。报告指出从1950年代以来的变化是千年以来所未见的;从有详细气象记录以来的1850年代开始,刚刚过去的三个年代每一个都刷新了气温最高的纪录。从1983到2012年这三十年,至少在北半球是1400年以来最热的三十年。在1880年到2012年间,陆地与海洋表面的气温已经升高了0.85摄氏度,而2003到2012年十年的平均气温与1850到1900年五十年的平均气温比较,也高出了0.78摄氏度。

cbUKISjho_nsD14MEBacllA8XN38TFFGDKig6dIo08F7AgAAxwIAAEpQ

【1850到2012年间全球陆地海洋表面平均温度变化情况】

地球表面绝大多数被海水覆盖,实际上海水具有比大气更大的热容,也就会比大气吸收更多的能量。报告指出从1971年到2010年四十年间,地表所积累的能量的60%被700米深度以内的上层海水所吸收,30%被700米深度以下的海水所吸收,加在一起海洋存储了90%地表积累的能量。75米深度以内的浅层海水平均温度在1971到2010年间以每个年代0.11摄氏度的温度在上升。对海水温度变化的观测与地表气温变化的观测一致。

另外一个重要的全球变暖指标就是冰川的变化。1971年到2009年间,陆地冰川平均每年损失2260亿吨冰,而在1993年到2009年间,损失速度已经达到平均每年2750亿吨,冰川消融速度在增加。格陵兰和南极的冰盖损失也终于能够估算,其中格陵兰的冰盖损失已经从1992年到2001年的平均每年损失340亿吨增加到了2002年到2011年间的平均每年2150亿吨;而南极冰盖损失也已经从1992到2001年间的平均每年300亿吨增加到了2002年到2011年间的平均每年1470亿吨。

北冰洋的海冰覆盖面积也是一个很明显的指标。1979到2012年间,北冰洋冰层覆盖面积以平均每十年3.5-4.1%的速度减少,或者说每十年损失45到51万平方公里的冰面;而夏季最小冰面面积也在以每十年9.4-13.6%的速度在减少。同样在北半球,春季积雪的覆盖面积也在减少。1967到2010年间,春季积雪覆盖面积平均每十年减少1.6%,六月份积雪面积则平均每十年减少11.7%。北半球北部还观察到了明显地的冻土温度上升,以及冻土层厚度减少。这些都与气候变暖的趋势相吻合。

lbB6XYpW-Dm59vqP68MTBEqTqeuGn0o1A6Opz3ehRiR7AgAAewEAAEpQ

【北极夏季海冰存量变化】

海冰的减少并不会影响海平面位置,但是冰川和冰盖的消融直接对海平面上升作出了贡献,同时海洋温度升高本身带来的热胀冷缩也会导致海平面上升。从1901年到2010年,全球平均海平面上升达到了0.19米,平均每年1.7毫米;而1971年到2010年的海平面平均上升速度是每年2.0毫米,1993年到2010年间速度则达到了平均每年3.2毫米,海平面上升速度在提高,比以前预想的要严重。在数据翔实的1993年到2010年间,海平面上升的程度基本上与估计的冰川消融程度、海水温度升高的程度以及陆地水储存总量相符合,也就是说气候变暖基本上可以解释海平面上升的原因。这也是支持全球变暖的强有力证据。

1QGukSBaPEqc3IIzGNjDNYGVIzvpsPIjEgEe1ALr9517AgAAdAEAAEpQ

【全球平均海平面高度变化】

在观测到全球变暖的同时,大气中的温室气体含量也在继续增加。二氧化碳在大气中的浓度已经比工业化之前高出了40%,同样是温室气体的甲烷浓度已经比工业化之前高出了150%,氮氧化物含量也增加了20%。现在这三种气体在大气中的含量都已经是八十万年以来的最高,并且浓度还在以很快的速度上升,这个上升速度至少在过去的2.2万年的时间里是没出现过的。

89Cf3bUBD0edBQHAQc6F8jTgiUyl6sVD3KnMBgnT93F7AgAAdgEAAEpQ

【大气二氧化碳浓度变化】

这其中化石燃料的使用贡献最大。从1750年到2011年,化石燃料使用以及水泥行业总共排放了3650亿吨碳,同时森林减少以及其它土地用途改变造成的碳排达到1800亿吨。二者加在一起导致人类总量达到5450亿吨的碳排(每吨碳排折合3.67吨二氧化碳),可以肯定观察到的大气二氧化碳浓度迅速增高是人类活动造成的。现在土地变更造成的碳排比例已经显著降低,2002至2011年十年间,化石燃料燃烧造成的二氧化碳排放平均是每年95亿吨碳,土地用途的变化每年平均仅贡献9亿吨碳排。人类活动排放的二氧化碳并没有完全留在大气。地表的生态系统吸收了1500亿吨碳,大气保留了2400亿吨,其余的1550亿吨碳被海洋吸收。海洋在缓解大气中二氧化碳浓度做出贡献的同时也开始酸化,pH值已经平均下降了0.1。这个数字看起来很小,但是换一个说法,海水中氢离子浓度已经增加了26%,大约就能看出严重性了。

温室气体会造成地表温度上升是有充分科学依据的,不过影响气候的主要因素还有几个,要研究造成全球变暖的原因,就需要比较各种不同因素做出的贡献。这些因素对气候的影响程度使用一个叫做“辐射强迫”的指标来衡量,正的辐射强迫就会导致地表温度增加,负的责代表会导致地表温度降低。在人类活动有能力影响气候之前,主导气候变化的一直是大自然。大自然影响气候的方式主要是两个,一个是太阳自身的辐射的变化,一个是火山喷发。太阳的辐射一直不是一成不变的,历史上的太阳辐射变化可以通过各种方式去寻找痕迹,而现代太阳的辐射变化则可以通过卫星监测。1978年开始的卫星监测的太阳辐射数据显示最后的一个太阳极小值要比前两个低,2008年的极小值与1986年的极小值相比,辐射强迫为-0.04W/m2,太阳辐射再最近三十年有一个轻微的减弱。工业化以来,太阳的辐射变化造成的辐射强迫为0.05W/m2,对升温略有贡献。大规模的火山喷发也会短期对气候造成影响。火山喷发释放的颗粒物进入大气后能够反照太阳辐射,从而减少到达地面的辐射,所以火山喷发之后的一段时间会产生一个负的辐射强迫,时间长短取决于火山的喷发程度。总的来说,在上一个世纪,自然本身仅仅贡献了一个很小的辐射强迫,在这个期间内,平均下来对气候的贡献不大。定量的估算为,自然导致的影响在温升-0.1度到0.1度之间,与现在观察到的实际温升情况相差甚远。

那么就需要在人类活动上面找原因了。工业化以来大气温室气体浓度增高所造成的辐射强迫增加达到了3W/m2,二氧化碳排放一项就达到了1.68W/m2。不过人类活动不仅仅增加温室气体排放,各种工业污染排放的颗粒物是有能力降低地表温度的。人类活动排放的气溶胶,加上炭黑,考虑的云的影响之后,贡献了-0.9W/m2的辐射强迫。综合下来,与1750年相比,2011年人类活动造成的辐射强迫达到2.29W/m2,这个数值在1970年以后增长迅速,甚至与2005年估算的数值相比,2011年估算的辐射强迫也增加了43%。与此同时,目前所观测到的气候变化的形式,表现出来的一些具体特征,也与人类活动对气候产生影响的形式和特征相符合。综合下来温室气体浓度变化导致1951-2010年期间平均气温增高0.5-1.3度,其他的人类影响则产生了-0.6到0.1度之间的变化,而自然导致的影响在-0.1至0.1度之间,基本上可以解释这个期间的温升情况。所以这次评估报告下结论说,人类活动对气候的影响已经很清晰,也有了95%以上的把握认为人类活动是造成气候变化的主要原因。

IPCC第一工作组也对未来气候变化的趋势做出了预测。预估显示如果太阳辐射没有显著变化,没有大的火山喷发这些会显著影响气候的自然因素,与1986年到2005年的平均气温相比,2016到2035年的平均气温会高出0.3-0.7摄氏度,升温的趋势仍然会继续。

更加远期的预估就会受到人类发展各种因素的影响,IPCC根据经济和政策的不同状况推出了四个未来情景来进行预估,这里面有大幅度减排,使得温室气体排放在21世纪中期达到顶点然后下降的RCP2.6情景,也有对温室气体完全没有控制的RCP8.5情景。不过无论什么样的情景,大气中的温室气体浓度在21世纪仍然会继续上升,气候变暖的大趋势也不会改变,只是程度不同。到本世纪末的2081-2100年,碳减排力度最大的RCP2.6模式也会导致相对1986-2005年平均的0.3-1.7摄氏度的温升,不进行减排的模式则会导致2.6-4.8摄氏度的温升,21世纪的全球变暖程度非常可能超过1.5度,比20世纪的温升幅度要高出不少。

_BVpc9ajZ8r15XkwiU3qckYr42TOQ0LS9Ydl4bGud9Z7AgAAKgEAAEpQ

【全球平均表面温度变化】

温升会导致极端气候发生的频率强度增加,北冰洋冰面继续萎缩,陆地冰川和冰盖继续消融,而海平面的上升速度也会加快。减排强度最大的预估情景中,到21世纪末,海平面也要比20世纪末升高0.26-0.55米,而对于没有减排的情景,海平面则会在21世纪升高0.45-0.82米。到那个时候,海岸线会与现在非常不同。

hCXNXzUp01R3Nib7SovZ-2RI77UWWGjv4R_IjiA0sKh7AgAA9AEAAEpQ

【全球平均海平面上升】

关于本文

题图出处:globalwarming2009.blogspot.com

所有插图都来自联合国政府间气候变化专门委员会第五次评估报告第一工作组决策者摘要

本文已经发表于果壳网《IPCC:气候变化要比原来认识到的更加严重

扩展阅读

关于IPCC和气候变化的文章汇总

11 Aug 09:58

《天文学进展》参考文献样式

by gerry
directus

good!

最近往《天文学进展》投了一篇综述,发现官方LaTeX模版没有BibTeX样式文件。我又没忍住……于是用makebst生成了一个bst文件,然后根据要求做了一些调整。论文、书籍和会议文集应该都没什么问题,arXiv文章则需要自己改bib文件。
需要注意的是,在目前的官方模版下使用这个bst文件,需要注释掉cls文件的第476行。

%\bibliographystyle{plain}

完整的样例文件点此下载。编码为GBK,在TeXLive 2012下用latex+dvipdfmx编译通过。

更新:

2013-12-08:版本更新为0.3。由于makebst 缺乏对中文引用来源的处理,我于是在上海财经大学吴凯分享的GBT7714-2005规范bst基础上,参考《天文学进展》参考文献著录格式重新修改,可满足绝大多数要求。遵照《中国科学院自然科学期刊编排格式规范》的期刊也可借用。

04 Aug 03:19

The New Old Reader

directus

good!

image

We’re pleased to announce that The Old Reader will officially remain open to the public! The application now has a bigger team, significantly more resources, and a new corporate entity in the United States. We’re incredibly excited to be a part of this great web application and would like to share some details about its future as well as thank you for remaining loyal users. We’re big fans and users of The Old Reader and look forward to helping it grow and improve for years to come.

First off we want to say that it’s rare to have an application that inspires as much passion as The Old Reader has as of late. We think that’s a sign of greatness and all credit for that goes to the wonderful team that has been running the show including Dmitry and Elena. We’ve gotten to know them pretty well this past week and they are smart, honest, and passionate people. We’re happy to announce that they are still a part of the team and we hope they will be for a long time to come.  The new team will be managing the project and adding to the engineering, communications, and system administration functions.

So now for the future. The Old Reader is going to retain all of its functionality and remain open to the public. Not only that, we’re going to do everything in our power to grow the user base which will only accentuate the things that make this application special. To facilitate these improvements, we’re going to be transitioning The Old Reader to a top tier hosting facility in the United States this coming week. It’s going to require some downtime and for that we sincerely apologize, but it’s also going to mean A LOT more servers, 10x faster networks, and long-term stability. We realize that doesn’t make the downtime easy but rest assured that things are looking up.

Over the coming weeks we’ll talk more about the new team of The Old Reader. We’re looking forward to introducing ourselves and making significant improvements to this incredible application. Thanks for reading and thanks for using The Old Reader!

26 Jul 06:16

The Starburst-Driven Molecular Wind in NGC 253 and the Suppression of Star Formation. (arXiv:1307.6259v2 [astro-ph.CO] UPDATED)

Authors: Alberto D. Bolatto, Steven R. Warren, Adam K. Leroy, Fabian Walter, Sylvain Veilleux, Eve C. Ostriker, Jürgen Ott, Martin Zwaan, David B. Fisher, Axel Weiss, Erik Rosolowsky, Jacqueline Hodge

The under-abundance of very massive galaxies in the universe is frequently attributed to the effect of galactic winds. Although ionized galactic winds are readily observable most of the expelled mass is likely in cooler atomic and molecular phases. Expanding molecular shells observed in starburst systems such as NGC 253 and M 82 may facilitate the entrainment of molecular gas in the wind. While shell properties are well constrained, determining the amount of outflowing gas emerging from such shells and the connection between this gas and the ionized wind requires spatial resolution <100 pc coupled with sensitivity to a wide range of spatial scales, hitherto not available. Here we report observations of NGC 253, a nearby starburst galaxy (D~3.4 Mpc) known to possess a wind, which trace the cool molecular wind at 50 pc resolution. At this resolution the extraplanar molecular gas closely tracks the H{\alpha} filaments, and it appears connected to molecular expanding shells located in the starburst region. These observations allow us to directly measure the molecular outflow rate to be > 3 Msun/yr and likely ~9 Msun/yr. This implies a ratio of mass-outflow rate to star formation rate of at least {\eta}~1-3, establishing the importance of the starburst-driven wind in limiting the star formation activity and the final stellar content.

12 Jul 16:43

Resolved Giant Molecular Clouds in Nearby Spiral Galaxies: Insights from the CANON CO (1-0) Survey

by Jennifer Donovan Meyer, Jin Koda, Rieko Momose, Thomas Mooney, Fumi Egusa, Misty Carty, Robert Kennicutt, Nario Kuno, David Rebolledo, Tsuyoshi Sawada, Nick Scoville, and Tony Wong
We resolve 182 individual giant molecular clouds (GMCs) larger than 2.5 × 10 5 M ☉ in the inner disks of 5 large nearby spiral galaxies (NGC 2403, NGC 3031, NGC 4736, NGC 4826, and NGC 6946) to create the largest such sample of extragalactic GMCs within galaxies analogous to the Milky Way. Using a conservatively chosen sample of GMCs most likely to adhere to the virial assumption, we measure cloud sizes, velocity dispersions, and 12 CO ( J = 1-0) luminosities and calculate cloud virial masses. The average conversion factor from CO flux to H 2 mass (or X CO ) for each galaxy is 1-2 × 10 20 cm –2 (K km s –1 ) –1 , all within a factor of two of the Milky Way disk value (~2 × 10 20 cm –2 (K km s –1 ) –1 ). We find GMCs to be generally consistent within our errors between the galaxies and with Milky Way disk GMCs; the intrinsic scatter bet...
10 Jul 07:47

How to read a scientific paper

by John Asher Johnson
directus

mark

Here are some very handy instructions on how to read a scientific paper, which I give to all of my undergrads and first-year students:

http://www.biochem.arizona.edu/classes/bioc568/papers.htm

Technically, it's written for biology students, but it works equally well for astronomy/physics students. The topics covered include:

1. How are papers organized?

2. How do I prepare to read a paper, particularly in an area not so familiar to me?

3. What difficulties can I expect?

4. How do I understand and evaluate the contents of the paper?

10 Jul 07:39

Star Formation and Gas Kinematics of Quasar Host Galaxies at z~6: New insights from ALMA. (arXiv:1302.4154v2 [astro-ph.CO] UPDATED)

directus

ALMA, QSO, high-z

Authors: Ran Wang, Jeff Wagg, Chris L. Carilli, Fabian Walter, Lindley Lentati, Xiaohui Fan, Dominik A. Riechers, Frank Bertoldi, Desika Narayanan, Michael A. Strauss, Pierre Cox, Alain Omont, Karl M. Menten, Kirsten K. Knudsen, Roberto Neri, Linhua Jiang

We present ALMA observations of the [C II] 158 micron fine structure line and dust continuum emission from the host galaxies of five redshift 6 quasars. We also report complementary observations of 250 GHz dust continuum and CO (6-5) line emission from the z=6.00 quasar SDSS J231038.88+185519.7. The ALMA observations were carried out in the extended array at 0.7" resolution. We have detected the line and dust continuum in all five objects. The derived [C II] line luminosities are 1.6x10^{9} to 8.8x10^{9} Lsun and the [C II]-to-FIR luminosity ratios are 3.0-5.6x10^{-4}, which is comparable to the values found in other high-redshift quasar-starburst systems and local ultra-luminous infrared galaxies. The sources are marginally resolved and the intrinsic source sizes (major axis FWHM) are constrained to be 0.3" to 0.6" (i.e., 1.7 to 3.5 kpc) for the [C II] line emission and 0.2" to 0.4" (i.e., 1.2 to 2.3 kpc) for the continuum. These measurements indicate that there is vigorous star formation over the central few kpc in the quasar host galaxies. The ALMA observations also constrain the dynamical properties of the atomic gas in the starburst nuclei. The intensity-weighted velocity maps of three sources show clear velocity gradients. Such velocity gradients are consistent with a rotating, gravitationally bound gas component, although they are not uniquely interpreted as such. Under the simplifying assumption of rotation, the implied dynamical masses within the [C II]-emitting regions are of order 10^{10} to 10^{11} Msun. Given these estimates, the mass ratios between the SMBHs and the spheroidal bulge are an order of magnitude higher than the mean value found in local spheroidal galaxies, which is in agreement with results from previous CO observations of high redshift quasars.

18 Jun 04:55

An Intensely Star-Forming Galaxy at z~7 with Low Dust and Metal Content Revealed by Deep ALMA and HST Observations. (arXiv:1306.3572v2 [astro-ph.CO] UPDATED)

directus

又是日本人!

Authors: Masami Ouchi, Richard Ellis, Yoshiaki Ono, Kouichiro Nakanishi, Kotaro Kohno, Rieko Momose, Yasutaka Kurono, M. L. N. Ashby, Kazuhiro Shimasaku, S. P. Willner, G. G. Fazio, Yoichi Tamura, Daisuke Iono

We report deep ALMA observations complemented with associated HST imaging for a luminous (m_uv=25) galaxy, `Himiko', at a redshift z=6.595. The galaxy is remarkable for its high star formation rate, 100 Mo/yr, securely estimated from our deep HST and Spitzer photometry, and the absence of any evidence for strong AGN activity or gravitational lensing magnification. Our ALMA observations probe an order of magnitude deeper than previous IRAM observations, yet fail to detect a 1.2mm dust continuum, indicating a flux <52uJy comparable with or weaker than that of local dwarf irregulars with much lower star formation rates. We likewise provide a strong upper limit for the flux of [CII] 158um, L([CII]) < 5.4x10^7 Lo, a diagnostic of the hot interstellar gas often described as a valuable probe for early galaxies. In fact, our observations indicate Himiko lies off the local L([CII]) - star formation rate scaling relation by a factor of more than 30. Both aspects of our ALMA observations suggest Himiko is an unique object with a very low dust content and perhaps nearly primordial interstellar gas. Our HST images provide unique insight into the morphology of this remarkable source, highlighting an extremely blue core of activity and two less extreme associated clumps. Himiko is undergoing a triple major merger event whose extensive ionized nebula of Lyman alpha emitting gas, discovered in our earlier work with Subaru, is powered by star formation and the dense circum-galactic gas. We are likely witnessing an early massive galaxy during a key period of its mass assembly close to the end of the reionization era.

17 Jun 02:33

Black hole variability and the star formation-AGN connection: Do all star-forming galaxies host an AGN?. (arXiv:1306.3218v3 [astro-ph.CO] UPDATED)

directus

第二句蛮可疑的,观测到的L_AGN没有考虑消光之类的影响?直接做相关分析可靠么?

Authors: Ryan C. Hickox (Dartmouth), James R. Mullaney, David M. Alexander, Chien-Ting J. Chen, Francesca M. Civano, Andy D. Goulding, Kevin N. Hainline

We investigate the effect of active galactic nucleus (AGN) variability on the observed connection between star formation and black hole accretion in extragalactic surveys. Recent studies have reported relatively weak correlations between observed AGN luminosities and the properties of AGN hosts, which has been interpreted to imply that there is no direct connection between AGN activity and star formation. However, AGNs may be expected to vary significantly on a wide range of timescales (from hours to Myr) that are far shorter than the typical timescale for star formation (>~100 Myr). This variability can have important consequences for observed correlations. We present a simple model in which all star-forming galaxies host an AGN when averaged over ~100 Myr timescales, with long-term average AGN accretion rates that are perfectly correlated with the star formation rate (SFR). We show that reasonable prescriptions for AGN variability reproduce the observed weak correlations between SFR and L_AGN in typical AGN host galaxies, as well as the general trends in the observed AGN luminosity functions, merger fractions, and measurements of the average AGN luminosity as a function of SFR. These results imply there may be a tight connection between AGN activity and SFR over galaxy evolution timescales, and that the apparent similarities in rest-frame colors, merger rates, and clustering of AGNs compared to "inactive" galaxies may be due primarily to AGN variability. The results provide motivation for future deep, wide extragalactic surveys that can measure the distribution of AGN accretion rates as a function of SFR.

25 Mar 05:40

CHAPTER: Definitions of Temperature

by Nathan Sanders
directus

These are the basic notions that I must know!

(updated for 2013)


The term “temperature” describes several different quantities in the ISM, and in observational astronomy. Only under idealized conditions (i.e. thermodynamic equilibrium, the Rayleigh Jeans regime, etc.) are (some of) these temperatures equivalent. For example, in stellar interiors, where the plasma is very well-coupled, a single “temperature” defines each of the following: the velocity distribution, the ionization distribution, the spectrum, and the level populations. In the ISM each of these can be characterized by a different “temperature!”

Brightness Temperature

T_B = the temperature of a blackbody that reproduces a given flux density at a specific frequency, such that

B_\nu(T_B) = \frac{2 h \nu^3}{c^2} \frac{1}{{\rm exp}(h \nu / kT_B) - 1}

Note: units for B_{\nu} are {\rm erg~cm^{-2}~s^{-1}~Hz^{-1}~ster^{-1}}.

This is a fundamental concept in radio astronomy. Note that the above definition assumes that the index of refraction in the medium is exactly 1.

Effective Temperature

T_{\rm eff} (also called T_{\rm rad}, the radiation temperature) is defined by

\int_\nu B_\nu d\nu = \sigma T_{{\rm eff}}^4 ,

which is the integrated intensity of a blackbody of temperature T_{\rm eff}. \sigma = (2 \pi^5 k^4)/(15 c^2 h^3)=5.669 \times 10^{-5} {\rm erg~cm^{-2}~s^{-1}~K^{-4}} is the Stefan-Boltzmann constant.

Color Temperature

T_c is defined by the slope (in log-log space) of an SED. Thus T_c is the temperature of a blackbody that has the same ratio of fluxes at two wavelengths as a given measurement. Note that T_c = T_b = T_{\rm eff} for a perfect blackbody.

Kinetic Temperature

T_k is the temperature that a particle of gas would have if its Maxwell-Boltzmann velocity distribution reproduced the width of a given line profile. It characterizes the random velocity of particles. For a purely thermal gas, the line profile is given by

I(\nu) = I_0~e^{\frac{-(\nu-\nu_{jk})^2}{2\sigma^2}},

where \sigma_{\nu}=\frac{\nu_{jk}}{c}\sqrt{\frac{kT_k}{\mu}} in frequency units, or

\sigma_v=\sqrt{\frac{kT_k}{\mu}} in velocity units.

In the “hot” ISM T_k is characteristic, but when \Delta v_{\rm non-thermal} > \Delta v_{\rm thermal} (where \Delta v are the Doppler full widths at half-maxima [FWHM]) then T_k does not represent the random velocity distribution. Examples include regions dominated by turbulence.

T_k can be different for neutrals, ions, and electrons because each can have a different Maxwellian distribution. For electrons, T_k = T_e, the electron temperature.

Ionization Temperature

T_I is the temperature which, when plugged into the Saha equation, gives the observed ratio of ionization states.

Excitation Temperature

T_{\rm ex} is the temperature which, when plugged into the Boltzmann distribution, gives the observed ratio of two energy states. Thus it is defined by

\frac{n_k}{n_j}=\frac{g_k}{g_j}~e^{-h\nu_{jk}/kT_{\rm ex}}.

Note that in stellar interiors, T_k = T_I = T_{\rm ex} = T_c. In this room, T_k = T_I = T_{\rm ex} \sim 300K, but T_c \sim 6000K.

Spin Temperature

T_s is a special case of T_{\rm ex} for spin-flip transitions. We’ll return to this when we discuss the important 21-cm line of neutral hydrogen.

Bolometric temperature

T_{\rm bol} is the temperature of a blackbody having the same mean frequency as the observed continuum spectrum. For a blackbody, T_{\rm bol} = T_{\rm eff}. This is a useful quantity for young stellar objects (YSOs), which are often heavily obscured in the optical and have infrared excesses due to the presence of a circumstellar disk.

Antenna temperature

T_A is a directly measured quantity (commonly used in radio astronomy) that incorporates radiative transfer and possible losses between the source emitting the radiation and the detector. In the simplest case,

T_A = \eta T_B( 1 - e^{-\tau}),

where \eta is the telescope efficiency (a numerical factor from 0 to 1) and \tau is the optical depth.


Tagged: equilibria, excitation and ionization, photons and radiation, thermal (blackbody) emission, thermodynamics
17 Mar 15:52

高红移 (z~1-3) 恒星形成星系中的分子气体

by chentao yang
directus

check this!

文章:PHIBSS: Molecular Gas content and Scaling Relations in z~1-3 Normal Star Forming Galaxies

  • 文章作者:L. J. Tacconi, R. Neri, R. Genzel, et al.
  • 论文索引:arXiv: 1211.5743
  • 编辑整理:北京师范大学/紫金山天文台  杨辰涛


背景介绍:

bathtub图1 星系演化的“bathtub”模型 (Credit: Bouché)

尽管星系的演化涉及到很多极为复杂的物理化学过程。其中包括星系从晕中吸积气体,巨分子云中的恒星形成,金属随着恒星形成活动的增丰,大质量恒星星风抛射气体,星系中心黑洞吸积气体以及星系中心活动星系核的反馈等等。但在整个宇宙的历史中,星系的一些性质又存在着简洁漂亮的相关关系,比如气体面密度和恒星形成面密度的相关 (Kennicutt-Schmidt Relation,简称 KS Relation),\Sigma_{SFR} \propto \Sigma_{H_2}^N, N=1-1.4 (Bigiel+2011Kennicutt & Evans 2012)。尤其对于恒星形成星系 (Star Forming Galaxies,以下简写为SFGs,可以简单的理解为恒星形成率 (SFR) 高于某个阈值的一类星系,当把所有星系按照恒星质量 – 紫外颜色画在一张图上的时候,你可以看到所有的星系分成两块,一块是偏蓝色且质量较小的星系,我们称为Blue Cloud,另一类颜色偏红且质量较大的,我们称为Red Sequence) ,即落入 Blue Cloud 星系来说,其质量和对应的 SFR 之间存在很好的相关:SFR \propto (M_*)^{\rho}, \rho=0.6-0.9 (Daddi+2007)。 在 SFR-M_* 平面上,落在上述这个相关关系上的星系,我们称之为Main Sequence SFGs (以下简写为 MS SFGs)。近来的观测结果表明,这些恒星形成星系大多属于盘星系 (Wuyts+2011) 。

对于 MS SFGs 来说,我么可以用一个简单的解析模型来描述其主要的特征成份:恒星、气体以及金属丰度。Davé+2012 提出了这样一个模型。其大致原理如上图,即这些 MS SFGs 中的气体可以看作浴缸里的水,而这些气体通过恒星形成,星风等物理过程耗散;同时星系又通过从晕中吸积气体而增加其气体含量;此外通过星风抛射出去被增丰过的气体(因为这些气体经历过恒星形成,金属丰度已有所增加)又可以重新吸积到星系里。这三个过程达到动态平衡,使得我们观测到的星系处在一个动态平衡的状态。其气体含量,恒星质量等等物理量之间具备了一定的相关关系。根据这个动态平衡的特点,人们又把这个模型形象的称为“bathtub”模型这个模型在 Cai Zheng 的 Astroleaks 文章中有详细介绍 (详细查看这里),在这里就不再赘述。


观测,分析和结论:

作者用 EGS survey 中的星系作为母样本,然后挑选出其中具有 DEEP2/KECK(保证星系有光学光谱红移),WFC3/HST J-H-band (HST),3D-HST 以及 DEEP3 覆盖的源。作为红移范围在z=1-1.5的样本。同时作者选取了 Erb+2006 (具有H_{\alpha} 观测的,从紫外巡天样本中挑出的子样本) 中 z~2 的样本。最终,得到了一个总数为55的星系样本。然后通过 PdBI (Plateau de Bure Interferometer) 的观测,直接观测这些星系中的 CO(3-2) 谱线。

images
图2  HST观测的静止波段为 R-band 或者 B-band 的图像以及对应的 CO(3-2) 谱线观测结果

接着我们利用一个分子气体质量的换算系数 (\alpha, conversion factor) ,就可以把观测到的 CO 光度换算成分子气体总质量。同时利用近红外以及 H_{\alpha} 的观测结果,加上分子气体谱线的速度信息,可以得到这些 SFGs 的形态学参数,以及动力学信息。利用光谱拟合的方法,在假设一定的恒星形成历史以及初始质量函数之后,就可以得到星系的总恒星质量,同时 IR+UV 还有 H_{\alpha} 的观测结果可以得到 SFR。最红基于光学和 CO 的图像,经过拟合,还可以得到其半光半径(光度降到1/2处的半径)。

接着作者通过分析上述此样本中的观测得到的物理量,给出了一些有趣的结论:

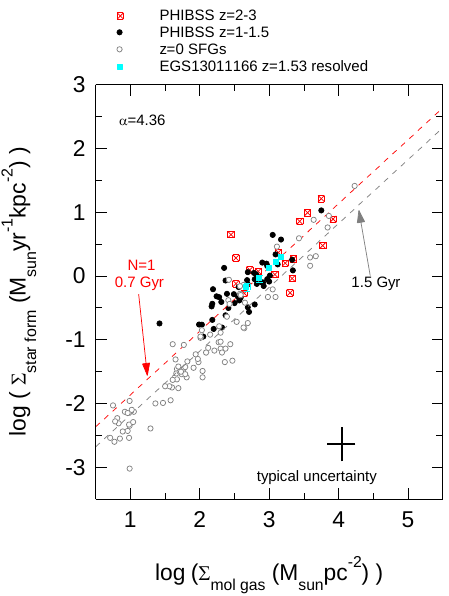
KS-law图 3 PHIBSS样本拟合出来的KS Relation斜率N=1,线性.
  • 星系的气体大小和恒星成分类似。作者通过比较观测到的CO图像的半光半径以及星系 H-band 图像 (对应静止波段为 B-band ) 的半光半径,发现他们近似相等。从统计上来说,所有的样本的比值接近1,在1左右浮动。
  • 通过分析这些气体的动力学信息 (是否有速度梯度)以及光学/近红外的图像 (盘状结构与否),作者得到样本中74%的星系都具有盘状结构,只有14%是并合或者强相互作用星系。说明在 z=1-3 时MS SFGs 主要由旋转的盘星系或者漩涡星系主导,与近邻宇宙 SFGs 的性质类似。
  • 这些 SFGs 具有一个斜率接近1的KS Relation,即 \Sigma_{SFR} \propto \Sigma_{H_2}^{1}。如左图,黑点和红点分别代表z=1-1.5和z=2-2.5的样本。如果我们定义气体的耗散时标为t_{dep}=M_{gas}/SFR,那么可以推论,这些星系具有一个相对固定的耗散时标 t_{dep}~0.7 Gyr 。
  • 另外,作者分析了对于不同星系,在不同情况下 (辐射场强度,星系是否受到引力扰动),他们的 KS relation 是否会收到影响。结果发现具有并合或者强烈相互作用星系都普遍偏离线性关系,分布偏上方,这说明这些系统具有较小的气体耗散时标。从左图可以看到有两条虚线,对应都是取 KS relation 中 N=1的情况,此时t_{dep} 只取决于斜率 N,如果我们画很多 N=1 的平行线,那么越往上的直线对应的 t_{dep} 越小。因此我们说那些偏离直线之上的强相互作用/并合系统具有更小的气体耗散时标。
  • 如果定义气体质量比为 f_{gas}=M_{gas}/(M_{gas}+M_*),那么得到的PHIBSS样本中星系的 f_{gas}~0.4,而对于同等质量的近邻 SFGs 来说,这个值大概是0.08。说明在红移较高的地方 (至少到z~2.5),其 f_{gas} 较大。
  • 另外作者通过”bathtub”的模型,推出气体质量比例 f_{gas}=M_{gas}/(M_{gas}+M_*)。接着可以用一个常数 t_{dep}~0.7 Gyr 拟合得到 f_{gas} 随着sSFR (sSFR=SFR/M_*) 的演化关系。观测拟合的结果表明 sSFR 和f_{gas} 的相关性十分好。

1

图 4 观测得到的sSFR和”bathtub”模型计算的结果吻合

  • 此外,随着星系的恒星总质量的增加,在 \log M_*=10-11.5 的区域内,作者发现 f_{gas} 有一个急剧的下降。这也是被之前观测所证明的。在 z=0 处的SFGs,也有同样的趋势。同时作者发现,利用 Davé+2012 的模型,结合前面观测到的 KS relation,可以很好的从理论给出这个趋势。
  • 最后作者研究了 sSFR 随着红移的演化。结果如右图所示。黑色的数据点是通过模型算出的结果,而红色的点以及灰色的点是直接通过观测得到的结果。不难发现,他们吻合的比较好。这个模型告诉我们,sSFR 随着红移的主要取决于星系的气体贮存量(类似图 1中,澡盆里面的水),也可以说是取决于气体质量和恒星质量的比。而气体的质量又取决于“bathtub”模型中输入气体,排除气体以及回收气体这三个过程之间的动态平衡。

作者通过对红移为 1-3 之间的一个相对较大的 MS SFGs 中 CO(3-2) 谱线的观测,得到了在宇宙恒星形成活动最剧烈的时刻 (z~2-3) 的MS SFGs 的一些基本物理性质。同时用模型计算得到的结果和直接观测量进行比对,验证了“bathtub”模型的有效性。


16 Mar 07:42

Unexpected day: what are we gonna do about Google Reader death? Keep calm and carry on.

directus

I think the OPML import queue is a good strategy for making an update of the server in the meanwhile.

Hello everyone!

This morning I have mixed feelings: I am happy that we have the possibility to bring our beloved The Old Reader to a new level, and I am sad that Google Reader soon will be completely over. It was a large part of my daily internet life. We even started making The Old Reader because no one could stand my whining anymore.

News came unexpected (mind you, we are living in GMT, so it was literally the middle of the night), but we are doing out best. We tripled our user base (and still counting), and our servers are not amused so far. We will be deploying more capacity shortly, so things should get better by the end of the day. Please, be patient with us.

image(The Old Reader’s team before March 13, photo by repor.to/shuvayev)


This is overwhelming. When we started this as something for us and our friends to use, we never expected so many of you to join us in our journey. Thank you very much for your kind words and support, we appreciate this.

Seeing Google Reader go, many of you are asking whether The Old Reader is going to stick around. Also, quite a lot of people would like to donate to keep our project running. We have been discussing this quite a lot recently, and we decided that paid accounts (the freemium model) are the way to go. We want to keep making a great product for our users, not cater it for advertisers’ needs.

We are going to be honest, we have not even started coding this yet. However, we would like to get this news out as soon as possible for everyone to know the way we will be going. Paid accounts will have some additional features, but the basic free accounts will still be 100% usable. We are not in this game to make money, but we want to give something special back to the people who are going to be supporting us.

We have our daily jobs, so we can’t promise that new features will be ready tomorrow or next week. We have no investors or fancy business plans, but we are open about everything we do, and we want to do it the right way.

We reworked the plans according to the news today. Creating an API for mobile clients is the number one priority in our roadmap. We would love to collaborate with any developers who were making Google Reader clients. Please, spread the word about this if you can.

For those of you who are posting feedback and creating new feature requests - please, double-check for existing items in Uservoice. We hate answering the same questions multiple times and removing duplicate requests.

Most asked questions are:
- “When will OPML import be working again?” As soon as we launch more capacity to handle this. Hopefully, later today.
- “Why are you asking for access to my Google contacts when I log in via Google account?” We don’t anymore.
- “When will you make an iOS app? How about Android?” We will start with API as soon as we can and see how it goes.
- “Why is there no way to login without Google or Facebook accounts?” We cover that one in our knowledge base, but we plan to implement own login code. The demand is high.
- “How do I rename a feed?”. Just browse the Tour page, please? 
- “Shut up and take my money!”. Will work on that, stay tuned.

We have lots of things to do, and it will probably take us several days to reply to all emails and tickets. Also, Twitter keeps reminding us about daily tweet limits, so there might be delays as well.

Some other news: last week our developer (on the left) turned 21, and we have implemented PubSubHubbub support. Many of you asked us to make feed updates faster, and PubSubHubbub makes compatible feeds refresh almost instantly. Yay!

Thank you very much for your support. We will do our best during next three months to prepare for the day Google Reader will no longer be around.