Shared posts
Telepíthető az Android 15 Beta 3
Bringing AV1 Streaming to Netflix Members’ TVs
by Liwei Guo, Ashwin Kumar Gopi Valliammal, Raymond Tam, Chris Pham, Agata Opalach, Weibo Ni
AV1 is the first high-efficiency video codec format with a royalty-free license from Alliance of Open Media (AOMedia), made possible by wide-ranging industry commitment of expertise and resources. Netflix is proud to be a founding member of AOMedia and a key contributor to the development of AV1. The specification of AV1 was published in 2018. Since then, we have been working hard to bring AV1 streaming to Netflix members.
In February 2020, Netflix started streaming AV1 to the Android mobile app. The Android launch leveraged the open-source software decoder dav1d built by the VideoLAN, VLC, and FFmpeg communities and sponsored by AOMedia. We were very pleased to see that AV1 streaming improved members’ viewing experience, particularly under challenging network conditions.
While software decoders enable AV1 playback for more powerful devices, a majority of Netflix members enjoy their favorite shows on TVs. AV1 playback on TV platforms relies on hardware solutions, which generally take longer to be deployed.
Throughout 2020 the industry made impressive progress on AV1 hardware solutions. Semiconductor companies announced decoder SoCs for a range of consumer electronics applications. TV manufacturers released TVs ready for AV1 streaming. Netflix has also partnered with YouTube to develop an open-source solution for an AV1 decoder on game consoles that utilizes the additional power of GPUs. It is amazing to witness the rapid growth of the ecosystem in such a short time.
Today we are excited to announce that Netflix has started streaming AV1 to TVs. With this advanced encoding format, we are confident that Netflix can deliver an even more amazing experience to our members. In this techblog, we share some details about our efforts for this launch as well as the benefits we foresee for our members.
Enabling Netflix AV1 Streaming on TVs
Launching a new streaming format on TV platforms is not an easy job. In this section, we list a number of challenges we faced for this launch and share how they have been solved. As you will see, our “highly aligned, loosely coupled” culture played a key role in the success of this cross-functional project. The high alignment guides all teams to work towards the same goals, while the loose coupling keeps each team agile and fast paced.
Challenge 1: What is the best AV1 encoding recipe for Netflix streaming?
AV1 targets a wide range of applications with numerous encoding tools defined in the specification. This leads to unlimited possibilities of encoding recipes and we needed to find the one that works best for Netflix streaming.
Netflix serves movies and TV shows. Production teams spend tremendous effort creating this art, and it is critical that we faithfully preserve the original creative intent when streaming to our members. To achieve this goal, the Encoding Technologies team made the following design decisions about AV1 encoding recipes:
- We always encode at the highest available source resolution and frame rate. For example, for titles where the source is 4K and high frame rate (HFR) such as “Formula 1: Drive to Survive”, we produce AV1 streams in 4K and HFR. This allows us to present the content exactly as creatively envisioned on devices and plans which support such high resolution and frame-rate playback.
- All AV1 streams are encoded with 10 bit-depth even if AV1 Main Profile allows both 8 and 10 bit-depth. Almost all movies and TV shows are delivered to Netflix at 10 or higher bit-depth. Using 10-bit encoding can better preserve the creative intent and reduce the chances of artifacts (e.g., banding).
- Dynamic optimization is used to adapt the recipe at the shot level and intelligently allocate bits. Streams on the Netflix service can easily be watched millions of times, and thus the optimization on the encoding side goes a long way in improving member experience. With dynamic optimization, we allocate more bits to more complex shots to meet Netflix’s high bar of visual quality, while encoding simple shots at the same high quality but with much fewer bits.
Challenge 2: How do we guarantee smooth AV1 playback on TVs?
We have a stream analyzer embedded in our encoding pipeline which ensures that all deployed Netflix AV1 streams are spec-compliant. TVs with an AV1 decoder also need to have decoding capabilities that meet the spec requirement to guarantee smooth playback of AV1 streams.
To evaluate decoder capabilities on these devices, the Encoding Technologies team crafted a set of special certification streams. These streams use the same production encoding recipes so they are representative of production streams, but have the addition of extreme cases to stress test the decoder. For example, some streams have a peak bitrate close to the upper limit allowed by the spec. The Client and UI Engineering team built a certification test with these streams to analyze both the device logs as well as the pictures rendered on the screen. Any issues observed in the test are flagged on a report, and if a gap in the decoding capability was identified, we worked with vendors to bring the decoder up to specification.
Challenge 3: How do we roll out AV1 encoding at Netflix scale?
Video encoding is essentially a search problem — the encoder searches the parameter space allowed by all encoding tools and finds the one that yields the best result. With a larger encoding tool set than previous codecs, it was no surprise that AV1 encoding takes more CPU hours. At the scale that Netflix operates, it is imperative that we use our computational resources efficiently; maximizing the impact of the CPU usage is a key part of AV1 encoding, as is the case with every other codec format.
The Encoding Technologies team took a first stab at this problem by fine-tuning the encoding recipe. To do so, the team evaluated different tools provided by the encoder, with the goal of optimizing the tradeoff between compression efficiency and computational efficiency. With multiple iterations, the team arrived at a recipe that significantly speeds up the encoding with negligible compression efficiency changes.
Besides speeding up the encoder, the total CPU hours could also be reduced if we can use compute resources more efficiently. The Performance Engineering team specializes in optimizing resource utilization at Netflix. Encoding Technologies teamed up with Performance Engineering to analyze the CPU usage pattern of AV1 encoding and based on our findings, Performance Engineering recommended an improved CPU scheduling strategy. This strategy improves encoding throughput by right-sizing jobs based on instance types.
Even with the above improvements, encoding the entire catalog still takes time. One aspect of the Netflix catalog is that not all titles are equally popular. Some titles (e.g., La Casa de Papel) have more viewing than others, and thus AV1 streams of these titles can reach more members. To maximize the impact of AV1 encoding while minimizing associated costs, the Data Science and Engineering team devised a catalog rollout strategy for AV1 that took into consideration title popularity and a number of other factors.
Challenge 4: How do we continuously monitor AV1 streaming?
With this launch, AV1 streaming reaches tens of millions of Netflix members. Having a suite of tools that can provide summarized metrics for these streaming sessions is critical to the success of Netflix AV1 streaming.
The Data Science and Engineering team built a number of dashboards for AV1 streaming, covering a wide range of metrics from streaming quality of experience (“QoE”) to device performance. These dashboards allow us to monitor and analyze trends over time as members stream AV1. Additionally, the Data Science and Engineering team built a dedicated AV1 alerting system which detects early signs of issues in key metrics and automatically sends alerts to teams for further investigation. Given AV1 streaming is at a relatively early stage, these tools help us be extra careful to avoid any negative member experience.
Quality of Experience Improvements
We compared AV1 to other codecs over thousands of Netflix titles, and saw significant compression efficiency improvements from AV1. While the result of this offline analysis was very exciting, what really matters to us is our members’ streaming experience.
To evaluate how the improved compression efficiency from AV1 impacts the quality of experience (QoE) of member streaming, A/B testing was conducted before the launch. Netflix encodes content into multiple formats and selects the best format for a given streaming session by considering factors such as device capabilities and content selection. Therefore, multiple A/B tests were created to compare AV1 with each of the applicable codec formats. In each of these tests, members with eligible TVs were randomly allocated to one of two cells, “control” and “treatment”. Those allocated to the “treatment” cell received AV1 streams while those allocated to the “control” cell received streams of the same codec format as before.
In all of these A/B tests, we observed improvements across many metrics for members in the “treatment” cell, in-line with our expectations:
Higher VMAF scores across the full spectrum of streaming sessions
- VMAF is a video quality metric developed and open-sourced by Netflix, and is highly correlated to visual quality. Being more efficient, AV1 delivers videos with improved visual quality at the same bitrate, and thus higher VMAF scores.
- The improvement is particularly significant among sessions that experience serious network congestion and the lowest visual quality. For these sessions, AV1 streaming improves quality by up to 10 VMAF without impacting the rebuffer rate.
More streaming at the highest resolution
- With higher compression efficiency, the bandwidth needed for streaming is reduced and thus it is easier for playback to reach the highest resolution for that session.
- For 4K eligible sessions, on average, the duration of 4K videos being streamed increased by about 5%.
Fewer noticeable drops in quality during playback
- We want our members to have brilliant playback experiences, and our players are designed to adapt to the changing network conditions. When the current condition cannot sustain the current video quality, our players can switch to a lower bitrate stream to reduce the chance of a playback interruption. Given AV1 consumes less bandwidth for any given quality level, our players are able to sustain the video quality for a longer period of time and do not need to switch to a lower bitrate stream as much as before.
- On some TVs, noticeable drops in quality were reduced by as much as 38%.
Reduced start play delay
- On some TVs, with the reduced bitrate, the player can reach the target buffer level sooner to start the playback.
- On average, we observed a 2% reduction in play delay with AV1 streaming.
Next Steps
Our initial launch includes a number of AV1 capable TVs as well as TVs connected with PS4 Pro. We are working with external partners to enable more and more devices for AV1 streaming. Another exciting direction we are exploring is AV1 with HDR. Again, the teams at Netflix are committed to delivering the best picture quality possible to our members. Stay tuned!
Acknowledgments
This is a collective effort with contributions from many of our colleagues at Netflix. We would like to thank
- Andrey Norkin and Cyril Concolato for providing their insights about AV1 specifications.
- Kyle Swanson for the work on reducing AV1 encoding complexity.
- Anush Moorthy and Aditya Mavlankar for fruitful discussions about encoding recipes.
- Frederic Turmel and his team for managing AV1 certification tests and building tools to automate device verification.
- Susie Xia for helping improve resource utilization of AV1 encoding.
- Client teams for integrating AV1 playback support and optimizing the experience.
- The Partner Engineering team for coordinating with device vendors and investigating playback issues.
- The Media Cloud Engineering team for accommodating the computing resources for the AV1 rollout.
- The Media Content Playback team for providing tools for AV1 rollout management.
- The Data Science and Engineering team for A/B test analysis, and for providing data to help us continuously monitor AV1.

If you are passionate about video technologies and interested in what we are doing at Netflix, come and chat with us! The Encoding Technologies team currently has a number of openings, and we can’t wait to have more stunning engineers joining us.
Senior Software Engineer, Encoding Technologies
Senior Software Engineer, Video & Image Encoding
Senior Software Engineer, Media Systems
Bringing AV1 Streaming to Netflix Members’ TVs was originally published in Netflix TechBlog on Medium, where people are continuing the conversation by highlighting and responding to this story.
Video-Touch: Multi-User Remote Robot Control in Google Meet call by DNN-based Gesture Recognition
A guest post by the Engineering team at Video-Touch
Please note that the information, uses, and applications expressed in the below post are solely those of our guest author, Video-Touch.
A guest post by Video-Touch
You may have watched some science fiction movies where people could control robots with the movements of their bodies. Modern computer vision and robotics approaches allow us to make such an experience real, but no less exciting and incredible.
Inspired by the idea to make remote control and teleoperation practical and accessible during such a hard period of coronavirus, we came up with a VideoTouch project.
Video-Touch is the first robot-human interaction system that allows multi-user control via video calls application (e.g. Google Meet, Zoom, Skype) from anywhere in the world.
Figure 1: The Video-Touch system in action: single user controls a robot during a Video-Touch call. Note the sensors’ feedback when grasping a tube [source video].
We were wondering if it is even possible to control a robot remotely using only your own hands - without any additional devices like gloves or a joystick - not suffering from a significant delay. We decided to use computer vision to recognize movements in real-time and instantly pass them to the robot. Thanks to MediaPipe now it is possible.
Our system looks as follows:
- Video conference application gets a webcam video on the user device and sends it to the robot computer (“server”);
- User webcam video stream is being captured on the robot's computer display via OBS virtual camera tool;
- The recognition module reads user movements and gestures with the help of MediaPipe and sends it to the next module via ZeroMQ;
- The robotic arm and its gripper are being controlled from Python, given the motion capture data.
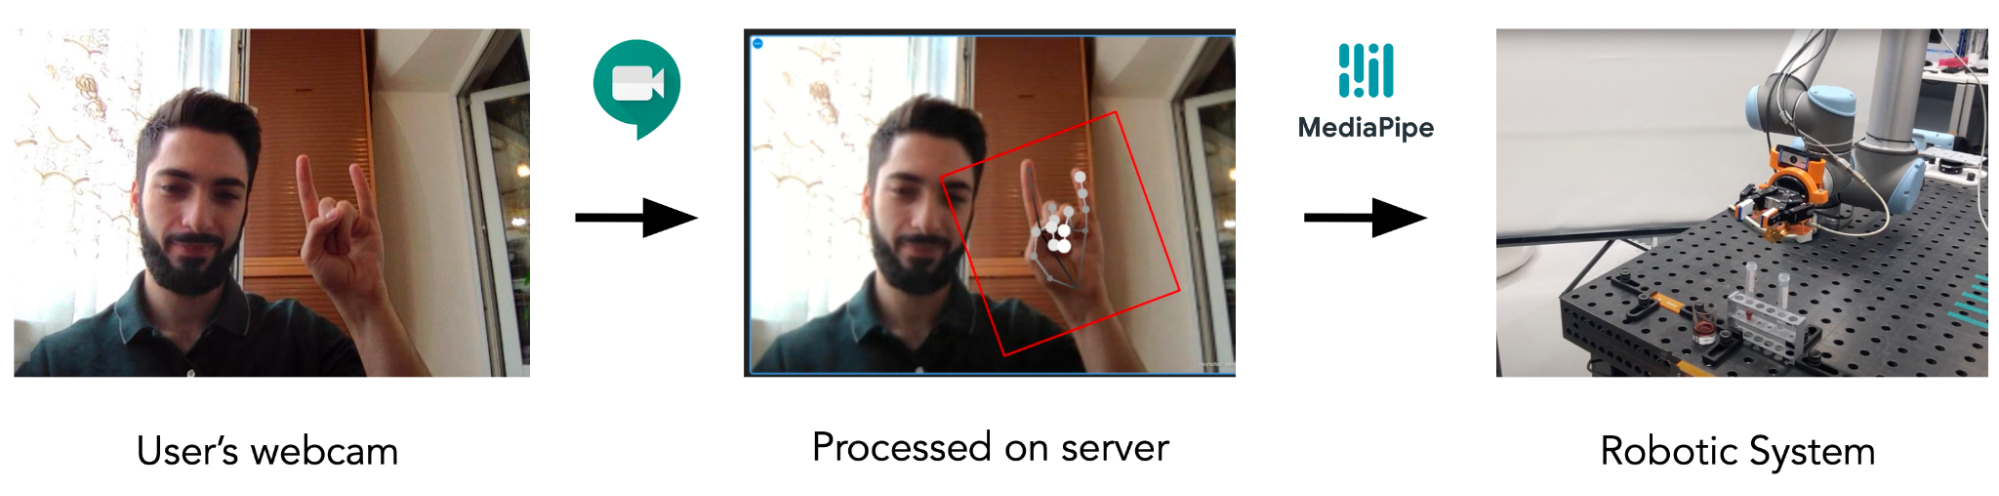
Figure 2: Overall scheme of the Video-Touch system: from users webcam to the robot control module [source video].
As it clearly follows from the scheme, all the user needs to operate a robot is a stable internet connection and a video conferencing app. All the computation, such as screen capture, hand tracking, gesture recognition, and robot control, is being carried on a separate device (just another laptop) connected to the robot via Wi-Fi. Next, we describe each part of the pipeline in detail.
Video stream and screen capture
One can use any software that sends a video from one computer to another. In our experiments, we used the video conference desktop application. A user calls from its device to a computer with a display connected to the robot. Thus it can see the video stream from the user's webcam.
Now we need some mechanism to pass the user's video from the video conference to the Recognition module. We use Open Broadcaster Software (OBS) and its virtual camera tool to capture the open video conference window. We get a virtual camera that now has frames from the users' webcam and its own unique device index that can be further used in the Recognition module.
Recognition module
The role of the Recognition module is to capture a users' movements and pass them to the Robot control module. Here is where the MediaPipe comes in. We searched for the most efficient and precise computer vision software for hand motion capture. We found many exciting solutions, but MediaPipe turned out to be the only suitable tool for such a challenging task - real-time on-device fine-grained hand movement recognition.
We made two key modifications to the MediaPipe Hand Tracking module: added gesture recognition calculator and integrated ZeroMQ message passing mechanism.
At the moment of our previous publication we had two versions of the gesture recognition implementation. The first version is depicted in Figure 3 below and does all the computation inside the Hand Gesture Recognition calculator. The calculator has scaled landmarks as its input, i.e. these landmarks are normalized on the size of the hand bounding box, not on the whole image size. Next it recognizes one of 4 gestures (see also Figure 4): “move”, “angle”, “grab” and “no gesture” (“finger distance” gesture from the paper was an experimental one and was not included in the final demo) and outputs the gesture class name. Despite this version being quite robust and useful, it is based only on simple heuristic rules like: “if this landmark[i].x < landmark[j].x then it is a `move` gesture”, and is failing for some real-life cases like hand rotation.
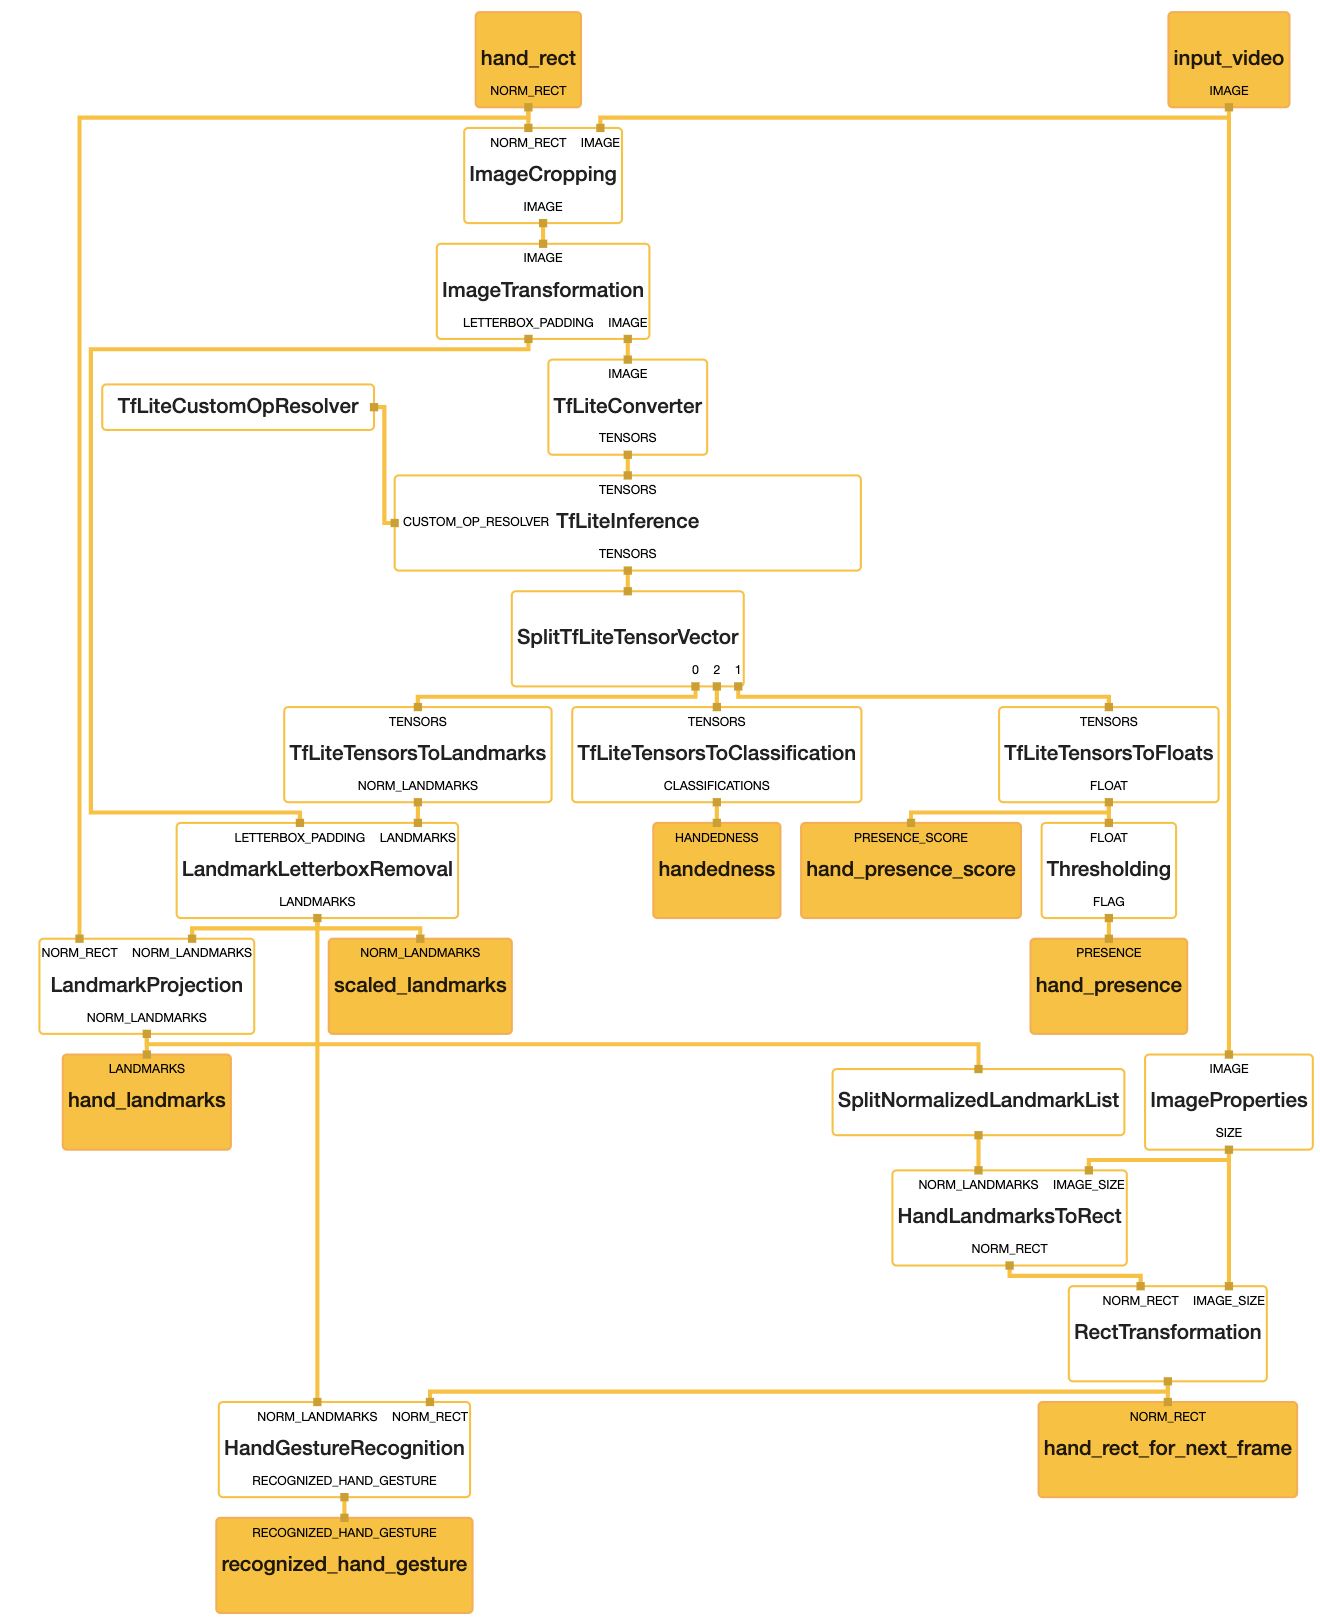
Figure 3: Modified MediaPipe Hand Landmark CPU subgraph. Note the HandGestureRecognition calculator
To alleviate the problem of bad generalization, we implemented the second version. We trained the Gradient Boosting classifier from scikit-learn on a manually collected and labeled dataset of 1000 keypoints: 200 per “move”, “angle” and “grab” classes, and 400 for “no gesture” class. By the way, today such a dataset could be easily obtained using the recently released Jesture AI SDK repo (note: another project of some of our team members).
We used scaled landmarks, angles between joints, and pairwise landmark distances as an input to the model to predict the gesture class. Next, we tried to pass only the scaled landmarks without any angles and distances, and it resulted in similar multi-class accuracy of 91% on a local validation set of 200 keypoints. One more point about this version of gesture classifier is that we were not able to run the scikit-learn model from C++ directly, so we implemented it in Python as a part of the Robot control module.
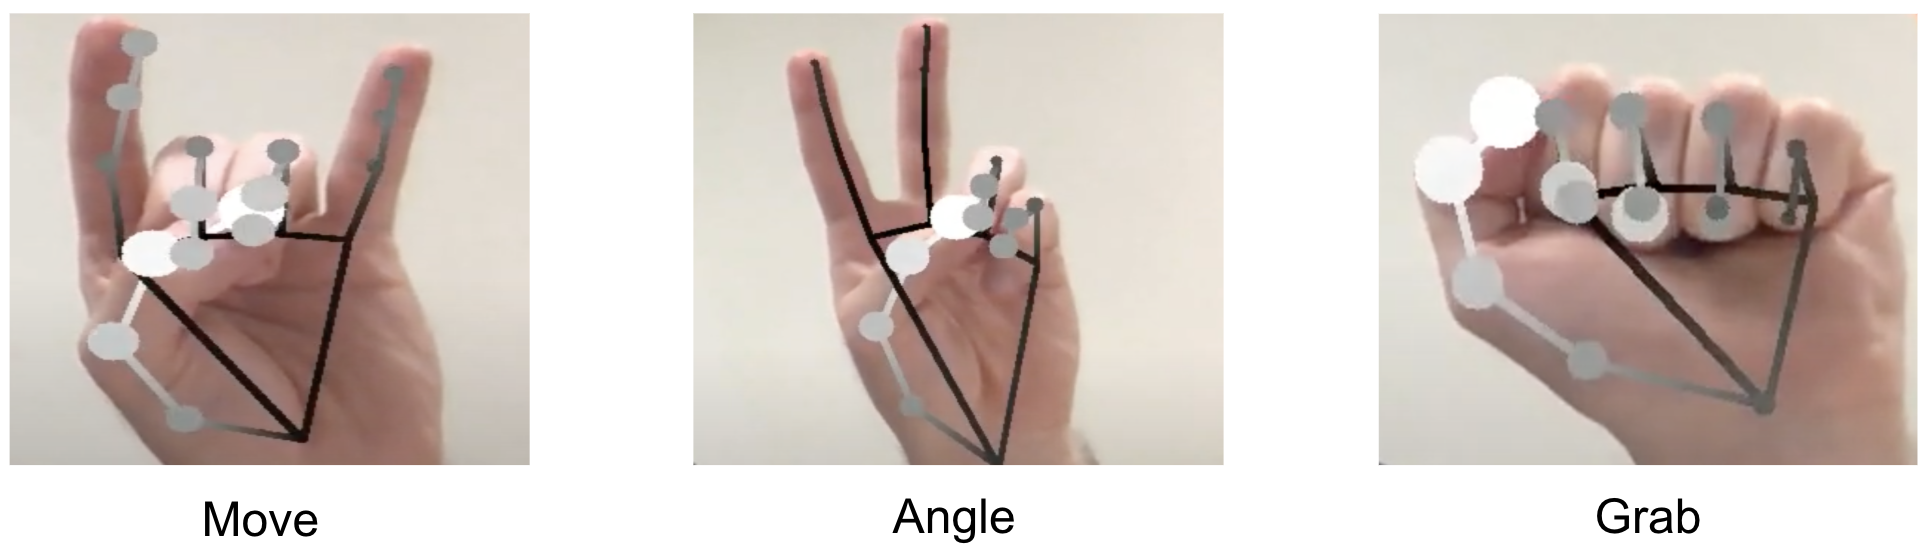
Figure 4: Gesture classes recognized by our model (“no gesture” class is not shown).
Right after the publication, we came up with a fully-connected neural network trained in Keras on just the same dataset as the Gradient Boosting model, and it gave an even better result of 93%. We converted this model to the TensorFlow Lite format, and now we are able to run the gesture recognition ML model right inside the Hand Gesture Recognition calculator.

Figure 5: Fully-connected network for gesture recognition converted to TFLite model format.
When we get the current hand location and current gesture class, we need to pass it to the Robot control module. We do this with the help of the high-performance asynchronous messaging library ZeroMQ. To implement this in C++, we used the libzmq library and the cppzmq headers. We utilized the request-reply scenario: REP (server) in C++ code of the Recognition module and REQ (client) in Python code of the Robot control module.
So using the hand tracking module with our modifications, we are now able to pass the motion capture information to the robot in real-time.
Robot control module
A robot control module is a Python script that takes hand landmarks and gesture class as its input and outputs a robot movement command (on each frame). The script runs on a computer connected to the robot via Wi-Fi. In our experiments we used MSI laptop with the Nvidia GTX 1050 Ti GPU. We tried to run the whole system on Intel Core i7 CPU and it was also real-time with a negligible delay, thanks to the highly optimized MediaPipe compute graph implementation.
We use the 6DoF UR10 robot by Universal Robotics in our current pipeline. Since the gripper we are using is a two-finger one, we do not need a complete mapping of each landmark to the robots’ finger keypoint, but only the location of the hands’ center. Using this center coordinates and python-urx package, we are now able to change the robots’ velocity in a desired direction and orientation: on each frame, we calculate the difference between the current hand center coordinate and the one from the previous frame, which gives us a velocity change vector or angle. Finally, all this mechanism looks very similar to how one would control a robot with a joystick.
Figure 6: Hand-robot control logic follows the idea of a joystick with pre-defined movement directions [source video].
Tactile perception with high-density tactile sensors
Dexterous manipulation requires a high spatial resolution and high-fidelity tactile perception of objects and environments. The newest sensor arrays are well suited for robotic manipulation as they can be easily attached to any robotic end effector and adapted at any contact surface.

Figure 7: High fidelity tactile sensor array: a) Array placement on the gripper. b) Sensor data when the gripper takes a pipette. c) Sensor data when the gripper takes a tube [source publication].
Video-Touch is embedded with a kind of high-density tactile sensor array. They are installed in the two-fingers robotic gripper. One sensor array is attached to each fingertip. A single electrode array can sense a frame area of 5.8 [cm2] with a resolution of 100 points per frame. The sensing frequency equals 120 [Hz]. The range of force detection per point is of 1-9 [N]. Thus, the robot detects the pressure applied to solid or flexible objects grasped by the robotic fingers with a resolution of 200 points (100 points per finger).
The data collected from the sensor arrays are processed and displayed to the user as dynamic finger-contact maps. The pressure sensor arrays allow the user to perceive the grasped object's physical properties such as compliance, hardness, roughness, shape, and orientation.
Figure 8: Multi-user robotic arm control feature. The users are able to perform a COVID-19 test during a regular video call [source video].
Endnotes
Thus by using MediaPipe and a robot we built an effective, multi-user robot teleoperation system. Potential future uses of teleoperation systems include medical testing and experiments in difficult-to-access environments like outer space. Multi-user functionality of the system addresses an actual problem of effective remote collaboration, allowing to work on projects which need manual remote control in a group of several people.
Another nice feature of our pipeline is that one could control the robot using any device with a camera, e.g. a mobile phone. One also could operate another hardware form factor, such as edge devices, mobile robots, or drones instead of a robotic arm. Of course, the current solution has some limitations: latency, the utilization of z-coordinate (depth), and the convenience of the gesture types could be improved. We can’t wait for the updates from the MediaPipe team to try them out, and looking forward to trying new types of the gripper (with fingers), two-hand control, or even a whole-body control (hello, “Real Steel”!).
We hope the post was useful for you and your work. Keep coding and stay healthy. Thank you very much for your attention!
This blog post is curated by Igor Kibalchich, ML Research Product Manager at Google AI
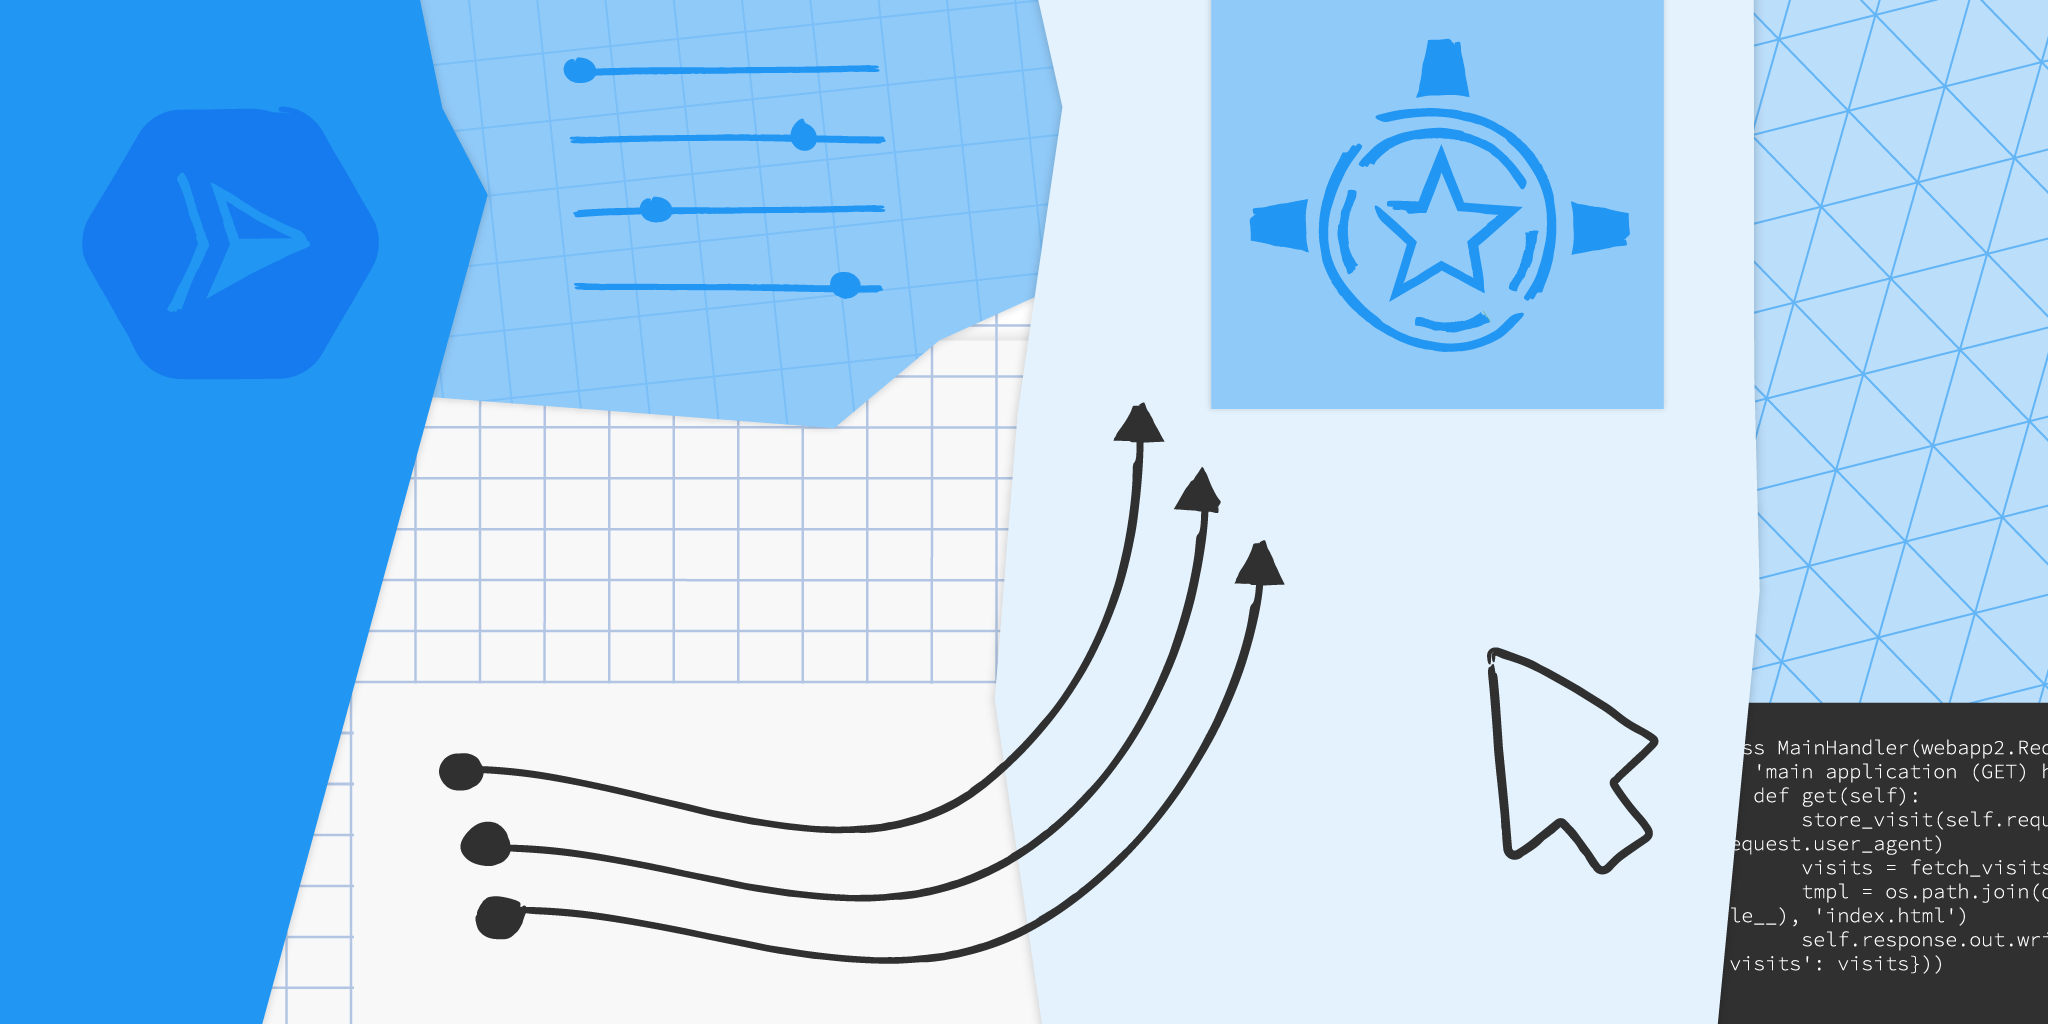
Containerizing Google App Engine apps for Cloud Run
Posted by Wesley Chun (@wescpy), Developer Advocate, Google Cloud
An optional migration
Serverless Migration Station is a video mini-series from Serverless Expeditions focused on helping developers modernize their applications running on a serverless compute platform from Google Cloud. Previous episodes demonstrated how to migrate away from the older, legacy App Engine (standard environment) services to newer Google Cloud standalone equivalents like Cloud Datastore. Today's product crossover episode differs slightly from that by migrating away from App Engine altogether, containerizing those apps for Cloud Run.
There's little question the industry has been moving towards containerization as an application deployment mechanism over the past decade. However, Docker and use of containers weren't available to early App Engine developers until its flexible environment became available years later. Fast forward to today where developers have many more options to choose from, from an increasingly open Google Cloud. Google has expressed long-term support for App Engine, and users do not need to containerize their apps, so this is an optional migration. It is primarily for those who have decided to add containerization to their application deployment strategy and want to explicitly migrate to Cloud Run.
If you're thinking about app containerization, the video covers some of the key reasons why you would consider it: you're not subject to traditional serverless restrictions like development language or use of binaries (flexibility); if your code, dependencies, and container build & deploy steps haven't changed, you can recreate the same image with confidence (reproducibility); your application can be deployed elsewhere or be rolled back to a previous working image if necessary (reusable); and you have plenty more options on where to host your app (portability).
Migration and containerization
Legacy App Engine services are available through a set of proprietary, bundled APIs. As you can surmise, those services are not available on Cloud Run. So if you want to containerize your app for Cloud Run, it must be "ready to go," meaning it has migrated to either Google Cloud standalone equivalents or other third-party alternatives. For example, in a recent episode, we demonstrated how to migrate from App Engine ndb to Cloud NDB for Datastore access.
While we've recently begun to produce videos for such migrations, developers can already access code samples and codelab tutorials leading them through a variety of migrations. In today's video, we have both Python 2 and 3 sample apps that have divested from legacy services, thus ready to containerize for Cloud Run. Python 2 App Engine apps accessing Datastore are most likely to be using Cloud NDB whereas it would be Cloud Datastore for Python 3 users, so this is the starting point for this migration.
Because we're "only" switching execution platforms, there are no changes at all to the application code itself. This entire migration is completely based on changing the apps' configurations from App Engine to Cloud Run. In particular, App Engine artifacts such as app.yaml, appengine_config.py, and the lib folder are not used in Cloud Run and will be removed. A Dockerfile will be implemented to build your container. Apps with more complex configurations in their app.yaml files will likely need an equivalent service.yaml file for Cloud Run — if so, you'll find this app.yaml to service.yaml conversion tool handy. Following best practices means there'll also be a .dockerignore file.
App Engine and Cloud Functions are sourced-based where Google Cloud automatically provides a default HTTP server like gunicorn. Cloud Run is a bit more "DIY" because users have to provide a container image, meaning bundling our own server. In this case, we'll pick gunicorn explicitly, adding it to the top of the existing requirements.txt required packages file(s), as you can see in the screenshot below. Also illustrated is the Dockerfile where gunicorn is started to serve your app as the final step. The only differences for the Python 2 equivalent Dockerfile are: a) require the Cloud NDB package (google-cloud-ndb) instead of Cloud Datastore, and b) start with a Python 2 base image.
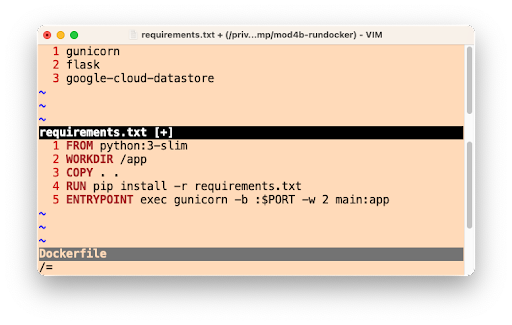
The Python 3 requirements.txt and Dockerfile
Next steps
To walk developers through migrations, we always "START" with a working app then make the necessary updates that culminate in a working "FINISH" app. For this migration, the Python 2 sample app STARTs with the Module 2a code and FINISHes with the Module 4a code. Similarly, the Python 3 app STARTs with the Module 3b code and FINISHes with the Module 4b code. This way, if something goes wrong during your migration, you can always rollback to START, or compare your solution with our FINISH. If you are considering this migration for your own applications, we recommend you try it on a sample app like ours before considering it for yours. A corresponding codelab leading you step-by-step through this exercise is provided in addition to the video which you can use for guidance.
All migration modules, their videos (when published), codelab tutorials, START and FINISH code, etc., can be found in the migration repo. We hope to also one day cover other legacy runtimes like Java 8 so stay tuned. We'll continue with our journey from App Engine to Cloud Run ahead in Module 5 but will do so without explicit knowledge of containers, Docker, or Dockerfiles. Modernizing your development workflow to using containers and best practices like crafting a CI/CD pipeline isn't always straightforward; we hope content like this helps you progress in that direction!
Future-proofing Firefox’s JavaScript Debugger Implementation
Or: The Implementation of the SpiderMonkey Debugger (and its cleanup)
We’ve made major improvements to JavaScript debugging in Firefox DevTools over the past two years. Developer feedback has informed and validated our work on performance, source maps, stepping reliability, pretty printing, and more types of breakpoints. Thank you. If you haven’t tried Firefox for debugging modern JavaScript in a while, now is the time.

Many of the aforementioned efforts focused on the Debugger frontend (written in React and Redux). We were able to make steady progress. The integration with SpiderMonkey, Firefox’s JavaScript engine, was where work went more slowly. To tackle larger features like proper asynchronous call stacks (available now in DevEdition), we needed to do a major cleanup. Here’s how we did that.
Background: A Brief History of the JS Debugger
The JavaScript debugger in Firefox is based on the SpiderMonkey engine’s Debugger API. This API was added in 2011. Since then, it has survived the addition of four JIT compilers, the retirement of two of them, and the addition of a WebAssembly compiler. All that, without needing to make substantial changes to the API’s users. Debugger imposes a performance penalty only temporarily, while the developer is closely observing the debuggee’s execution. As soon as the developer looks away, the program can return to its optimized paths.
A few key decisions (some ours, others imposed by the situation) influenced the Debugger‘s implementation:
- For better or worse, it is a central tenet of Firefox’s architecture that JavaScript code of different privilege levels can share a single heap. Object edges and function calls cross privilege boundaries as needed. SpiderMonkey’s compartments ensure the necessary security checks get performed in this free-wheeling environment. The API must work seamlessly across compartment boundaries.
-
Debuggeris an intra-thread debugging API: events in the debuggee are handled on the same thread that triggered them. This keeps the implementation free of threading concerns, but invites other sorts of complications. -
Debuggers must interact naturally with garbage collection. If an object won’t be missed, it should be possible for the garbage collector to recycle it, whether it’s aDebugger, a debuggee, or otherwise. - A
Debuggershould observe only activity that occurs within the scope of a given set of JavaScript global objects (say, a window or a sandbox). It should have no effect on activity elsewhere in the browser. But it should also be possible for multipleDebuggers to observe the same global, without too much interference.
Garbage Collection
People usually explain garbage collectors by saying that they recycle objects that are “unreachable”, but this is not quite correct. For example, suppose we write:
fetch("https://www.example.com/")
  .then(res => {
    res.body.getReader().closed.then(() => console.log("stream closed!"))
  });
Once we’re done executing this statement, none of the objects it constructed are reachable by the rest of the program. Nonetheless, the WHATWG specification forbids the browser from garbage collecting everything and terminating the fetch. If it were to do so, the message would not be logged to the console, and the user would know the garbage collection had occurred.
Garbage collectors obey an interesting principle: an object may be recycled only if it never would be missed. That is, an object’s memory may be recycled only if doing so would have no observable effect on the program’s future execution—beyond, of course, making more memory available for further use.
The Principle in Action
Consider the following code:
// Create a new JavaScript global object, in its own compartment.
var global = newGlobal({ newCompartment: true });

// Create a new Debugger, and use its `onEnterFrame` hook to report function
// calls in `global`.
new Debugger(global).onEnterFrame = (frame) => {
  if (frame.callee) {
    console.log(`called function ${frame.callee.name}`);
  }
};

global.eval(`
  function f() { }
  function g() { f(); }
  g();
`);
When run in SpiderMonkey’s JavaScript shell (in which Debugger constructor and the newGlobal function are immediately available), this prints:
called function g
called function f
Just as in the fetch example, the new Debugger becomes unreachable by the program as soon as we are done setting its onEnterFrame hook. However, since all future function calls within the scope of global will produce console output, it would be incorrect for the garbage collector to remove the Debugger. Its absence would be observable as soon as global made a function call.
A similar line of reasoning applies for many other Debugger facilities. The onNewScript hook reports the introduction of new code into a debuggee global’s scope, whether by calling eval, loading a <script> element, setting an onclick handler, or the like. Or, setting a breakpoint arranges to call its handler function each time control reaches the designated point in the code. In all these cases, debuggee activity calls functions registered with a Debugger, which can do anything the developer likes, and thus have observable effects.
This case, however, is different:
var global = newGlobal({ newCompartment: true });

new Debugger(global);

global.eval(`
  function f() { }
  function g() { f(); }
  g();
`);
Here, the new Debugger is created, but is dropped without any hooks being set. If this Debugger were disposed of, no one would ever be the wiser. It should be eligible to be recycled by the garbage collector. Going further, in the onEnterFrame example above, if global becomes unnecessary, with no timers or event handlers or pending fetches to run code in it ever again, then global, its Debugger, and its handler function must all be eligible for collection.
The principle is that Debugger objects are not anything special to the GC. They’re simply objects that let us observe the execution of a JavaScript program, and otherwise follow the same rules as everyone else. JavaScript developers appreciate knowing that, if they simply avoid unnecessary entanglements, the system will take care of cleaning up memory for them as soon as it’s safe to do so. And this convenience extends to code using the Debugger API.
The Implementation
Looking through the description above, it seems clear that when a Debugger has an onEnterFrame hook, an onNewScript hook, or something else like that, its debuggee globals hold an owning reference to it. As long as those globals are alive, the Debugger must be retained as well. Clearing all those hooks should remove that owning reference. Thus, the liveness of the global no longer guarantees that the Debugger will survive. (References from elsewhere in the system might, of course.)
And that’s pretty much how it’s done. At the C++ level, each JavaScript global has an associated JS::Realm object, which owns a table of DebuggerLink objects, one for each Debugger of which it is a debuggee. Each DebuggerLink object holds an optional strong reference to its Debugger. This is set when the Debugger has interesting hooks, and cleared otherwise. Hence, whenever the Debugger has hooks set, there is a strong path, via the DebuggerLink intermediary, from its debuggee globals to the Debugger. In contrast, when the hooks are clear, there is no such path.
A breakpoint set in a script behaves similarly. It acts like an owning reference from that script to the breakpoint’s handler function and the Debugger to which it belongs. As long as the script is live, the handler and Debugger must remain alive, too. Or, if the script is recycled, certainly that breakpoint will never be hit again, so the handler might as well go, too. And if all the Debugger‘s breakpoints’ scripts get recycled, then the scripts no longer protect the Debugger from collection.
However, things were not always so straightforward.
What’s Changed
Originally, Debugger objects had an enabled flag, which, when set to false, immediately disabled all the Debugger‘s hooks and breakpoints. The intent was to provide a single point of control. In this way, the Firefox Developer Tools server could neutralize a Debugger (say, when the toolbox is closed), ensuring that it would have no further impact on the system. Of course, simply clearing out the Debugger‘s set of debuggee globals—a capability we needed for other purposes anyway—has almost exactly the same effect. So this meant the enabled flag was redundant. But, we reasoned, how much trouble could a simple boolean flag really cause?
What we did not anticipate was that the presence of the enabled flag made the straightforward implementation described above seem impractical. Should setting enabled to false really go and clear out all the breakpoints in the debuggee’s scripts? And should setting it back to true go and put them all back in? That seemed ridiculous.
So, rather than treating globals and scripts as if they owned references to their interested Debuggers, we added a new phase to the garbage collection process. Once the collector had found as many objects as possible to retain, we would loop over all the Debuggers in the system. We would ask each one: Are any of your debuggees sure to be retained? Do you have any hooks or breakpoints set? And, are you enabled? If so, we marked the Debugger itself for retention.
Naturally, once we decided to retain a Debugger, we alsohad to retain any objects it or its handler functions could possibly use. Thus, we would restart the garbage collection process, let it run to exhaustion a second time, and repeat the scan of all Debuggers.
Cleaning up Garbage Collection
In the fall of 2019, Logan Smyth, Jason Laster, and I undertook a series of debugger cleanups. This code, named Debugger::markIteratively, was one of our targets. We deleted the enabled flag, introduced the owning edges described above (among others), and shrunk Debugger::markIteratively down to the point that it could be safely removed. This work was filed as bug 1592158: “Remove Debugger::hasAnyLiveFrames and its vile henchmen”. (In fact, in a sneak attack, Logan removed it as part of a patch for a blocker, bug 1592116.)
The SpiderMonkey team members responsible for the garbage collector also appreciated our cleanup. It removed a hairy special case from the garbage collector. The replacement is code that looks and behaves much more like everything else in SpiderMonkey. The idea that “this points to that; thus if we’re keeping this, we’d better keep that, too” is the standard path for a garbage collector. And so, this work turned Debugger from a headache into (almost) just another kind of object.
Compartments
The Debugger API presented the garbage collector maintainers with other headaches as well, in its interactions with SpiderMonkey compartments and zones.
In Firefox, the JavaScript heap generally includes a mix of objects from different privilege levels and origins. Chrome objects can refer to content objects, and vice versa. Naturally, Firefox must enforce certain rules on how these objects interact. For example, content code might only be permitted to call certain methods on a chrome object. Or, chrome code might want to see only an object’s original, web-standard-specified methods, regardless of how content has toyed with its prototype or reconfigured its properties.
(Note that Firefox’s ongoing ‘Fission’ project will segregate web content from different origins into different processes, so inter-origin edges will become much less common. But even after Fission, there will still be interaction between chrome and content JavaScript code.)
Runtimes, Zones, and Realms
To implement these checks, to support garbage collection, and to support the web as specified, Firefox divides up the JavaScript world as follows:
- A complete world of JavaScript objects that might interact with each other is called a runtime.
- A runtime’s objects are divided into zones, which are the units of garbage collection. Every garbage collection processes a certain set of zones. Typically there is one zone per browser tab.
- Each zone is divided into compartments, which are units of origin or privilege. All the objects in a given compartment have the same origin and privilege level.
- A compartment is divided into realms, corresponding to JavaScript window objects, or other sorts of global objects like sandboxes or JSMs.
Each script is assigned to a particular realm, depending on how it was loaded. And each object is assigned a realm, depending on the script that creates it.
Scripts and objects may only refer directly to objects in their own compartment. For inter-compartment references, each compartment keeps a collection of specialized proxies, called cross-compartment wrappers. Each of these wrappers represents a specific object in another compartment. These wrappers intercept all property accesses and function calls and apply security checks. This is done to decide whether they should proceed, based on the relative privilege levels and origins of the wrapper’s compartment and its referent’s compartment. Rather than passing or returning an object from one compartment to another, SpiderMonkey looks up that object’s wrapper in the destination compartment (creating it if none exists). Then it hands over the wrapper instead of the object.
Wrapping Compartments
An extensive system of assertions, in the garbage collector but also throughout the rest of SpiderMonkey, verify that no direct inter-compartment edges are ever created. Furthermore, scripts must only directly touch objects in their own compartments.
But since every inter-compartment reference must be intercepted by a wrapper, the compartments’ wrapper tables form a convenient registry of all inter-zone references as well. This is exactly the information that the garbage collector needs to collect one set of zones separately from the rest. If an object has no wrappers representing it in compartments outside its own zone, then the collector knows. All without having to examine the entire runtime. No other zone would miss that object if it were recycled.
Inter-Compartment Debugging
The Debugger API’s Debugger.Object objects throw a wrench into this neat machinery. Since the debugger server is privileged chrome code, and the debuggee is usually content code, these fall into separate compartments. This means that a Debugger.Object‘s pointer to its reference is an inter-compartment reference.
But the Debugger.Objects cannot be cross-compartment wrappers. A compartment may have many Debugger objects, each of which has its own flock of Debugger.Objects, so there may be many Debugger.Objects referring to the same debuggee object in a single compartment. (The same is true of Debugger.Script and other API objects. We’ll focus on Debugger.Object here for simplicity.)
Previously, SpiderMonkey coped with this by requiring that each Debugger.Object be paired with a special entry to the compartment’s wrapper table. The table’s lookup key was not simply a foreign object, but a (Debugger, foreign object) pair. This preserved the invariant that the compartments’ wrapper tables had a record of all inter-compartment references.
Unfortunately, these entries required special treatment. An ordinary cross-compartment wrapper can be dropped if its compartment’s objects no longer point there, since an equivalent wrapper can be constructed on demand. But a Debugger.Object must be retained for as long as its Debugger and referent are alive. A user might place a custom property on a Debugger.Object or use it as a key in a weak map. That user might expect to find the property or weak map entry when encountering the corresponding debuggee object again. Also, special care is required to ensure that the wrapper table entries are reliably created and removed in sync with Debugger.Object creation, even if out-of-memory errors or other interruptions arise.
Cleaning up Compartments
As part of our Fall 2019 code cleanup, we removed the special wrapper table entries. By simply consulting the Debugger API’s own tables of Debugger.Objects, we changed the garbage collector find cross-compartment references. This is Debugger-specific code, which we would, of course, prefer to avoid, but the prior arrangement was also Debugger-specific. The present approach is more direct. It looks more like ordinary garbage collector tracing code. This removes the need for careful synchronization between two tables.
Forced Returns and Exceptions
When SpiderMonkey calls a Debugger API hook to report some sort of activity in the debuggee, most hooks can return a resumption value to say how the debuggee should continue execution:
-
undefinedmeans that the debuggee should proceed normally, as if nothing had happened. - Returning an object of the form
{ throw: EXN }means that the debuggee should proceed as if the valueEXNwere thrown as an exception. - Returning an object of the form
{ return: RETVAL }means that the debuggee should return immediately from whatever function is running now, withRETVALas the return value. -
nullmeans that the debuggee should be terminated, as if by the slow script dialog.
In SpiderMonkey’s C++ code, there was an enumerated type named ResumeMode, which had values Continue, Throw, Return, and Terminate, representing each of these possibilities. Each site in SpiderMonkey that needed to report an event to Debugger and then respect a resumption value needed to have a switch statement for each of these cases. For example, the code in the bytecode interpreter for entering a function call looked like this:
switch (DebugAPI::onEnterFrame(cx, activation.entryFrame())) {
  case ResumeMode::Continue:
    break;
  case ResumeMode::Return:
    if (!ForcedReturn(cx, REGS)) {
      goto error;
    }
    goto successful_return_continuation;
  case ResumeMode::Throw:
  case ResumeMode::Terminate:
    goto error;
  default:
    MOZ_CRASH("bad DebugAPI::onEnterFrame resume mode");
}
Discovering Relevant SpiderMonkey Conventions
However, Logan Smyth noticed that, except for ResumeMode::Return, all of these cases were already covered by SpiderMonkey’s convention for ‘fallible operations’. According to this convention, a C++ function that might fail should accept a JSContext* argument, and return a bool value. If the operation succeeds, it should return true; otherwise, it should return false and set the state of the given JSContext to indicate a thrown exception or a termination.
For example, given that JavaScript objects can be proxies or have getter properties, fetching a property from an object is a fallible operation. So SpiderMonkey’s js::GetProperty function has the signature:
bool js::GetProperty(JSContext* cx,
                     HandleValue v, HandlePropertyName name,
                     MutableHandleValue vp);
The value v is the object, and name is the name of the property we wish to fetch from it. On success, GetProperty stores the value in vp and returns true. On failure, it tells cx what went wrong, and returns false. Code that calls this function might look like:
if (!GetProperty(cx, obj, id, &value)) {
  return false; // propagate failure to our caller
}
All sorts of functions in SpiderMonkey follow this convention. They can be as complex as evaluating a script, or as simple as allocating an object. (Some functions return a nullptr instead of a bool, but the principle is the same.)
This convention subsumes three of the four ResumeMode values:
-
ResumeMode::Continueis equivalent to returningtrue. -
ResumeMode::Throwis equivalent to returningfalseand setting an exception on theJSContext. -
ResumeMode::Terminateis equivalent to returningfalsebut setting no exception on theJSContext.
The only case this doesn’t support is ResumeMode::Return.
Building on SpiderMonkey Conventions
Next, Logan observed that SpiderMonkey is already responsible for reporting all stack frame pops to the DebugAPI::onLeaveFrame function, so that Debugger can call frame onPop handlers and perform other bookkeeping. So, in principle, to force an immediate return, we could:
- stash the desired return value somewhere;
- return
falsewithout setting an exception to force termination; - wait for the termination to propagate through the current function call, at which point SpiderMonkey will call
DebugAPI::onLeaveFrame; - recover our stashed return value, and store it in the right place in the stack frame; and finally
- return
trueas if nothing had happened, emulating an ordinary return.
With this approach, there would be no need for the ResumeMode enum or special handling at DebugAPI call sites. SpiderMonkey’s ordinary rules for raising and propagating exceptions are already very familiar to any SpiderMonkey developer. Those rules do all the work for us.
As it turns out, the machinery for stashing the return value and recognizing the need for intervention in DebugAPI::onLeaveFrame already existed in SpiderMonkey. Shu-Yu Guo had implemented it years ago to handle a rare case involving slow script timeouts and single-stepping.
With this collection of insights, Logan was able to turn the call sites at which SpiderMonkey reports activity to Debugger into call sites just like those of any other fallible function. The call to DebugAPI::onEnterFrame shown above now reads, simply:
if (!DebugAPI::onEnterFrame(cx, activation.entryFrame())) {
  goto error;
}
Other Cleanups
We carried out a number of other minor cleanups as part of our Fall 2019 effort:
- We split the file
js/src/vm/Debugger.cpp, originally 14k lines long and containing the entireDebuggerimplementation, into eight separate source files, and moved them to the directoryjs/src/debugger. Phabricator no longer refuses to colorize the file because of its length. - Each
DebuggerAPI object type,Debugger.Object,Debugger.Frame,Debugger.Environment,Debugger.Script, andDebugger.Source, is now represented by its own C++ subclass ofjs::NativeObject. This lets us use the organizational tools C++ provides to structure and scope their implementation code. We can also replace dynamic type checks in the C++ code with types. The compiler can check those at compile time. - The code that lets
Debugger.ScriptandDebugger.Sourcerefer to both JavaScript and WebAssembly code was simplified so thatDebugger::wrapVariantReferent, rather than requiring five template parameters, requires only one–and one that could be inferred by the C++ compiler, to boot.
I believe this work has resulted in a substantial improvement to the quality of life of engineers who have to deal with Debugger‘s implementation. I hope it is able to continue to serve Firefox effectively in the years to come.
The post Future-proofing Firefox’s JavaScript Debugger Implementation appeared first on Mozilla Hacks - the Web developer blog.


Womp Womp: Amateur Skier Tries To Jump Across Road From One State To Another, Fails
Csomakk:D :D
 Note: Solid F-bomb when the girl filming realizes she probably just recorded somebody die.
This is a video of an amateur skier who tried to build a jump across Beartooth Highway in an attempt to launch himself across the road from Montana into Wyoming. Presumably, due on his shortcoming, he'll have to be buried in Montana.
Note: Solid F-bomb when the girl filming realizes she probably just recorded somebody die.
This is a video of an amateur skier who tried to build a jump across Beartooth Highway in an attempt to launch himself across the road from Montana into Wyoming. Presumably, due on his shortcoming, he'll have to be buried in Montana.
"This was my first and only attempt. However, I did walk away from this crash."Wait -- you walked, or limped away from the crash? Because that looks like a limping situation to me. Do your knees hurt now when it's about to rain? The plate in my arm does that where I broke it. I'm like a bionic weatherman. One who should have his own segment on the local news and pretends like he doesn't realize it when he's drawing giant penises on the weathermap. Keep going for the video.

Ingyenes képzéssel lendítene a felhősödésen a Microsoft
Kicserélte a vezérkart a Twitter

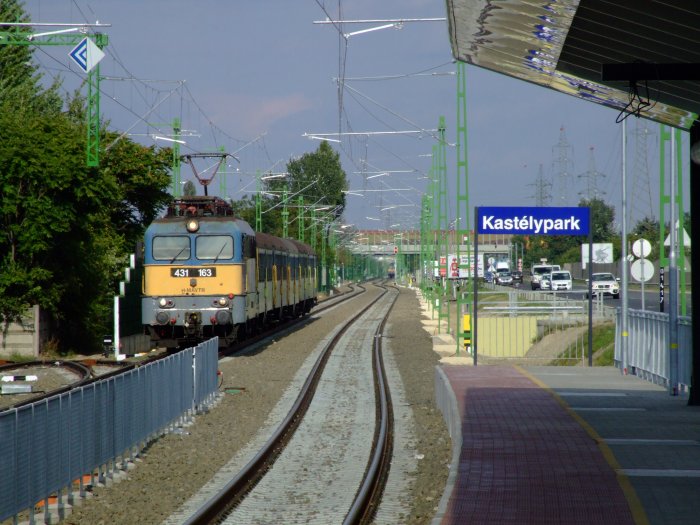
Menetrendváltás '13 - 2. rész: 30a vonal
A 2013/2014-es menetrendváltást felölelő cikksorozatunk második részében az előzőtől egy jellegében eltérő, ám földrajzilag nagyon is közel álló vonalról ejtünk szót/tollat/billentyűzetet..:)
![]()
![]()
![]()
![]()
![]()
![]()

And Merriam-Webster's 2013 Word Of The Year Is....
 Science. Science is the word of the year. How did they choose it? I'm not sure, but probably not out of a hat like my parents named me (my name is L/XL, Made In Indonesia).
...by figuring out which of their most popular words experienced the biggest spike in lookups this year, the editors based in Springfield, Mass., settled on a winner: science. That choice may seem quotidian next to Oxford's buzzworthy selection, selfie, but the editors argue that their word embodies the culture of 2013 in its own way. "Our data shows ... that many of the most looked-up words in the dictionary are words that reflect the big ideas that are lurking behind the headlines," writes Editor-at-Large Peter Sokolowski in a statement. The editors link science, a word users looked up 176% more than last year, to political discussions of climate change and education, as well as Malcolm Gladwell's latest book, criticized as a misrepresentation of science.Well, there you have it. Definitely not what I would have chosen, but definitely not what I WOULDN'T have chosen either. Know what I'm saying? "No clue." Me neither, I'm just glad it wasn't twerking. Thanks to E V I L A R E S, who's so evil he started a petition for 'GW gobbles donkey goobers' to be the word of the year.
Kéz a kézben Milka
Hogyan is lehetne direktebben közeledni mások felé, és új kapcsolatokat létrehozni, mint egy kézfogással: a Milka Argentínában szeretet-automatát állított ki. Működési elve, hogy a Milka tehén lábán található gombot és az automata gombját egyidejűleg kell lenyomni ahhoz, hogy ajándék csokit kapjunk. Mivel a két pont egymástól távol helyezkedik el, ezért társakat kell találni, akikkel kézen fogva megszerezhetjük a nasit. Nehezítésképp a boci (vagyis a Milka tehén) még mozog is, egyre távolabb húzódva az automatától, így előfordulhat, hogy egy kisebb falut kell megkérnünk az összefogásra. Aranyos ötlet.


![]()
![]()
![]()
![]()
![]()
![]()

Books Shoes and Bicycle Shelf
hardactofollow: The Coyote Tango (Pacific Rim...

hardactofollow: The Coyote Tango (Pacific Rim cocktail)
Ingredients:
3/4 oz. Sake
1 1/4 oz. Tequila (preferably Voodoo Tiki Tequila Desert Rose Prickly Pear Infused Tequila)
1 1/4 oz. Lychee juice
Garnish: Lychee nut stuffed with pear
Directions: Add all ingredients to a shaker and shake. Strain into a cocktail glass. Garnish with a lychee nude stuff with pear
A note from the creator:
This East-meets-Southwest drink is perfect for the jaeger that defended Tokyo!
This cocktail was created and photographed by HardActToFollow as part of a series of nine Pacific Rim cocktails. Check them out their Tumblr for the rest.
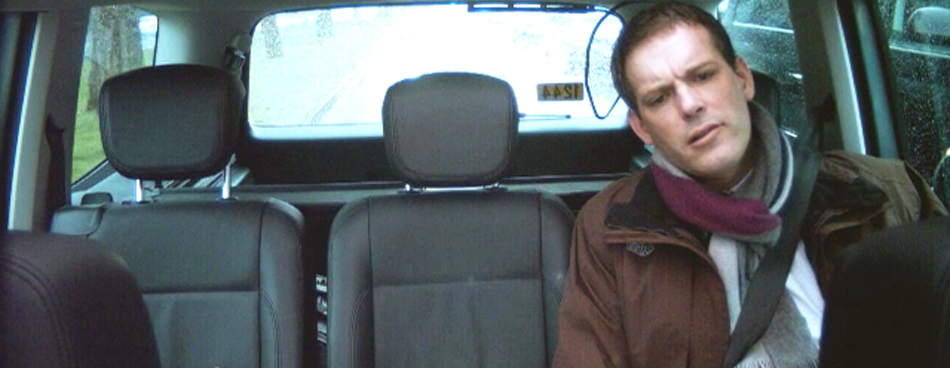
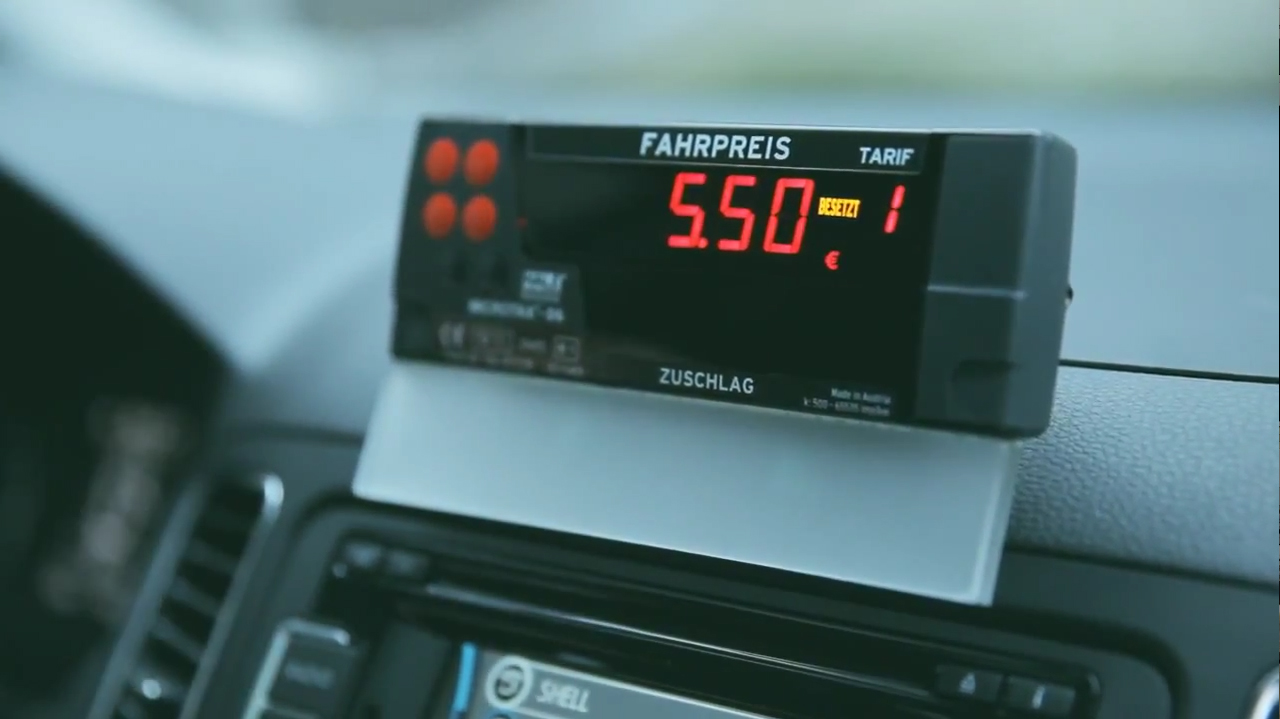
Itt az olcsó taxi!
A Seat fékenergia-visszanyerő rendszerének kampánya. A rendszer lényege, hogy amint a sofőr leveszi a lábát a gázpedálról, a mozgási energia eltárolódik és az akkumulátort kezdi tölteni. Így az akksi kevésbé terheli meg a motort, ami csökkenti a fogyasztást. Jól szemlélteti a folyamatot ez a Seat "ál-taxi", az utasok legnagyobb örömére. Minden egyes fékezés után kevesebbet mutatott ugyanis a taxióra, így az út végén filléreket kellett csak fizetniük a fuvarért...
![]()
![]()
![]()
![]()
![]()
![]()
