Whig Zhou
Shared posts
Friday Ephemera
Bloody Harvest—How Everyone Ignored the Crime of the Century
In June of this year the China Tribunal delivered its Final Judgement and Summary Report.1 An independent committee composed of lawyers, human rights experts, and a transplant surgeon, the Tribunal was established to investigate forced organ harvesting on the Chinese mainland. These rumours have haunted the country for years—lurid tales of the fate suffered by members of the banned Falun Gong religion after being taken into police custody. Their organs, so the rumours go, are cut from their bodies while they are still alive, and then transplanted into waiting patients.
The Tribunal examined these claims, extending the group of victims to include Uyghur Muslims (among others), and its findings were unambiguous. “On the basis of all direct and indirect evidence, the Tribunal concludes with certainty that forced organ harvesting has happened in multiple places in the PRC [People’s Republic of China] and on multiple occasions for a period of at least twenty years and continues to this day.”2 Further to this, “the PRC and its leaders actively incited the persecution, the imprisonment, murder, torture, and the humiliation of Falun Gong practitioners with the sole purpose of eliminating the practice of, and belief in, the value of Falun Gong.”3 The Tribunal was also able to conclude, “with certainty,” that the Communist Party has been responsible for acts of torture inflicted on Uyghurs.4 These acts were found to constitute crimes against humanity.5
The Falun Gong religious group was outlawed in China twenty years ago, with President Jiang Zemin apparently deciding that the group’s expansion was a potential threat to his power—a competitor for the loyalties of the Chinese people. He branded the group an ‘evil cult’. The ensuing imprisonment and disappearance of large numbers of practitioners coincided with an enormous, unexplained provision of transplant hospitals, and a flood of new laboratories. Research into immunosuppressant drugs suddenly accelerated.6 China did not actually have a formal organ donation scheme until 2013, but this has presented no obstacle to the country’s transplant surgeons. They have been charging ahead with an estimated 69,300 transplants per year.7 Even the formal voluntary donors that now exist cannot hope to match this number: in 2017 the total number of eligible donors in the country was a paltry 5,146.8
Throughout most of the world the disparity between donor numbers and patient numbers leads to long waiting lists, but in China it is possible to get a heart transplant within a matter of days,9 and some individuals have been told that they can travel to the mainland on a specific date and immediately receive their transplant.10 In other words, the Chinese authorities know exactly when a particular person is due to die, and they can guarantee that a healthy heart will be found in the to-be-deceased. As stated in the Final Judgement, this “could only occur if there was an available bank of potential living donors who could be sacrificed to order.”11
The Tribunal heard that both Uyghur Muslims and Falun Gong practitioners received regular blood tests in detention. According to the testimony of former prisoner Gulbahar Jelilova, injections were given once every ten days, along with regular ultrasound tests.12 The blood cannot have been taken for the purpose of transfusion, because the quantities were too small. The purpose cannot have been infection control, because blood was only taken from the Falun Gong and Uyghur prisoners, rather than the entire population of each prison. There is, however, another reason that the authorities might need to take blood in this way. Blood testing is essential for organ transplantation, because the procedure involves a danger that the beneficiary’s antibodies will interact with antigens in the donor organs, prompting the body to reject the new organs. As for the ultrasound tests, these were surely carried out to establish the structural appearance and condition of internal organs, and this too is consistent with planned organ transplantation.13
It turns out that the Communist Party is hardly bothering to hide the identity of its human sacrifices. The Tribunal heard recordings of telephone calls made to Chinese hospitals by investigators from the World Organisation to Investigate the Persecution of Falun Gong (WOIPFG). Requests were made, in Mandarin, for organ transplants. When the callers enquired about the sources, most hospital staff were happy to reveal that the organs would be coming from Falun Gong prisoners (all that clean living and qigong exercise is thought to guarantee healthy body parts).14 In their arrogance, the Chinese authorities do not expect serious condemnation. In fact, they are now expanding the project. Human rights investigator Ethan Gutmann provided evidence to the Tribunal in December 2018, stating that “over the last 18 months, literally every Uyghur man, woman, and child – about 15 million people – have been blood and DNA tested, and that blood testing is compatible with tissue matching.”
All Falun Gong practitioners appearing as witnesses before the Tribunal were also able to describe the torture they suffered in detention. While none of these testimonies could be independently verified (for obvious reasons), the level of detail was striking, as were the similarities in the accounts. Prisoners were stripped, beaten, and kept awake for as much as 20 days at a time. Electric batons were used as a matter of course.15 The Final Judgement and Summary Report includes a vivid description of the ordeal of practitioner Jintao Liu: “They shoved faeces into his mouth. They forced a toilet brush handle into his anus. They pushed the handle so hard that he couldn’t defecate… They woke him at night by pouring cold water on him, or by piercing his skin with needles.”16 Women were given pills that stopped their menstrual cycles and caused disorientation, and many of them suffered mental breakdowns.17 Rape was routine: the prisoner Yin Liping told the Tribunal that she was locked in a room with more than forty men of unknown identity in the Masanjia Labour Camp on 19 April 2001, and raped by all of them.18
Incredibly, the Final Judgement has received minimal press coverage, despite the magnitude of the crimes described and the prestige of the Tribunal’s panel. The chair was Sir Geoffrey Nice QC, a barrister for forty-eight years and a judge for thirty-four. This was the man who led the prosecution of Serbian president Slobodan Milošević at the United Nations’ International Criminal Tribunal for the Former Yugoslavia. The panel also included human rights lawyers from the United States, Iran, and Malaysia, and a thoracic transplant specialist of several decades’ standing.
The findings may have been dramatic, but the Tribunal’s approach was every bit as measured and sober as we might expect from a panel of such repute. Members were “alive to the risk of group enthusiasm operating on the minds of witnesses who are Falun Gong supporters.”19 They took care to avoid bias against the CCP, adopting the practice of examining each category of evidence in isolation, with the relevant evidence treated as if it related to an imaginary state with an excellent human rights record.20 Invitations to attend proceedings or to comment or provide evidence were sent out to China’s Ambassador to London, and also to various Chinese transplant physicians, and even Western doctors who have spoken in support of the Chinese regime (none took up the Tribunal’s offer).21 All of this seems like the kind of professionalism we would hope for. Why, then, has the China Tribunal been effectively ignored?
One reason could be that the international community has already made up its mind about this issue. The Transplantation Society and the World Health Organisation (WHO) have both stated that criticism of the Chinese human transplant system is unwarranted,22 and as the Tribunal’s Judgement admits, many separate governments and international organisations have also expressed their doubts concerning the allegations.23 There are exceptions—the governments of Israel, Spain, Italy, and Taiwan have now banned citizens from travelling to China for transplant surgery—but it has been far more common to raise a sceptical eyebrow at the reports.
This doubt may result in part from the movement’s alien ring to Western ears. Falun Gong? What the hell is that? Is it some kind of religion? Practitioners have often tried to insist that they are not a religion, not political, and not an organisation of any kind, but this has simply left open the question of what they are, exactly. The temptation has been to swallow the mainland propaganda, dismissing the group as a cult. Indeed, Gutmann observed the same Western suspicions in the wake of the Communist Party’s original crackdown in 1999: “Congress avoided using Falun Gong practitioners’ testimony in hearings, while the administration concentrated on the human rights of ‘traditional’ Chinese dissidents and the occasional House Christian. Hollywood stuck to the Dalai Lama.”24 If these people have questionable beliefs about the nature of reality, the West seemed to be asking, then why should we trust them about anything at all? But this attitude, says Ethan Gutmann, is like devaluing the currency to zero simply because there are counterfeit bills in circulation.
It is also worth noting that Uyghur Muslims were mentioned in the Tribunal’s Final Judgement. Falun Gong may be a mystery, but Islam should be familiar enough to Western governments. Sir Geoffrey Nice and his colleagues were quite clear that Uyghurs have been the victims of a crime against humanity. Why was the latter detail not picked up in the press? Perhaps it was simply lost in this year’s rush of coverage relating to the Xinjiang concentration camps.
The doubts of the international community may not result solely from a distaste for the Falun Gong. The British government has stated on several occasions that the evidence is insufficient to prove that forced organ harvesting has taken place. These statements might give the impression that the government has already carried out a careful examination of the available material. Indeed, Baroness Goldie and MP Mark Field have both made reference in Parliament to certain ‘analysis’ and ‘assessment’. However, the Tribunal’s requests to the Foreign Office to provide details of this analysis and assessment were always met with silence. It is difficult to escape the suspicion that no such analysis ever took place. This should lead us to ask what reasons the UK government might have to avoid investigating reports of egregious human rights violations.25 As for the WHO, it “operates in a multilateral stakeholder environment and may well be susceptible to political realities,” in the cutting observation of the Tribunal.26
Of course, we could give these governments and organisations the benefit of the doubt, attributing to them nothing more malign than a misguided scepticism. This would still be no excuse. The horror unveiled by the Tribunal was, if anything, a conservative estimate of the scale of the tragedy. The conclusions about organ harvesting related only to the Falun Gong—the Tribunal reached no similar conclusions about the Uyghurs (or House Christians, or Tibetan Buddhists, or Eastern Lightning).27 But testimonies abound, if we care to look for them. A defecting policeman has told Ethan Gutmann that when Uyghur prisoners were taken to be executed, they went with doctors in “special vans for harvesting organs.” Afterwards the bodies were encased in cement and buried in secrecy.28
Gutmann spoke to such doctors—men who had carried out blood tests on Uyghurs just as described in the Tribunal’s Final Judgement and Summary Report. They were able to provide him with the missing details. First, news would arrive that Communist Party officials had checked into a hospital with various organ problems. Staff would begin taking blood from Uyghurs at the prison, and when a corresponding blood type was found, they would move to tissue matching. The chosen prisoners would be shot in the right side of the chest so that death did not occur instantly. Blood types would be matched at the execution site, and soon enough “the officials would get their organs, rise from their beds, and check out.”29
No figures are available for the scale of Uyghur harvesting, but it should be clear that the China Tribunal presented only a small piece of the full tragedy. Indeed, it may never be possible to calculate any of the Chinese harvesting figures with real accuracy. The Falun Gong numbered 70 million when their own crackdown began30 —a small nation—and these millions were scattered in every direction. Some fled overseas in search of asylum, some went underground on the mainland, some renounced their former beliefs, some died in agony on cell floors or in the Party’s many specially-designed torture chambers. And some were harvested. Gutmann puts the latter figure at 65,000 during the early years (2000 to 2008), but arrest records—or records of any kind – are minimal.31 From the very beginning, practitioners were being wheeled into operating theatres in nameless droves.
Throughout 2006 the Falun Gong-run newspaper Epoch Times recorded a series of anecdotes from a single hospital in Sujiatun during those early years. One of these came from an accounting department employee who had become concerned about her husband, a surgeon at the hospital. He had been working strange hours, earning higher wages than normal, and displaying signs of mental breakdown. After nearly a year of this her husband came clean. He told her that there were extra patients hidden away in the subterranean depths of the hospital. The doctors were summoned whenever these special patients arrived, and they were expected to apply anaesthetic before removing the kidneys, skin tissue, corneas, and other organs. Some patients were still alive at the end while others were not, but all of them were quickly sent to the incinerator, after which the hospital staff would pocket rings and watches. Her husband told her that the patients were Falun Gong practitioners, and he said that there was never any need for paperwork.32
The Sujiatun accounts were dismissed by many because US officials from the regional consular office went to have a look for themselves. They found “no evidence that the site is being used for any function than as a normal public hospital.” But as Gutmann points out, “three weeks had elapsed between the publication of the first story in the Epoch Times and the consular visit – an eternity by Chinese construction standards.”33
There is too much of this to ignore. It is not possible, in good conscience, to simply dismiss the allegations. The Tribunal posed a thought experiment to demonstrate this: “Supposing it were said of either the UK or the USA that Muslims were being tortured to death in a prison in Leeds or Philadelphia… (and) that the allegations were entirely untrue although (they had been) made by a perfectly respectable organisation and had attracted attention in government committees in various countries. Would the simple denial be all that the UK or the USA would do on grounds that their word should be enough, and that it would be to honour an impertinence by doing more? Or might they do a great deal more, including… seeking redress from whoever made the totally false but believable allegation, and… throwing open the gates of the prison and offering sight of all records to an appropriate neutral team of observers?”34
The organ harvesting allegations have continued for the best part of two decades, and they show no sign of stopping. A major report was published as early as 2006 by two Canadian human rights attorneys, David Kilgour and David Matas (later expanded into a book, Bloody Harvest: Organ Harvesting of Falun Gong Practitioners in China). The evidence has continued to mount over the years, culminating in the investigations of the China Tribunal, and yet still the doubts persist. In the context of the sheer gravity of the allegations and the extended period over which they have been made, many international organisations and governments now stand condemned along with the Chinese Communist Party.
The evidence points to the crime of the century thus far, and a crime that bears comparison with the worst of the last century. “Victim for victim and death for death, the gassing of the Jews by the Nazis, the massacre by the Khmer Rouge, or the butchery to death of the Rwanda Tutsis may not be worse,” in the Tribunal’s blunt assessment.35 One of the chief culprits for this crime must surely be China’s leader at the time of the Falun Gong crackdown—the psychopathic Jiang Zemin. “Beating them to death is nothing,” Jiang is reported to have said. “If they are disabled from the beating, it counts as them injuring themselves. If they die, it counts as suicide!”36 Equally culpable are his most enthusiastic lieutenants: Bo Xilai, Wang Lijun, Zhou Yongkang.
However, the guilt is also shared by many ordinary individuals: surgeons, officials, prison guards, police. And they know it. “We are all going to hell,” said a Chinese medical director to a policeman who was working with him at the execution grounds, according to the latter’s testimony to Ethan Gutmann.37 Judgement has been delayed for the time being. But these crimes have been well documented by many brave individuals now, and the condemnation of history is inevitable. Eventually children across the world will read in their school textbooks about the Falun Gong Holocaust of the early twenty-first century, and everyone will know the names of the main perpetrators.
Aaron Sarin is a freelance writer living in Sheffield and currently working on a book about the nation-state system, cultural universals, and global governance. He regularly contributes to seceder.co.uk and you can follow him on Twitter @aaron_sarin
Feature photo: Hundreds of supporters of the Chinese Falun Gong movement marched through the Prague centre on September 28, 2018, celebrating the Chinese Mid-Autumn Festival, but also warning of the persecution of the movement in China. Ondrej Deml/CTK Photo/Alamy Live News
References:
1 Independent Tribunal into Forced Organ Harvesting from Prisoners of Conscience in China – Final Judgement and Summary Report, 17 June 2019
2 Ibid., p19
3 Ibid., p35
4 Ibid., p25
5 Ibid., p53
6 Ibid., pp. 14-5
7 Ibid., pp. 30-1
8 Ibid., p45
9 Ibid., p32
10 Ibid., p18
11 Ibid., pp. 32-3
12 Ibid., pp. 24-5
13 Ibid., pp. 19-1
14 Ibid., p27
15 Ibid., pp. 26-7
16 Ibid., p22
17 Ibid., pp. 24-5
18 Ibid., p26
19 Ibid., p7
20 Ibid., p9
21 Ibid., p6
22 Ibid., p37
23 Ibid., p1
24 Ethan Gutmann – The Slaughter: Mass Killings, Organ Harvesting, and China’s Secret Solution to its Dissident Problem (Prometheus Books, New York, 2014), pp. 103-4
25 Final Judgement and Summary Report, op. cit., p38
26 Ibid., p37
27 Ibid., p47
28 Gutmann, op. cit., p23
29 Ibid., p26
30 Ibid., p70
31 Ibid., p279
32 Ibid., p222
33 Ibid., pp. 222-3
34 Final Judgement and Summary Report, op. cit., p41
35 Final Judgement and Summary Report, op. cit., p1
36 Ibid., p13
37 Gutmann, op. cit., p17
The post Bloody Harvest—How Everyone Ignored the Crime of the Century appeared first on Quillette.
Wokeademia spreads
All applicants for tenure track and tenured faculty positions are asked to submit a Statement of Contribution to Diversity, Equity and Inclusion. ...
Examples:
...Explaining how the candidate's research, scholarship or creative activities contribute to understanding the barriers experienced by marginalized groups;
...Committing to public engagement with organizations or community groups serving marginalized populations or extending opportunities to disadvantaged people
In general, strong statements share common attributes; the statement:
...Demonstrates a track record on diversity, equity and inclusion matters throughout candidate's career as a student and educator...
Provides clear and concrete examples of how the candidate might approach the issue articulated at Cornell University.
Awareness/Understanding of Diversity, Equity and Inclusion
Weak
...No indication of efforts to educate self about diversity topics in higher education.
Discounts the importance of diversity.
...Unaware of demographic data about diversity in specific disciplines or in higher education.
Strong
...Sophisticated understanding of differences stemming from ethnic, socioeconomic, racial, gender, disability, sexual orientation, and cultural backgrounds and the obstacles people from these backgrounds face in higher education.
... Provides examples of programs to address climate or underrepresentation.
...Addresses why it’s important for faculty to contribute to meeting the above challenges.
Experience Promoting Diversity, Equity, Inclusion
Weak
May have attended a workshop or read books, but no interest in participating ....You have to be on the team.
Strong
Significant direct experience advancing diversity, equity and inclusion through research, service and teaching. Examples may include advising an organization supporting underrepresented individuals; addressing attendees at a workshop promoting diversity, equity, inclusion; creating and implementing strategies and/or pedagogy to encourage a respectful class environment for underrepresented students; serving on relevant university committee on diversity, equity and inclusion; research on underrepresented communities; active involvement in professional or scientific organization aimed at addressing needs of underrepresented students.
Plans to Advance Diversity, Equity, Inclusion at Cornell
Weak
... Merely says they would do what is asked, if hired.
Strong
Details plans to promote diversity, equity and inclusion through research, service and teaching...
References ongoing efforts at Cornell and ways to improve and modify them to advance diversity, equity and inclusion.
Physiognomy: a field ready for scientific revival
People keep asking me about the state of the art re. evidence for physiognomy, so here’s a brief review.
Phrenology used to be considered legit, and then eventually people realized it was all bogus. Since then, it is usually brought up an example of how science goes wrong in terms of stereotyping, and references to it are used to attack people who don’t agree with Aristotle that the brain is mainly used to cool blood — which is to say, to attack people who study brain size, shape etc. and relate this to differences in human psychology, chiefly intelligence. Some examples of such attacks can be seen here, here and here.
Aside from the political attacks, the skeptical reader might wonder, how does real phrenology look like? Actual phrenology, not strawman. Well, I came across a 1907 book that I shall take an illustrative and perhaps representative of popular phrenology.
- L. A. Vaught, Vaught’s Practical Character Reader, 1902 (1907 revised), Chicago
Some screenshots of pages in the book.
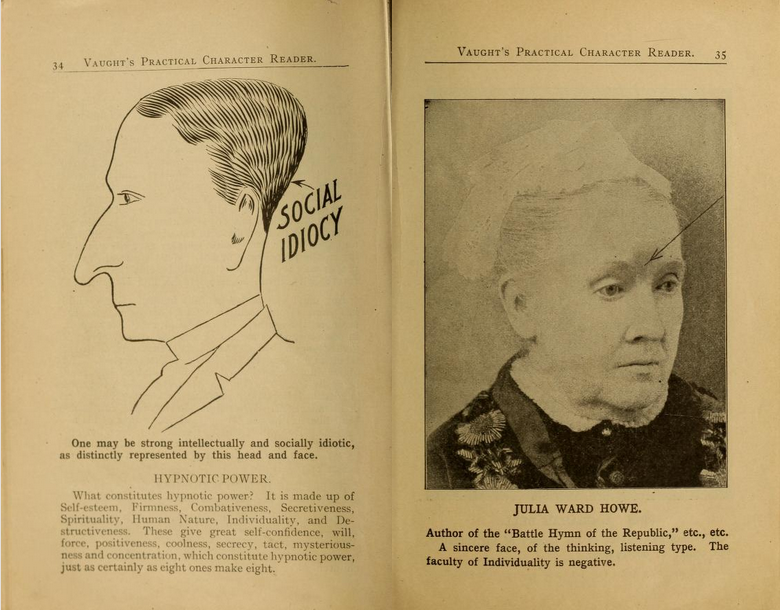
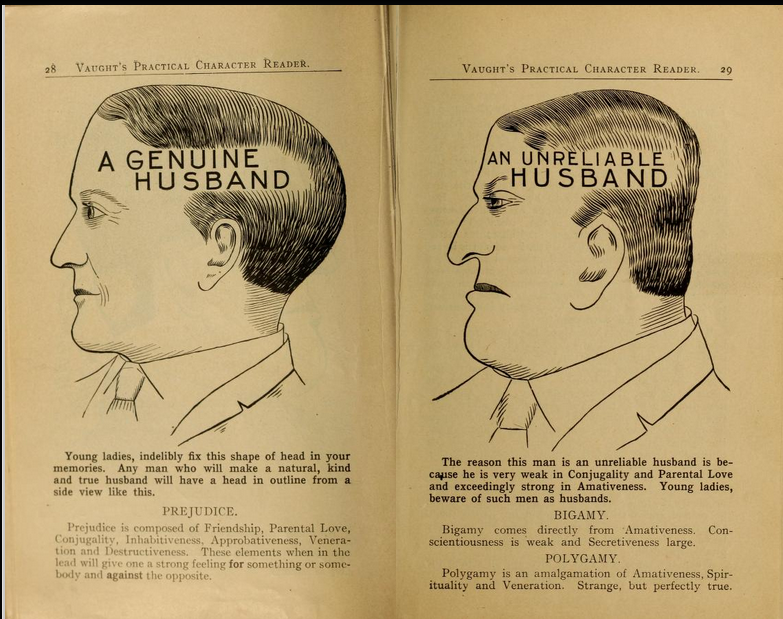


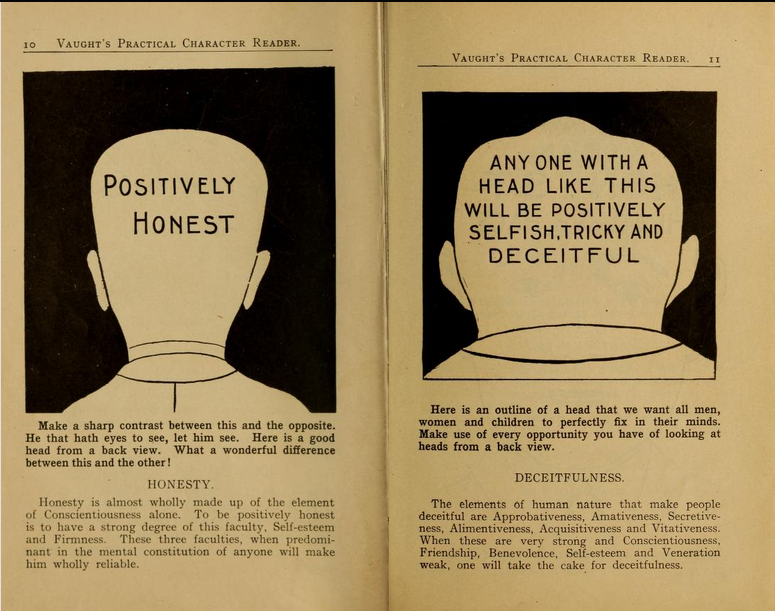

I find these to be hilarious, and it strains the mind to think the author was serious. Perhaps he was selling a bullshit book. But maybe? The past was a different place. Bloodletting was popular for hundreds if not thousands of years but doesn’t work for much of anything (in fact is detrimental). Whatever the case, this is how an actual early 1900s phrenology-physiognomy book looks like.
Modern tests
One can generally split up the science in two parts. One relating features of the brain to psychological differences. The second is relating visible features to psychological differences. The first is now mainstream in science and one can find probably 1000s of papers in mainstream journals publishing papers on this. This development happened in spite of attempts by social justice scholars and Marxists, especially Steven Jay Gould, to mislead the public (reviews of his main attack book are very informative, see here and here). The second is still controversial, but there is growing evidence for it and I expect it to be quite mainstream 20 years from now. The general hypothesis — that facial characteristics relate to character — is quite sensible because we all make judgments of persons based on quite limited information, including pictures (Tinder, politicians on TV, people in bars and so on), making it a reasonable hypothesis that this practice has evolutionary origins because of adaptive value, which is to say, it is useful because it has some accuracy.
Some recent studies include:
-
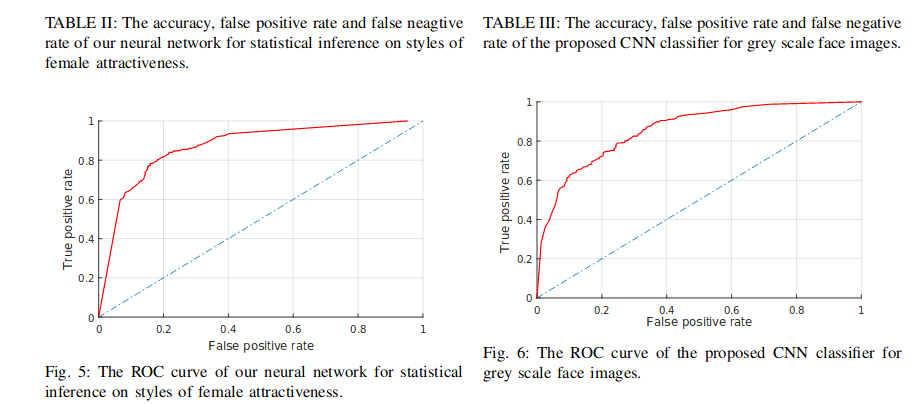
Wu, X., & Zhang, X. (2016). Automated inference on criminality using face images. arXiv preprint arXiv:1611.04135, 4038-4052. Original paper.
We study, for the first time, automated inference on criminality based solely on still face images, which is free of any biases of subjective judgments of human observers.Via supervised machine learning, we build four classifiers(logistic regression, KNN, SVM, CNN) using facial images of 1856 real persons controlled for race, gender, age and facial expressions, nearly half of whom were convicted criminals, for discriminating between criminals and non-criminals. All four classifiers perform consistently well and empirically establish the validity of automated face-induced inference on criminality, despite the historical controversy surrounding this line of enquiry. Also, some discriminating structural features for predicting criminality have been found by machine learning. Above all, the most important discovery of this research is that criminal and non-criminal face images populate two quite distinctive manifolds. The variation among criminal faces is significantly greater than that of the non-criminal faces. The two manifolds consisting of criminal and non-criminal faces appear to be concentric, with the non-criminal manifold lying in the kernel with a smaller span, exhibiting a law of ”normality” for faces of non-criminals. In other words, the faces of general law-biding public have a greater degree of resemblance compared with the faces of criminals, or criminals have a higher degree of dissimilarity in facial appearance than non-criminals.
This paper went viral, and the authors were shamed into publishing an apology of sorts. Still, their introduction is informative:
In all cultures and all periods of recorded human history,people share the belief that the face alone suffices to reveal innate traits of a person. Aristotle in his famous work Prior Analytics asserted, ”It is possible to infer character from features, if it is granted that the body and the soul are changed together by the natural affections”. Psychologists have known, for as long as a millennium, the human tendency of inferring innate traits and social attributes (e.g., the trustworthiness, dominance) of a person from his/her facial appearance, and a robust consensus of individuals’ inferences . These are the facts found through numerous studies [3, 39, 5, 6, 10, 26, 27, 34, 32].
Some of the studies cited above are:
- Willis, J., & Todorov, A. (2006). First impressions: Making up your mind after a 100-ms exposure to a face. Psychological science, 17(7), 592-598.
- Todorov, A., Pakrashi, M., & Oosterhof, N. N. (2009). Evaluating faces on trustworthiness after minimal time exposure. Social Cognition, 27(6), 813-833.
- Borkenau, P., Brecke, S., Möttig, C., & Paelecke, M. (2009). Extraversion is accurately perceived after a 50-ms exposure to a face. Journal of Research in Personality, 43(4), 703-706.
- Todorov, A., Loehr, V., & Oosterhof, N. N. (2010). The obligatory nature of holistic processing of faces in social judgments. Perception, 39(4), 514-532.
These are all pre-replication crisis papers by psychologists looking at evidence for humans being able to determine traits from faces. I didn’t read them closely but they seem to be the typical low power, multi-sample studies, so they are probably not very informative aside from establishing that one can get this kind of thing published and cited in mainstream journals. Of course, we know that anything humans can do by intuitive judgment can be done better by a machine given sufficient training data and the right algorithm. So, are there more recent computer studies that provide strong evidence?
The authors from before have a follow up paper (this time being a bit less blunt!):
- Wu, X., Zhang, X., & Liu, C. (2016). Automated inference on sociopsychological impressions of attractive female faces. arXiv preprint arXiv:1612.04158.
This article is a sequel to our earlier work [25]. The main objective of our research is to explore the potential of supervised machine learning in face-induced social computing and cognition, riding on the momentum of much heralded successes of face processing, analysis and recognition on the tasks of biometric-based identification. We present a case study of automated statistical inference on sociopsychological perceptions of female faces controlled for race, attractiveness, age and nationality. Our empirical evidences point to the possibility of training machine learning algorithms, using example face images characterized by internet users, to predict perceptions of personality traits and demeanors.
Does it work?
But this study was just predicting rated attractiveness of women, so not really a psychological trait. It could however be quite useful for automating dating app usage.
What about sexual orientation? This one has obvious evolutionary relevance for mating purposes, so humans should be somewhat adept at it. There are several studies.
- Wang, Y., & Kosinski, M. (2018). Deep neural networks are more accurate than humans at detecting sexual orientation from facial images. Journal of personality and social psychology, 114(2), 246.
We show that faces contain much more information about sexual orientation than can be perceived or interpreted by the human brain. We used deep neural networks to extract features from 35,326 facial images. These features were entered into a logistic regression aimed at classifying sexual orientation. Given a single facial image, a classifier could correctly distinguish between gay and heterosexual men in 81% of cases, and in 71% of cases for women. Human judges achieved much lower accuracy: 61% for men and 54% for women. The accuracy of the algorithm increased to 91% and 83%, respectively, given five facial images per person. Facial features employed by the classifier included both fixed (e.g., nose shape) and transient facial features (e.g., grooming style). Consistent with the prenatal hormone theory of sexual orientation, gay men and women tended to have gender-atypical facial morphology, expression, and grooming styles. Prediction models aimed at gender alone allowed for detecting gay males with 57% accuracy and gay females with 58% accuracy. Those findings advance our understanding of the origins of sexual orientation and the limits of human perception. Additionally, given that companies and governments are increasingly using computer vision algorithms to detect people’s intimate traits, our findings expose a threat to the privacy and safety of gay men and women.


And there is a pretty close replication.
-
Leuner, J. (2019). A Replication Study: Machine Learning Models Are Capable of Predicting Sexual Orientation From Facial Images. arXiv preprint arXiv:1902.10739.
Recent research used machine learning methods to predict a person’s sexual orientation from their photograph (Wang and Kosinski, 2017). To verify this result, two of these models are replicated, one based on a deep neural network (DNN) and one on facial morphology (FM). Using a new dataset of 20,910 photographs from dating websites, the ability to predict sexual orientation is confirmed (DNN accuracy male 68%, female 77%, FM male 62%, female 72%). To investigate whether facial features such as brightness or predominant colours are predictive of sexual orientation, a new model based on highly blurred facial images was created. This model was also able to predict sexual orientation (male 63%, female 72%). The tested models are invariant to intentional changes to a subject’s makeup, eyewear, facial hair and head pose (angle that the photograph is taken at). It is shown that the head pose is not correlated with sexual orientation. While demonstrating that dating profile images carry rich information about sexual orientation these results leave open the question of how much is determined by facial morphology and how much by differences in grooming, presentation and lifestyle. The advent of new technology that is able to detect sexual orientation in this way may have serious implications for the privacy and safety of gay men and women.

So, like human observers, machines can predict sexual orientation from images.
Moving on to other traits, what about autism?
-
Tan, D. W., Gilani, S. Z., Maybery, M. T., Mian, A., Hunt, A., Walters, M., & Whitehouse, A. J. (2017). Hypermasculinised facial morphology in boys and girls with autism spectrum disorder and its association with symptomatology. Scientific reports, 7(1), 9348.
Elevated prenatal testosterone exposure has been associated with Autism Spectrum Disorder (ASD) and facial masculinity. By employing three-dimensional (3D) photogrammetry, the current study investigated whether prepubescent boys and girls with ASD present increased facial masculinity compared to typically-developing controls. There were two phases to this research. 3D facial images were obtained from a normative sample of 48 boys and 53 girls (3.01–12.44 years old) to determine typical facial masculinity/femininity. The sexually dimorphic features were used to create a continuous ‘gender score’, indexing degree of facial masculinity. Gender scores based on 3D facial images were then compared for 54 autistic and 54 control boys (3.01–12.52 years old), and also for 20 autistic and 60 control girls (4.24–11.78 years). For each sex, increased facial masculinity was observed in the ASD group relative to control group. Further analyses revealed that increased facial masculinity in the ASD group correlated with more social-communication difficulties based on the Social Affect score derived from the Autism Diagnostic Observation Scale-Generic (ADOS-G). There was no association between facial masculinity and the derived Restricted and Repetitive Behaviours score. This is the first study demonstrating facial hypermasculinisation in ASD and its relationship to social-communication difficulties in prepubescent children.
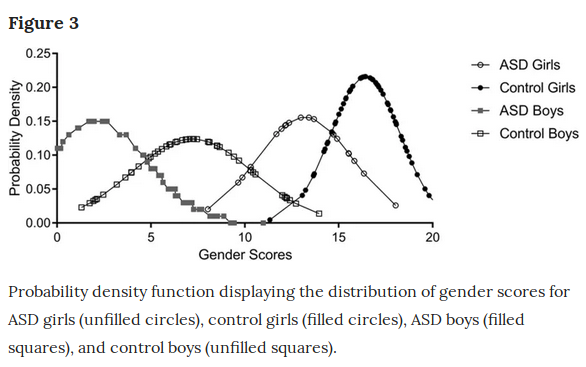
So in plain English: they took photos of non-autistic kids, and trained an algorithm to classify male and female faces. Then they applied this to another sample of autistic kids, and the results you see above: the autistic kids are masculinized compared to their sex norms. The autistic girls are almost halfway towards the normal male distribution! Having dated a number of autistic girls, I was not at all surprised by these results (they also have noticeably more arm hair and deeper voices).
There is even a recent review of face to trait studies:
-
Jia, X., Tian, W., & Fan, Y. (2018, November). Physiognomy in New Era: A Survey of Automatic Personality Prediction Based on Facial Image. In International Conference on Internet of Things as a Service (pp. 12-29). Springer, Cham.
At present, personality computing technology facilitates the understanding, prediction, and management of human behavior. With the increasing importance of faces in personal daily assessments, establishing a relationship between facial morphological features and personality traits is a major breakthrough in personality computing technology. This paper is a survey of such technology of automatic personality prediction based on face and it aims at providing not only a solid knowledge base about the state-of-the-art in automatic personality prediction, but also to provide a conceptual model of automatic personality prediction, based on the literature. In addition, the analysis of the prediction results of the existing researches is emphasized, and there are still problems in the field, such as lack of information on research data, single age group of the sample population, incomplete design characteristics of the artificial design etc., and the potential applications and development directions are determined.
There is also newer research using human subjects. For instance, someone wrote a dissertation on it at Cornell University no less:
-
Royer, C. E. (2018). Convictable Faces: Attributions of Future Criminality from Facial Appearance. Dissertation at Cornell University.
Can participants accurately determine whether someone will later become a criminal based only on the person’s high school yearbook photo? This project builds on previous research which has found participants are capable of accurately and reliably assessing personality characteristics—like trustworthiness and dominance—based only on a photograph. This paper discusses a series of studies which examine whether participants are also capable of making accurate predictions of criminality by utilizing high school yearbook photographs of men with later criminal records. In Study 1, participants were able to make accurate predictions of future criminality from high school yearbook photographs. In Study 2, the results from the previous study were replicated and confidence in criminality attributions was found to predict accuracy. In Study 3, participants were less accurate when judging photographs of Black students compared to White students, suggesting cross-race bias.Altogether, these studies demonstrated that participants have accurate stereotypes about what a person with a criminal record looks like. These stereotypes may create a self-fulfilling prophecy in which people who look criminal are treated like criminals and thus end up with criminal records. This theory was tested in Study 4 in which participants were asked to judge guilt based on mugshots of exonerated men and true criminals. Overall, this serious of studies demonstrated that participants can make accurate and consistent predictions of future criminality based only on facial appearance.
- Sučić, I., Wertag, A., & Juničić, N. (2019). Better the Devil you know than the Devil you don’t: Dark traits and appearance-based inferences. Psihološka istraživanja, 22(1), 89-114.
Every day, people make quick, spontaneous and automatic appearance-based inferences of others. This is particularly true for social attributes, such as intelligence or attractiveness, but also aggression and criminality. There are also indications that certain personality traits, such as the dark traits (i.e. Machiavellianism, narcissism, psychopathy, sadism), influence the degree of accuracy of appearance-based inferences, even though not all authors agree to this. Therefore, this study aims to investigate whether there are interpersonal advantages related to the dark traits when assessing someone’s criminality. For that purpose, an on-line study was conducted on a convenience sample of 676 adult females, whose task was to assess whether a certain person was a criminal or not based on their photograph. The results have shown that narcissism and Machiavellianism were associated with a greater tendency of indicating that someone is a criminal, reflecting an underlying negative bias that the individuals high on these traits hold about people in general.
What about the weird cranium bumps stuff?
There is already a modern study of this.
-
Jones, O. P., Alfaro-Almagro, F., & Jbabdi, S. (2018). An empirical, 21st century evaluation of phrenology. cortex, 106, 26-35.
Phrenology was a nineteenth century endeavour to link personality traits with scalp morphology, which has been both influential and fiercely criticised, not least because of the assumption that scalp morphology can be informative of underlying brain function. Here we test the idea empirically rather than dismissing it out of hand. Whereas nineteenth century phrenologists had access to coarse measurement tools (digital technology referring then to fingers), we were able to re-examine phrenology using 21st century methods and thousands of subjects drawn from the largest neuroimaging study to date. High-quality structural MRI was used to quantify local scalp curvature. The resulting curvature statistics were compared against lifestyle measures acquired from the same cohort of subjects, being careful to match a subset of lifestyle measures to phrenological ideas of brain organisation, in an effort to evoke the character of Victorian times. The results represent the most rigorous evaluation of phrenological claims to date. [sample size is 5.7k people from UKBB)
So, while this is only a single study, we can probably be confident that bumps on the scalp aren’t terribly informative about personality, except in gross cases of brain injury which sometimes causes personality changes.
So, all in all, modern science confirms that human psychological differences relate to visual appearance, including variation in facial features. Humans pick up on these automatically and use them in their social judgments to increase the accuracy of their social judgments in the same way they incorporate group averages (stereotypes). No scientist should be very surprised by these findings.
On a personal note: I’ve been meaning to do some of my own research on this using data scraped from various dating sites and applications. OKCupid data is especially good for this given the rich personality data, but the site is quite bad and not very popular anymore. A big shame! Instead, one will have to rely on data from Tinder, Hinge, Coffee Meets Bagel etc. These datasets don’t generally provide information on the more interesting traits such as sexual paraphilias/kinks (who likes anal sex? what about foot fetish?), criminality (aside from the ancestry and sex link), and detailed political beliefs (what does the typical libertarian look like? Aside from the coffee salon demographics). I haven’t had the time to do this research due to being busy doing work on the genomics of race differences. Get in contact with me if you want to collaborate. I have a lot of data but little experience in these kinds of algorithms.
The PNSE Paper
I’ve mentioned this a few times, but it’s worth going over in detail. The full title is Clusters Of Individual Experiences Form A Continuum Of Persistent Non-Symbolic Experiences In Adults by Jeffery Martin, with “persistent non-symbolic experience” (PNSE) as a scientific-sounding culturally-neutral code word for “enlightenment”. Martin is a Reiki practitioner associated with the “Center for the Study of Non-Symbolic Consciousness”, so we’re not getting this from the most sober of skeptics, but I still find the project interesting enough to deserve a look.
Martin searched various religious and spiritual groups for people who both self-reported enlightenment and were affiliated with “a community that provided validity to their claims”. He says he eventually found 1200 such people who were willing to participate in the study, but that “the data reported here comes primarily from the first 50 participants who sat for in-depth interviews…based on the overall research effort these 50 were felt to be a sufficient sample to represent what has been learned from the larger population”. Although Martin says he tried to get as much diversity as possible, the group was mostly white male Americans.
Martin’s research was mostly qualitative, based on in-depth interviews, so we’re mostly going with his impressions. But his impression was that most people who self-described as enlightened had similar experiences, which could be be plotted on:
…a continuum that seemed to progress from ‘normal’ waking consciousness toward a distant location where participants reported no individualized sense of self, no self-related thoughts, no emotion, and no apparent sense of agency or ability to make a choice. Locations prior to this seemed to involve consistent changes toward this direction.
He describes this distant form of consciousness as involving changes in sense-of-self, cognition, emotion, memory, and perception.
Starting with sense-of-self, he says:
Perhaps the most universal change in what PNSE participants reported related to their sense of self. They experienced a fundamental change from a highly individualized sense of self, which is common among the ‘normal’ population, to something else. How that ‘something else’ was reported often related to their religious or spiritual tradition(s), or lack thereof. For example, Buddhists often referred to a sense of spaciousness while Christians frequently spoke of experiencing a union with God, Jesus, or the Holy Spirit depending on their sect. However, each experienced a transformation into a sense of self that seemed ‘larger’ and less individuated than the one that was experienced previously. Often participants talked about feeling that they extended beyond their body, sometimes very far beyond it…
This change was dramatic and most participants noticed it immediately, even if initially they could not pinpoint exactly what had occurred. Sense of self changed immediately in approximately 70% of participants. In the other 30% it unfolded gradually, with the unfolding period reported as varying from a few days to four months.
Those who were not involved in a religious or spiritual tradition that contextualized the experience often felt that they might have acquired a mental disorder. This analysis was not based on emotional or mental distress. It was typically arrived at rationally because the way they were experiencing reality was suddenly remarkably different than they had previously, and as far as they could tell different from everyone they knew. Many of these participants sought professional mental health care, which no participant viewed as having been beneficial. Clinicians often told them their descriptions showed similarities to depersonalization and derealization, except for the positive nature of the experience.
There were nuances within how sense of self was experienced at different locations along the continuum. In the earliest locations, the sense of self felt expanded, and often seemed more connected to everything. In the farthest locations on the continuum, an even more pronounced change occurred in sense of self; a ll aspects of having an individualized sense of self had vanished for these participants. Prior to this location some aspects of an individualized sense of self remained, and participants could occasionally be drawn into them.
On cognition:
Another consistent report is a shift in the nature and quantity of thoughts. Virtually all of the participants discussed this as one of the first things they noticed upon entering PNSE. The nature and degree of the change related to a participant’s location on the continuum. On the early part of the continuum, nearly all participants reported a significant reduction in, or even complete absence of, thoughts. Around 5% reported that their thoughts actually increased. Those who reported thoughts, including increased thoughts, stated that they were far less influenced by them. Participants reported that for the most part thoughts just came and went, and were generally either devoid of or contained greatly reduced emotional content.
Almost immediately it became clear that participants were not referring to the disappearance of all thoughts. They remained fully able to use thought for problem solving and living what appeared outwardly to be a ‘normal’ life. The reduction seemed limited to self-related thoughts. Nevertheless, participants were experiencing a reduction in quantity of thoughts that was so significant that when they were asked to quantify the reduction, t hose who could answered within the 80-95% range. This high percentage may suggest why someone would say all thought had fallen away.
There do not appear to be negative cognitive consequences to this reduction in thought. When asked, none said they wanted their self-referential thoughts to return to previous levels or to have the emotional charge returned to them. Participants generally reported that their problem solving abilities, mental capacity, and mental capability in general had increased because it was not being crowded out or influenced by the missing thoughts. They would often express the notion that thinking was now a much more finely tuned tool that had taken its appropriate place within their psychological architecture.
On perception:
Participants in the later part of the middle range of the PNSE continuum often reported seeing the unfolding layers of these perceptual processes in detail. They reported being able to begin to detect the difference between the orientation response and the physical, cognitive, and emotional processes that arose after it. They reported reaching a point where some events were reacted to by one or more of these layers while others were not. This was in contrast to participants on the early end of the continuum who perceived all of these layers as one during an event, or at least as a greatly reduced number of discrete processes.
You can read more, plus the sections on emotion and memory, yourself; they mostly fit with the stereotypes you would expect of enlightened people; a lot of tranquility, joy, and focus on the present moment.
What I like about this paper is the parts where it departs from these stereotypes. It makes clear that most of these people’s external characteristics didn’t change at all. In many cases, their friends and family didn’t even notice anything was different, and could not be convinced that anything about them was different:
Despite an overwhelming change in how it felt to experience both themselves and the world after the onset of PNSE, the outward appearance of the participants changed very little. Generally speaking they retained their previous mannerisms, hobbies, political ideology, food and clothing preferences, and so forth. If someone were an environmentalist prior to PNSE, typically they remained so after it. If they weren’t, they still are not.
Many participants discussed the thought, just after their transition to PNSE, that they would have to go to work and explain the difference in themselves to co-workers. They went on to describe a puzzled drive home after a full day of work when no one seemed to notice anything different about them. Quite a few chose to never discuss the change that had occurred in them with their families and friends and stated that no one seemed to notice much of a difference. In short, although they had experienced radical internal transformation, externally people didn’t seem to take much notice of it, if any.
Similarly, despite people saying that they no longer had any sense of agency, they were behaving as agentically as anyone else:
On the far end of the continuum, participants reported no sense of agency. They reported that they did not feel they could take any action of their own, nor make any decisions. Reality was perceived as just unfolding, with ‘doing’ and ‘deciding’ simply happening. Nevertheless, many of these participants were functioning in a range of demanding environments and performing well. One, for example, was a doctoral level student at a major university. Another was a young college professor who was building a strong career. Still another was a seasoned public and private sector executive who served as a high-level consultant and on various institutional-level boards.
Can you imagine investing in a company whose executive believes he cannot take any action and is just watching reality unfold? But it seems to work out.
Other times the PNSE participants are just outright wrong about their experience. When asked if they were stressed, they would say of course not, they were experiencing inner peace. But their friends and family said they were totally stressed. For example:
Over the course of a week, [one participant’s] father died, followed very rapidly by his sister. He was also going through a significant issue with one of his children. Over dinner I asked him about his internal state, which he reported as deeply peaceful and positive despite everything that was happening. Having known that the participant was bringing his longtime girlfriend, I’d taken an associate researcher with me to the meeting to independently collect the observations from her. My fellow researcher isolated the participant’s girlfriend at the bar and interviewed her about any signs of stress that the participant might be exhibiting. I casually asked the same questions to the participant as we continued our dinner conversation. Their answers couldn’t have been more different. While the participant reported no stress, his partner had been observing many telltale signs: he wasn’t sleeping well, his appetite was off, his mood was noticeably different, his muscles were much tenser than normal, his sex drive was reduced, his health was suffering, and so forth.
Or:
It was not uncommon for participants to state that they had gained increased bodily awareness upon their transition into PNSE. I arranged and observed private yoga sessions with a series of participants as part of a larger inquiry into their bodily awareness. During these sessions it became clear that participants believed they were far more aware of their body than they actually were. For example, the instructor would often put her hand on part of the body asking the participant to relax the tense muscles there, only to have the participant insist that s/he was totally relaxed in that area and did not feel any muscle tension.
Or even:
During some interviews participants expressed that they no longer felt it was possible for them to be racist or sexist. I asked these participants to take Harvard University’s Project Implicit tests online. All of these participants were white males and each showed a degree of sexism and/or racism, including participants who were in the later no emotion and agency locations on the continuum. Project Implicit uses physiology to test these responses.
It’s tempting to say these people are just making it up. But I think about some of the people I know with very severe psychiatric issues, people who are constantly miserable – and are similarly externally unaffected. These people are holding down stressful jobs, keeping difficult relationships together, etc – and often the people they haven’t “opened up to” don’t have any inkling of what they’re going through. They may tell me it must seem obvious to everybody that they’re completely falling apart – whereas in fact they are speaking fluently, they’re well-dressed, and they haven’t made a single social misstep during the whole time I’ve known them. If unusually negative mental states don’t affect behavior as strongly as people believe, why not unusually positive mental states?
Also, other times these people under-estimate themselves:
As participants neared the further reaches of the continuum, they frequently reported significant difficulty with recalling memories that related to their life history. They did not feel this way about facts, but rather about the details of the biographical moments surrounding the learning of those facts. They also reported that encoding for these types of memories seemed greatly reduced. A lthough this was their perception it did not appear to be the case when talking to them. They were typically rich sources of personal history information and their degree of recall seemed indistinguishable from participants who were in earlier locations on the continuum.
But:
There was a noticeable exception that seemed to be a genuine deficit. As they neared and entered the farther reaches of the continuum, participants routinely reported that they wereincreasingly unable to remember things such as scheduled appointments, while still being able to remember events that were part of a routine. For example, they might consistently remember to pick their child up at school each day, but forget other types of appointments such as doctor visits. Often they had adapted their routines to adjust for this change. Many would immediately write down scheduled events, items they needed to get at the store, and so forth on prominently displayed lists. When visiting their homes I noticed that these lists could be found on: televisions, computer monitors, near toilets, on and next to doors, and so forth. It was clear that the lists were being placed in locations that the participants would look with at least some degree of regularity. Participants consistently stated that they would prefer to remain in PNSE even if going back to ‘normal’ experience meant that they would no longer have this type of deficit.
Finally, Martin is impressed with the certainty that accompanies all of these experiences. People describe their PNSE as obviously more real and better than past states. They tend to be very effusive about this, saying that having the experience shattered everything they had previously believed in the most obvious and final way. But here too, there are signs that the participants are not well-attuned to what is going on in their own heads. Martin says that participants who moved from one level of his continuum to another (whether forward or back) would always say that the level they were currently at was the most fundamental and obviously real (even if they had said the opposite before). When he would tell participants about the experiences of other participants who were at different points of the continuum or just describing their experiences a slightly different way, both participants would confidently pronounce that the other wasn’t really enlightened.
I like this paper because it provides the basis for a minimalist account of enlightenment, similar to Daniel Ingram’s. Enlightenment hasn’t transformed these people’s personalities. It hasn’t given them infinite willpower or productivity or the ability to shoot qi bolts from their third eyes. It hasn’t even given them that much self-understanding. It’s just given them a different kind of internal experience.
The experience itself is hard to describe, but seems marked by drawing the self-other boundary in a different place. Participants don’t see themselves as making decisions; the decisions get made “under the hood” in a way where the person just feels like their path is laid out before them. They don’t see themselves as having thoughts; computations obviously get done, but they are not in awareness. They don’t feel like they have stress, even if the stress is physiologically present and obvious from their actions. On the other hand, they were more aware of certain low-level perceptual processes that are usually unconscious. It seems to be accompanied by total certainty that this is correct and revelatory and new (…much like the altered states people sometimes get on drugs).
None of this seems wildly outside the realm of possibility. It seems about as surprising as the existence of some new mental disorder. If 50 (or 1200, depending on how you count it) people with no history of lying said they had some kind of weird new mental disorder, I’d be willing to credit that they were describing their experience correctly, and able to give some useful information on the sorts of things that caused this disorder. It just sounds like information processing in the brain switching to some new attractor state if you force it hard enough.
Good Men Aren’t Getting Harder to Find
In a recent editorial, Wall Street Journal editor at large Gerard Baker noted that the share of female college graduates has risen to 57 percent, and posited that the disproportionate number of college-educated women is affecting the dating market. Since there are now four female college graduates in their 20s or 30s for every three college-educated males of the same age, and since women prefer not to date men whose status is lower than theirs, there must not be enough men to go around.
This hypothesis fits conveniently with a number of narratives, promulgated across the political spectrum from Bernie Sanders to Jordan Peterson, about boys and men falling behind or being abandoned by society. However, on closer examination, the story is a bit more nuanced. Baker makes a mistake common in trend pieces on higher education: He takes a statistic about “college graduates” and draws a conclusion that fails to consider the differences among the huge range of degree-granting institutions in the United States.
Every year in the US, nearly 2 million students enroll in one of the nearly 4,300 degree-granting colleges and universities. Of these schools, a few dozen at most would be considered elite, and maybe a few dozen more would be considered highly-selective. A hugely disproportionate share of writers at national media outlets attended a handful of elite private universities, and nearly everyone in mainstream media, and probably almost everyone they know attended elite or selective private universities, or selective state flagships. But these universities collectively educate only a small fraction of the total number of US college students.
US News and World Report ranks 400 universities and 225 liberal arts colleges, which pretty much covers every institution you’ve heard of and many you haven’t. But even this seemingly-exhaustive list still includes only 15 percent of degree-granting institutions. The traditional college experience of enrolling at the age of 18 in a four-year residential program at an academically-selective college or university is not the most common way in which Americans experience college. Millions of American students attend commuter campuses that serve the needs of training workers for local businesses and institutions.
When you take a statistic like the one that shows that 57 percent of all bachelors degrees are awarded to women, you’re drawing a generalization about the full set of 4,300 colleges that may not be true at specific schools, or subsets like the set of elite private universities. And, in fact, the disparity between men and women earning degrees at selective and elite universities seems to be much smaller than the disparity among overall college graduates.
At Harvard, Princeton, Columbia and University of Chicago, recent classes skewed slightly male. At Yale, Stanford, and Duke men and women are at parity.
Further down the rankings list, there were some significant disparities at schools like UNC-Chapel Hill, which is 62 percent female, NYU, which is 58 percent female, and UCLA and University of Georgia which are 57 percent female.
However genders were at parity or skewed slightly male at schools like Ohio State University, Binghamton University, Indiana University-Bloomington, University of Wisconsin-Madison, University of Michigan-Ann Arbor, and University of Tennessee-Knoxville. My undergraduate alma-mater, the University of Maryland at College Park, is 53 percent male. At schools focused on science and engineering, the proportions skew heavily male, as at MIT, which is 54 percent male and Georgia Tech, which is about 60 percent male.
A spot-check of a few dozen elite and selective schools suggests that there is near gender parity at the most elite private universities, and perhaps a slight tilt toward women among selective private schools and public flagships, but not one nearly as dramatic as the nationwide numbers would lead you to believe.
And there is no evidence that women are outnumbering or outperforming men in elite fields. Women who hold bachelor’s degrees earn significantly less, on average, than men who hold bachelor’s degrees, which indicates that the median female college graduate is working in a lower-status job than the median male college graduate. About two-thirds of lawyers are men, while nearly nine out of ten paralegals are women. Two-thirds of financial advisers are men, and while women earn more master’s degrees overall, men earn two out of three MBAs. Men report most of the news at top print, television and online outlets. Five out of six engineers and three out of four computer scientists are men. Reports of a generation of lost incel dudes living in basements and anesthetizing themselves with Fortnite and Doritos are wildly overstated.
In fact, it is the least selective schools that are driving the national gender gap in bachelor’s degrees. For example, at for-profit colleges, most of which have very low admissions standards, 63 percent of students are female.
The elite schools and, to a lesser extent, the selective schools, train America’s professionals, its media and business elites, and its academics and thought leaders. Graduating from these schools denotes class and status, and women who graduate from these schools might be hesitant to date men who attended less prestigious institutions or did not attend college at all.
Less-selective schools, however, don’t signify the same kind of status. Schools where the median student scores below 1100 on the SAT train students for middle-class careers, and female graduates of these institutions are unlikely to perceive a status gap between themselves and men who work in skilled, middle-class jobs that do not require a college degree. It seems that the larger share of female college graduates is a function of the fact that middle-class jobs that skew heavily female are more likely to require a college credential, while male-dominated jobs of similar status do not.
Over 90 percent of nurses are women. To become a registered nurse, one needs at least an associate’s degree, and most newly-minted nurses have a bachelor’s degree. There were 101,000 bachelors degrees in nursing awarded in the 2012-2013 academic year, which means nurses earn about 6 percent of all bachelor’s degrees in the United States.
Three-quarters of American schoolteachers are women, and all teachers must earn at least a bachelor’s degree. About 11 percent of all female college students major in education.
Jobs that confer a comparable status and skew male often do not require academic credentials. To become a plumber or an electrician, for example, one must complete an apprenticeship that often lasts for several years and pass a state certification exam, but these jobs do not require college degrees. The skilled trades are about 98 percent male. About 87 percent of US police officers are men, and only a third of cops have a four-year degree. In order to become a firefighter or a paramedic, you need a state certification, but not a degree. More than 90 percent of firefighters and more than two thirds of paramedics are men.
So, even though more women earn degrees than men, there is virtually no gender gap at elite schools, and gender gaps in elite fields favor men. What the data actually tell us is that there are significantly more women than men going to lower-ranked colleges and universities to earn credentials that qualify them to become teachers, nurses, paralegals, clerks and office administrators. The fact that nursing and teaching require degrees while law enforcement, emergency medical services, and skilled trades do not seems to largely explain why more women than men earn college degrees.
That means that the dating apocalypse Gerard Baker fears, in which a surfeit of educated, credentialed women can’t find any men of comparable status to date, will not happen unless teachers and nurses are unwilling to date police officers, firefighters, paramedics and tradesmen.
Daniel Friedman is the Edgar Award-nominated author of Don’t Ever Get Old, Don’t Ever Look Back and Riot Most Uncouth. Follow him on Twitter @DanFriedman81.
The post Good Men Aren’t Getting Harder to Find appeared first on Quillette.
Some Income Tax Data on the Top Incomes
The first table shows a breakdown for taxpayers from the top .001% to the top 5%. Focusing on the top .001% for a moment, there were 1,433 such taxpayers in 2017. (You'll notice that the number of taxpayers in the top .01%, .1% and 1% rise by multiples of 10, as one would expect.)
The "Adjusted Gross Income Floor" tells you that to be in the top .001% in 2017, you had to have income of $63.4 million in that year. If you had income of more than $208,000, you were in the top 5%,
The total income for the top .001% was $256 billion. Of that amount, the total federal income tax paid was $61.7 billion. Thus, the average federal income tax rate paid was 24.1% for this group. The top .001% received 2.34% of all gross income, and paid 3.86% of all income taxes.
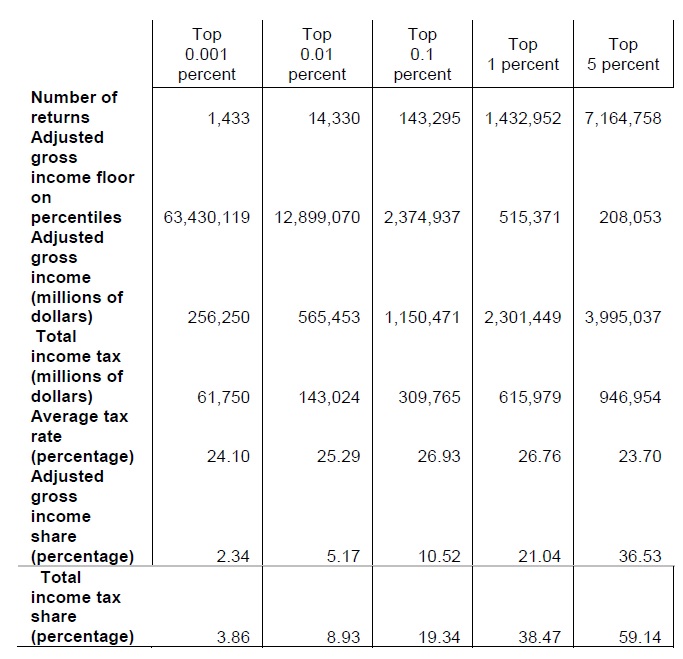
Here's a follow-up table showing the same information, but for groups ranging from the top 1% to the top 50%.

1) Those at the very tip-top of the income distribution, like the top .001% or the top .01%, pay a slightly lower share of income in federal income taxes than say, the top 1%. Why? I think it's because those at the very top are often receiving a large share of their annual income in the form of capital gains, which are taxed at a lower rate than regular income.
2) It's useful to remember that many of those at the very tip-top are not there every year. It's not like the fall into poverty the next year, of course. But they are often making a decision about when to turn capital gains into taxable income, and they are people who--along with their well-paid tax lawyers-- have some control over the timing of that decision and how the income will be received.
3) The average tax rate shown here is not the marginal tax bracket. The top federal tax bracket is 37% (setting aside issues of payroll taxes for Medicare and how certain phase-outs work as income rises). But that marginal tax rate applies only to an additional dollar of regular income earned. With deductions, credits, exemptions, and capital gains taken into account, the average rate of income tax a as a share of total income is lower.
4) The top 50% pays almost all the federal income tax. The last row on the second table shows that the top 50% pays 96.89% of all federal income taxes. The top 1% pays 38.47% of all federal income taxes. Of course, anyone who earns income also owes federal payroll taxes that fund Social Security and Medicare, as well as paying federal excise taxes on gasoline, alcohol, and tobacco, and these taxes aren't included here.
5) This data is about income in 2017. It's not about wealth, which is accumulated over time. Thus, this data is relevant for discussions of changing income tax rates, but not especially relevant for talking about a wealth tax.
6) There's a certain mindset which looks at, say, the $2.3 trillion in total income for the top 1%, and notes that the group is "only" paying $615 billion in federal income taxes, and immediately starts thinking about how the federal government could collect a few hundred billion dollars more from that group, and planning how to spend that money. Or one might focus further up, like the 14,330 in the top .01% who had more than $12.8 million in income in 2017. Total income for this group was $565 billion, and they "only" paid about 25% of it in federal income taxes. Surely they could chip in another $100 billion or so? On average, that's only about $7 million apiece in additional taxes for those in the top .01%. No big deal. Raising taxes on other people is so easy.
I'm not someone who spends much time weeping about the financial plight of the rich, and I'm not going to start now. It's worth remembering (again) that the numbers here are only for federal income tax, so if you are in a state or city with its own income tax, as well as paying property taxes and the other taxes at various levels of government, the tax bill paid by those with high incomes is probably edging north of 40% of total income in a number of jurisdictions.
But let's set aside the question of whether the very rich can afford somewhat higher federal income taxes (spoiler alert: they can), and focus instead on the total amounts of money available. The numbers here suggest that somewhat higher income taxes at the very top could conceivably bring in a few hundred billion dollars, even after accounting for the ability of those with very high income to alter the timing and form of the income they receive. To put this amount in perspective, the federal budget deficit is now running at about $800 billion per year. To put it another way, it seems implausible to me that plausibly higher taxes limited to those with the highest incomes would raise enough to get the budget deficit down to zero, much less to bridge the existing long-term funding gaps for Social Security or Medicare, oi to support grandiose spending programs in the trillions of dollars for other purposes. Raising federal income taxes at the very top may be a useful step, but it's not a magic wand that can pay for every wish list.
Dictators: The Great Performers
The paradox of the modern dictator is that he must create the illusion of mass support while turning the population into a nation of terrorised prisoners endlessly condemned to faking enthusiasm for their oppressor. Frank Dikötter, a brilliant historian with a prize-winning trilogy on Mao’s China behind him, takes eight of the most successful 20th-century dictators: Mussolini, Hitler, Stalin, Mao Zedong, Kim Il-sung, Nicolae Ceausescu, Papa Doc Duvalier and Mengistu, and shows with chilling brevity and clarity how this is done.
The road...

The Real Agents of S.H.I.E.L.D.
This article does not reflect the views of the Transportation Security Administration.
It is most living Americans’ “Where Were You When” moment, the day we all watched looped film of airliners crashing into the Twin Towers, watched victims trapped by raging flames forced to choose between being burned alive and jumping to their deaths. Readers not old enough to remember the horror of that day can get a sense from audio of 9/11 released by the Transportation Security Administration (TSA) in 2018. The TSA is an agency of the U.S. Department of Homeland Security that was created as a response to the 9/11 attacks to make sure nothing like that ever happens again.
As that collective trauma fades into history, the TSA, where I work, enjoys about the same level of public support as a measles outbreak.
The Threat and Why We Do What We Do
If you worked for the federal government on 9/11 in any sort of national security capacity, you knew fear of further attacks were pervasive, particularly after the anthrax mailings sharpened the impression of being under attack by unknown assailants on multiple fronts. (I worked in a building that got one of the letters.) Fear is hardly conducive to good policymaking, yet it was in this environment that the Department of Homeland Security, and its red-headed stepchild, the Transportation Security Agency, was born. It’s mission: to avoid a repeat of the airport security failure that allowed 19 Al Qaeda terrorists to hijack four jetliners using smuggled box-cutters.
For whatever reason, militant Islamists have long been fixated on attacking commercial aircraft. 9/11 carried the highest body count, but other equally ambitious attacks have been foiled by bad terrorist planning, good intelligence work, the intervention of brave passengers, and sheer luck.
Most Americans’ first acquaintance with Al Qaeda was 9/11, but that was not their first attempted attack on commercial aviation. In 1995, 9/11 mastermind Khalid Sheik Mohammed put together the “Bojinka Plot,” which was to start with the assassination of Pope John Paul II when he visited the Philippines, and conclude by placing bombs on 11 US bound planes. Luckily, members of the terrorist cell accidentally started a fire at their safehouse apartment and were subsequently arrested.
Few now remember that just three months after 9/11 would-be suicide bomber Richard Reid was stopped from igniting the explosive packed into his shoes by observant passengers on an American Airlines flight from Paris to Miami. You can thank Reid for having to take your shoes off and get them x-rayed when you fly.
In 2006, another massive Al Qaeda bombing plot was disrupted. Seven US-bound airliners were to be taken down with bomb’s assembled mid-flight from the liquid explosive TATP smuggled in sports-drink bottles. You can thank the perpetrators of that plot for why you are limited in the amount of liquid you can carry on board. (As an aside, if you want to carry a liquid on board, freeze it solid. No quantity restrictions.)
Then came the attempt by the “Underwear Bomber,” Omar Farouk Abdulmutallab, to detonate PETN explosive powder sewn into his underwear to take down a Northwest Airlines flight over Detroit. Again, an observant passenger intervened. In response, the TSA rapidly deployed full body scanners to all major US airports.
In 2010, intelligence was passed to the US warning that three US-bound cargo planes had bombs on board. They were stopped and searched before reaching the US.
Outside the U.S., Islamist terrorists have been more successful.
In 2015, a chartered jet bound for Russia, Metrojet Flight 9268, was blown from the sky by a bomb planted by ISIS, killing 224.
In 2016, the Somali Affiliate of Al-Qaeda, al-Shabaab, smuggled a bomb on board Daallo Airlines Flight 159, which detonated and blew a hole in the aircraft, sucking out the suicide bomber. The bomb was likely concealed in a laptop, which is one reason passengers are now required to get their laptops and other large electronics out of bags.
The onerous but performative aspect of the TSA’s job is designed to show bad guys watching us that everyone, even grandmothers and war vets, are subject to thorough screening. Of course we know it is extremely unlikely that a grandmother managed to pack plastic explosives in her oversize tube of toothpaste. But until some security genius comes up with a reliable way to read hostile intent, we have to react as if she might have. Which gives bad guys less motivation to enlist grannies—through bribery, trickery, or compulsion—as smugglers.
We cannot know how many, if any, terror plots aimed at commercial aviation the TSA has disrupted or deterred. By definition, deterred plots didn’t happen. But we do know we are being “probed” by would-be terrorists and smugglers to see what our screening catches, and how the TSA reacts.
“Probes” can be as simple as submitting a bag containing a giant block of cheese with a cell phone taped to it to see if we will catch large organic masses connected to electronics. But it can also involve classic “casing” behavior. At my airport, a small regional airport in the southwest, TSA officers noted and reported a foreign student doing suspicious things, including abandoning a moving truck in front of the terminal, and abandoning a large bag outside the screening checkpoint. Shortly after reporting this, the FBI arrested the student hundreds of miles away, outside Fort Huachuca, the training ground for the US military’s intelligence officers, with guns in his possession. That’s what a stillborn terrorist plot looks like.
While we have no figures for plots deterred, we do have numbers for gun seizures. In 2008, the TSA seized 926 guns from passengers attempting to bring them into an airliner’s cabin. Every year since, gun seizures have climbed substantially, with 4,239 guns, 86 percent of which were loaded, seized in 2018, up 457 percent since 2008. (To be clear, its fine to bring firearms on board-but only in checked baggage. The weapons cannot be loaded, or accessible to passengers in flight.)
The Challenges
Considering that the TSA screened 813,000,000 passengers in 2018, and well over a billion checked bags, 4,239 gun seizures means roughly one in 200,000 passengers is carrying a serious threat item (not counting knives, which are legion: every large airport confiscates dozens a day). You don’t have to be an organizational psychologist to understand that when serious threats appear in one out of every 200,000 screenings, you have a problem. Humans are novelty-seeking creatures. Maintaining vigilance in the face of a steady stream of false positives, of possible threats that turn out to not be threats, is a situation humans are poorly wired to cope with. That’s one of the reasons the TSA sends covert testing teams around with a wide variety of simulated threat items. It helps keep us alert in face of routine and boredom. Some of the equipment we use also generates automated tests to help maintain vigilance.
TSA security is far from perfect, but also far better than you’d think from the skewed press coverage claiming that the TSA misses 95 percent of threats. Those numbers are vastly inflated—based on covert testing failures that do not include some key facts. The TSA’s covert testing teams are already “inside our perimeter.” A real bad-guy has to pass through several layers of unseen security that can flag them as a threat and our covert testing teams automatically bypass those, creating the impression of more weakness in the system than there really is. In addition, the testing teams know from the inside every weak point in the TSA’s Standard Operating Procedures (SOP) and equipment, knowledge that the vast majority of terrorists wouldn’t possess. Their testing is designed to exploit those weaknesses in ways that working level Transport Security Officers (TSOs) are often ill-equipped to prevent. Our “failed” tests, therefore, are carried out by the equivalent of terrorists who happen to be expert in every piece of equipment the TSA has, every procedure it uses, while skipping layers of security both before and after the checkpoint screening process. These tests “steel-man” terrorist capability by assuming the TSA has been penetrated at every level by hostile aviation security experts, and then trying to see if those experts can still pull something off. And the answer is, with all those cards in their hands, they often can. But real terrorists don’t hold all of those cards, so the success rate of the testing teams is misleadingly high.
When passengers without “insider” advantages try to fool screeners they have a harder time. As when seven members of a reality TV film crew were arrested on multiple charges in 2018 in Newark airport trying to smuggle in a simulated bomb. The fines they faced for that shenanigan aren’t known, but considering the fines for attempting to carry a loaded gun onto a plane can exceed $13,000, and Uncle Sam is not above “making an example,” trying to trick the TSA with a fake bomb probably won’t be repeated soon by other TV production companies.
Looked at broadly, any security protocol should be reduced to the absolute bare minimum of complexity that can still do the job. It is too easy to screw up otherwise. The TSA’s basic screening SOP (there are others) is already 130 pages of individual decision trees that can easily confuse people who have been doing the job for years. The wise thing to do, then, is to avoid increasing complexity wherever possible, because as complexity increases, so do mistakes that create holes in security.
The TSA has to act as if the techniques used to smuggle drugs can also be used to smuggle weapons, for the obvious reason that they can be. Smugglers’ “mules” are paid to move a product, but the mules have no way to know whether white powder hidden in a bra is the instantly-lethal-to-touch drug Carfentanil, or the explosive oxidizer ammonium perchlorate. We don’t know either, unless everybody gets screened.
And a failure to screen everybody, to create exceptions, because it is, say, a pregnant woman, introduces points of failure. Any time you create a protected category, and subject people to lesser level of scrutiny, you can count on that protected status immediately being exploited. There is literally no category of people who haven’t tried to use a perceived protected status to smuggle. Women with sick infants smuggle. Old men smuggle. Old women smuggle. Women faking pregnancy smuggle. People with deliberately disgusting feet smuggle (one can only imagine the smell from the Underwear Bomber, who was rumored to have worn his explosive-laden undies for two weeks straight ahead of his flight to “get used to it.”) In all cases, smuggling techniques can be adapted to smuggle bomb components. And it has been done many times by female suicide bombers.
All of which explains that while TSOs have to respect all passengers, we cannot give deference to any identity groups, however vulnerable. You are not special, because nobody is. It is as egalitarian as any process gets. We’re not there to hold your hand. We’re there to make sure you are not a threat to aviation security. Period.
Your In-Flight Security Courtesy of Low-Paid “Racists”
There is a recent trend in press coverage of the TSA that either implies, or outright states, that the TSA is a racist organization out to humiliate black people. Cosmopolitan, for example, asserts that if black women (allegedly) get more hair pat downs after going through the body scanner, it must be a result of racism. At no point is it acknowledged that the physical structure of black hair is, on average, different to Caucasian or Asian hair, notably curlier and kinkier. Or that black passengers’ choices to wear more elaborate and dense hairstyles can come with the cost of more hair pat downs. Fashion choices do have costs when it comes to screening: clothes with sparkle or bling trigger body scanner alarms, and elaborate hairstyles can too.
The scanners aren’t perfect. They react idiosyncratically to a whole host of factors, including hair and hairstyles with different physical properties. Also, to any physical objects in a person’s hair, including barrettes, beads, extensions, wigs, alligator clips, hairpins, hats, all sorts of headbands and head-wraps. That fact that the scanner highlights those objects means it is working as designed. These facts are ignored in place of a narrative of institutional racism, and racism so diabolical that it has somehow been foisted on one of the most racially diverse workforces in the federal government—TSA employees are 25 percent African American and 23 percent Latino (roughly 12.5 percent of the US population is black and 17 percent is Latino).
Oddly enough, nowhere in the press coverage is the view that TSOs, if it were up to us, would rather see passengers move through the screening process as quickly as possible, because it’s less of a headache. Or that when a body scanner alarms on a passenger’s hair, we have no choice to pat the area down, or lose our jobs. Instead, we’re portrayed as mustache-twirling racists who hate black women so much we take every opportunity to humiliate them, even though every screening delay makes TSOs’ lives harder.
Perhaps Cosmo is nobody’s idea of a hard-hitting news outlet, but even generally respected outlets like ProPublica imply scanner issues are proof of careless design on the part of the scanner manufacturer, and enable discrimination by the TSA.
Why not consider that maybe body scanner algorithms struggle with complex or dense hair styles? And maybe TSOs are just doing their best to cope with the limitations of imperfect scanner technology? I suspect articles saying that the TSA is racist get more clicks. Nuance is boring.
Passengers may say, not without cause, that TSOs are rude. Its definitely a complaint you will hear more at big airports where TSOs are under pressure by management to maximize passenger throughput. I try and avoid those airports myself as a passenger. Also, as in any job, there are some employees who are rude by disposition.
There are also TSOs who become rude over time, a defensive reaction to the endless stream of passengers who come through the screening process insisting they deserve special treatment and accuse TSOs of acting in bad faith when they don’t get it.
The Bulldozer Mom
Here is what a bad faith accusation looks like from a TSO’s point of view. One of my male colleagues was called to do a pat down on a 17-year-old boy after the body scanner showed a groin alarm. Any groin alarm means a pat down, front and back, from hips to knees. Again, thank the underwear bomber for that. Ninety percent of the time passengers get a groin patdown, it’s a self-inflicted wound. Before directing them to the body scanner, a TSO has asked the passenger (usually men, as men’s’ clothes have more pockets) to check their pockets and make sure there is nothing in them. Nothing means nothing—not coins, gum, a wallet, your phone, or Chapstick. The whole point of the body scanner is to find small objects so anything left in your pocket will set it off.
The 17-year-old boy left something in his back pocket. That alarmed the scanner. My colleague advised him that because the body scanner indicated an anomaly in that area, the passenger had to get a groin pat down to resolve it, and explained the steps he would be taking. This is standard, and the passenger had no problem with it. My colleague performed the pat-down in the exact same way he’s done hundreds of times before, per the TSA’s SOP. In full view of several passengers, including the boy’s father, and several TSOs.
And his “bulldozer” mom. What she saw was something everyone else has somehow missed. In her mind, my colleague was molesting her dear young boy. She complains loudly to my colleague. Then to his supervisor. Then to the police officer at the checkpoint. (And, of course, later in writing.) And while this complaining is happening, the boy and her husband, mortified at the unnecessary fracas, literally move to the other side of the seating area to be as far away from her as possible.
And then it gets even more delightful. When a passenger creates a big stink, and then leaves the TSA checkpoint to get on their flight, that’s not the end of it for us, it is just the beginning. The first thing every TSO who witnessed the pat-down has to do is write an official statement ahead of the inevitable investigation. In this case, three TSOs had to write statements about the event, in which nothing happened that doesn’t happen literally hundreds of times a day at every busy checkpoint in the country.
Underlying the mother’s claim was the assumption that the TSO that gave her son the pat-down wasn’t simply doing his job, but was a pervert in a TSA uniform and she was the lone crusader who sniffed him out. Another implication was that his colleagues saw what was going on, and in doing nothing to stop it, conspired to ignore his transgressions.
When passengers look at a TSA checkpoints and see cameras everywhere they might presume it is to spot potential security breaches. That is their official function. But what they are far more routinely used for is to protect TSOs from exactly the kind of baseless complaint described above. Practically speaking, those cameras are not for the passenger’s protection, but the protection of TSOs from time-wasting complaints.
When you have to perform mildly unpleasant procedures on a daily basis, and get accused of sexual assault, or racism, or any of 100 other kinds of bad faith, think of how that might make you feel.
In 2018, the TSA was ranked by employees as the 395th least desirable federal entity to work in out of 415. (395th was actually a slight improvement on 2017.) And dead last when it came to pay. Small wonder that the TSA has an awful employee retention rate. Turns out people don’t like being poorly paid to do a thankless job while being treated with contempt.
Or not paid to do it, as was the case when tens of thousands of TSOs, myself included, showed up and continued doing our jobs without being paid for over a month during the government shutdown of early 2019. Our pay checks were held up, while much of the rest of the executive branch, the courts, and of course, Congress, got paid.
We know all this, but also that, in addition to the meager paycheck, we’re standing between U.S. airline passengers and a repeat of 9/11. So we do the job anyway.
The author is a Transportation Security Officer who has served in the U.S. Army, the U.S. intelligence community, and now works for the TSA. He has been writing about national security topics for over a decade. A Kelleher is a pseudonym. Comments can be sent to TSAarticle@mail.com.
The post The Real Agents of S.H.I.E.L.D. appeared first on Quillette.
Too Much Dark Money In Almonds
Everyone always talks about how much money there is in politics. This is the wrong framing. The right framing is Ansolabehere et al’s: why is there so little money in politics? But Ansolabehere focuses on elections, and the mystery is wider than that.
Sure, during the 2018 election, candidates, parties, PACs, and outsiders combined spent about $5 billion – $2.5 billion on Democrats, $2 billion on Republicans, and $0.5 billion on third parties. And although that sounds like a lot of money to you or me, on the national scale, it’s puny. The US almond industry earns $12 billion per year. Americans spent about 2.5x as much on almonds as on candidates last year.
But also, what about lobbying? Open Secrets reports $3.5 billion in lobbying spending in 2018. Again, sounds like a lot. But when we add $3.5 billion in lobbying to the $5 billion in election spending, we only get $8.5 billion – still less than almonds.
What about think tanks? Based on numbers discussed in this post, I estimate that the budget for all US think tanks, liberal and conservative combined, is probably around $500 million per year. Again, an amount of money that I wish I had. But add it to the total, and we’re only at $9 billion. Still less than almonds!
What about political activist organizations? The National Rifle Association, the two-ton gorilla of advocacy groups, has a yearly budget of $400 million. The ACLU is a little smaller, at $234 million. AIPAC is $80 million. The NAACP is $24 million. None of them are anywhere close to the first-person shooter video game “Overwatch”, which made $1 billion last year. And when we add them all to the total, we’re still less than almonds.
Add up all US spending on candidates, PACs, lobbying, think tanks, and advocacy organizations – liberal and conservative combined – and we’re still $2 billion short of what we spend on almonds each year. In fact, we’re still less than Elon Musk’s personal fortune; Musk could personally fund the entire US political ecosystem on both sides for a whole two-year election cycle.
But let’s go further.
According to this article, Mic.com sold for less than $5 million. Mashable sold for less than $50 million. The whole Gawker network (plus some other stuff including the Onion) sold for $50 million. There are some hints that Vox is worth a high-eight-digit to low-nine-digit amount of money. The Washington Post was sold for $250 million in 2013 (though it’s probably worth more now). These properties seem to be priced entirely as cash cows – based on their ability to make money through subscriptions or ads. The extra value of using them for political influence seems to be priced around zero, and this price seems to be correct based on how little money is spent on political causes.
Or: Jacobin spends a lot of time advocating socialism. The Economist spends a lot of time advocating liberalism. First Things spends a lot of time advocating conservatism. They all have one thing in common: paywalls. How could this be efficient? There are millions of people who follow all of these philosophies and really want to spread them. And there are other people who have dedicated their lives to producing great stories and essays advocating and explaining these philosophies – but people have to pay $29.99 for a subscription to read their work? Why do ideologies make people pay to read their propaganda?
Maybe the most extreme example here is Tumblr.com, which recently sold for $3 million, ie the cost of a medium-sized house in San Francisco. Tumblr has 400 million monthly visitors, and at least tens of millions of active users. These people talk politics all the time, usually of a far-left variety. Nobody thinks that one of the central political discussion platforms of the far-left is worth more than $3 million? Nobody on the right wants to shut it down? Nobody on the left wants to prevent that from happening? Nobody with a weird idiosyncratic agenda thinks being able to promote, censor, or advertise different topics on a site with tens of millions of politically engaged people is at all interesting?
(in case you’re keeping track: all donations to all candidates, all lobbying, all think tanks, all advocacy organizations, the Washington Post, Vox, Mic, Mashable, Gawker, and Tumblr, combined, are still worth a little bit less than the almond industry. And Musk could buy them all.)
The low level of money in politics should be really surprising for three reasons.
First, we should expect ordinary people to donate more to politics. A lot of the ordinary people I know care a lot about politics. In many of the events they care about most, like the presidential primaries, small donations matter a lot – just witness Tom Steyer begging for small donations despite being a billionaire. If every American donated $25 to some candidate they supported, election spending would surpass the almond industry. But this isn’t even close to happening. Bernie Sanders is rightly famous for getting unusually many small donations from ordinary people. It’s not clear exactly how much he’s received, but it looks like about $50 million total. This sounds like a lot of money, but if you use polls to estimate how many supporters he has, it looks like each supporter has on average given him $2. This is a nice token gesture, but surely less than these people’s yearly almond budget.
Second, we should expect the rich to donate more to politics. Many politicians want to tax billionaires; billionaires presumably want to prevent that from happening. Or wealthy people might just have honestly-held political opinions of their own. As rich as Elon Musk is, he’s only one of five hundred billionaires, and some of the others are even richer. So how come the amount of money in politics is so much less than many individual billionaires’ personal fortunes?
Third, we should expect big corporations to donate more to politics. Post Citizens United, corporations can supposedly put as much money into politics as they want. And they should want a lot. The government regulates corporations, so having friendly politicians in power can mean life or death for entire industries. Suppose hostile government regulation could decrease Exxon Mobil’s revenues 5% – you would think Exxon Mobil would be willing to spend 4% of its revenue to prevent this. But Exxon makes $280 billion per year. 4% of its revenue would already be larger than the whole US political ecosystem! In fact, according to Exxon’s own records, they only spend about $1 million per cycle. While they’re probably hiding something, they couldn’t hide donations the size of the whole rest of the political ecosystem, so it’s still pretty mysterious.
I think there are individual factors affecting all of these. As mentioned before, elections have spending limits (however inconsistently enforced) and may not be tractable to money. Think tanks may be more talent-limited than funding-limited. Media properties may be limited by the opinions of their journalists and subscribers (the Washington Post couldn’t pivot to being a conservative outlet without getting completely different employees and customers). Tumblr has already proven unable to censor its users without sparking a mass exodus. These issues are probably responsible for part of the underpricing. But it still seems surprising.
In his paper on elections, Ansolabehere focuses on the corporate perspective. He argues that money neither makes a candidate much more likely to win, nor buys much influence with a candidate who does win. Corporations know this, which is why they don’t bother spending more. Most research (plus the 2016 results) confirms that money has little effect on victory, so maybe this is true. But it would also have to be true that lobbying, the NRA, the media, etc don’t affect politics very much, which seems like a harder sell.
That leaves the Bernie Sanders supporters. Even if money doesn’t affect politics, Sanders supporters seem like about the least likely people to believe that. I think here we have to go back to the same explanation I give in Does Class Warfare Have A Free Rider Problem? People just can’t coordinate. If everyone who cared about homelessness donated $100 to the problem, homelessness would be solved. Nobody does this, because they know that nobody else is going to do it, and their $100 is just going to feel like a tiny drop in the ocean that doesn’t change anything. People know that a single person can’t make a difference, so they don’t want to spend any money, so no money gets spent. This is true for ordinary people, but it’s also true for billionaires and greedy corporations. No single greedy corporation wants to pony up the money to change the laws to favor greedy corporations all on its own, while its competitors lie back and free-ride on its hard work. So they basically donate token amounts and do nothing. By all accounts the Koch brothers actually believed in everything they were doing, and they had to, because you couldn’t make billionaires spend Koch-brothers-like levels of time and money out of self-interest.
In this model, the difference between politics and almonds is that if you spend $2 on almonds, you get $2 worth of almonds. In politics, if you spend $2 on Bernie Sanders, you get nothing, unless millions of other people also spend their $2 on him. People are great at spending money on direct consumption goods, and terrible at spending money on coordination problems.
I don’t want more money in politics. But the same factors that keep money out of politics keep it out of charity too.
The politics case is interesting because it’s so obvious. Nobody’s going to cynically declare “Oh, people don’t really care who wins the election, they just pretend to.” It’s coordination problems! It has to be!
So when I hear stories like that Americans could end homelessness by redirecting the money they spend on Christmas decorations, I don’t think that’s because they’re evil or hypocritical or don’t really care about the issue. I think they would if they could but the coordination problem gets in the way.
This is one reason I’m so gung ho about people pledging to donate 10% of their income to charity. It mows through these kinds of problems. I may not be a great person. But I spend more each year on the things I consider most important than I do on almonds, and this is the kind of thing that doesn’t happen naturally. It’s the kind of thing where I have to force myself to ignore the feeling of “just a drop in the ocean”, ignore whether I feel like other people are free-riding on me, and just do it. Pledging to donate money (and then figuring out what to do with it later) ensures I will take that effort, and not end up with revealed preferences that seem ridiculous in light of my values.
Patronage and performance in the Age of Sail
Science and Technology links (September 7th 2019)
- In a small clinical trial, scientists administered some “anti-aging” therapies to people between their fifties and sixties. They used growth hormone to regenerate the thymus, part of our immune system which is nearly all gone when people reach 50 years old. They complemented this therapy with anti-diabetes drugs (dehydroepiandrosterone and metformin) as an attempt to compensate for the fact that growth hormone is pro-diabetic. The researchers found that in a majority of the participants, the thymus was indeed regenerated: to my knowledge, this is a breakthrough in human beings (we only knew that in worked in animal models). Further, using an epigenetic clock, they found that participants’ biological age was reversed, by 2.5 years on average. The result persisted six months after stopping the trial. The surprising results should be viewed with caution given that it was a small trial with no control. Nevertheless, to my knowledge, it is the first time that biological aging has been reversed in human beings following a supervised therapy. The article is short and readable. (Source: Nature)
- Researchers found out how to edit large pieces of DNA, making it potentially easier than before to construct synthetic genomes. (Source: Science)
-
Mathematician Hanna Fry on statin drugs:
Of a thousand people who take statins for five years, the drugs will help only eighteen to avoid a major heart attack or stroke.
- Chronological aging (how many years you lived) and biological aging (loss of fitness with time) differ. There is apparently a tendency for human beings to biologically age slower. The trend was confirmed between 1988 and 2010. Older men benefited most from this trend. I do not think that we fully understand this phenomenon.
- A woman received a cornea made from reprogrammed stem cells.
- Drones are used in China to spray insecticides more efficiently than farmers can.
- If you go Harvard University, you will have access to the best teaching and best professors, won’t you? Not so fast write Hacker and Dreifus:
At Harvard, even untenured asssistant professors get a fully paid year to complete a promotion-worthy book. Thus in a recent year, of its history department’s six assistant professors, only two were on hand to teach classes. In Harvard’s department of philosophy that same year, almost half of its full-time faculty were away on sabbaticals. Of course it was the students who paid. Many of their undergraduate courses were canceled or given by one-year visitors unfamiliar with the byways of the university.
Harvard undergraduate students give their professors C- on classroom performance.
- Regarding anxiety, no psychological interventions had greater effects compared with placebo.
- Men who are avid consumers of pornography are no more sexist or misogynistic than the general public. In fact, pornography users hold more gender egalitarian views.
- A new drug was developed quickly using deep learning.
- A software program can pass an 8th grade science test.
- Our cells can replicate only so many times before their telomeres are too short. To keep on dividing, cells must use an enzyme called telomerase. It was believed until now that, except for cancer, most of our cells (somatic cells) did not use telomerase. It appears that this belief is wrong: when our cells have short telomeres, they will sometimes use telomerase to protect themselves.
How Robert Morgenthau Cleaned Up New York

How (and Why) to KISSASS
On June 29, the New York Times published an essay entitled “I’ve Picked My Job Over My Kids,” in which lawyer and law professor Lara Bazelon wrote movingly about her professional life, how much personal satisfaction she derives from it, and how it gives meaning to her days. In fact, she likes her job so much that she often misses out on important milestones in her children’s lives—several birthday parties, two family vacations, three Halloweens, and so on. “I prioritize my work because I’m ambitious and because I believe it’s important,” Bazelon wrote. “If I didn’t write and teach and litigate, a part of me would feel empty.”
In January, Meghan Daum, a columnist for the L.A. Times and a teacher at Columbia University, told an interviewer, “Even now when I teach there’s just something about it. When I’m in the classrooms, I feel like this is where I’m meant to be.” Back in 2012, Jeff Bercovici wrote an article for his employer, Forbes magazine, entitled “Here’s Why Journalism Is The Best Job Ever,” in which he raved about the benefits of his profession: you get paid to read a lot; you get paid to meet interesting people, etc. Mainstream publications are full of essays by academics, doctors, lawyers, journalists, pastors, actors, musicians, and others in prestigious professions who want us to know how much they love their jobs. And the media love to report on how happy college-educated elites are with their professional lives. But for some reason they don’t much like to hear about non-professionals who are happy with their working lives.
On July 19, Quillette published an essay in which I wrote favorably about my job at an Amazon warehouse in West Sacramento, CA, where I spend my days unloading large trucks and helping to load delivery vans. I wrote that I enjoy the work and the atmosphere of the warehouse, like most of my co-workers, and am happy with the wage I am paid. Much of the reaction to that piece consisted of accusations that I was a sycophant, a corporate stooge, or that I was trying to impress Jeff Bezos, the founder and CEO of Amazon, a man I’ve never met and never expect to meet.
A few days after my essay appeared, New York magazine published a reply by staff writer Max Read sarcastically entitled: “America Should Thank Amazon For Giving Workers The Chance To ‘Chant Prime Day Slogans.’” Read didn’t bother to engage in a serious way with my points, and much of the negative feedback on social media was similarly long on haughty derision and short on substance. Amazon, presumably happy to be getting a bit of positive press for a change, posted a link to my article on its various social media platforms, but removed those links after they attracted a deluge of abuse. I have to say that I wasn’t entirely surprised by the reaction my essay provoked.
I’ve been writing personal essays for publications in my hometown for more than 30 years. For 12 years I wrote a column for a monthly magazine here in town. My pieces were mainly upbeat stories about my marriage, my kids, my grandchildren, my hobbies, my youth, and so on. I never had much trouble finding a local market for upbeat musings about my life as a working-class stiff. But finding a national market for such stories proved nearly impossible. I didn’t land a personal essay in a prominent national publication until 2007, when the New York Times published a story I wrote about my marriage in its Modern Love column.
The essay was a huge hit. The Times forwarded me requests from a couple of different Hollywood producers who had inquired about the film rights to the piece (alas, no film deal ever emerged). The Times also forwarded me numerous emails from people who had enjoyed it (this was before readers were allowed to comment on articles online). I enjoyed this attention so much that I began sending out personal essays to all sorts of large regional and national publications. None of these essays found a home until, finally, the San Francisco Chronicle accepted a piece I had written about shopping malls.
In an effort to figure out what had differentiated the Modern Love essay and the shopping mall essay from the vast majority of my writing, I finally hit upon the key to successfully placing an essay about working-class life in a prominent American publication. You’ve probably seen the acronym KISS, which stands for Keep It Simple, Stupid. It’s a useful mantra in numerous fields of endeavor, including engineering, product development, political debate, advertising, and strategic planning. Well, if you’re not a member of the professional class, the key to getting your personal essays published in prominent publications is KISSASS—Keep It Short, Sad, And Simple, Stupid.
Although my marriage has been an amazingly happy and successful one, my essay for the New York Times‘s Modern Love column was a wistful rumination on one of my few marital regrets—that I’ve never been the breadwinner in my family. My wife has always been the primary earner. My wife’s ex-husband is aware of this failing of mine, and for years he has seemed to be waiting for my wife to toss my low-earning butt out the door and take him back (he’s long regretted the divorce). Likewise, the piece about shopping malls dealt in part with the fact that my wife and I lived for a long time in scorching hot northern California in homes with no air-conditioning, and so we often sought out the comfort of shopping malls on hot evenings, sitting on sofas in the artificially cooled common areas, reading books and playing cards while waiting for the outside temperature to drop enough to make our living room at home slightly more bearable.
As soon as I embraced KISSASS as my motto, I began to sell personal essays to a variety of national venues. In 2008, during the economic collapse, I wrote an essay about my fear of losing my house to foreclosure that was broadcast on the American Public Radio program Marketplace. My wife and I managed to stave off foreclosure, but we did it by renting a space in an antiques collective and selling off much of what we owned. An essay I wrote about this was broadcast on NPR’s MorningEdition program. I found it was fairly easy to get prestigious venues to publish personal essays about the life of a working-class nobody so long as the tone was melancholy, or even depressing. Soon I was looking for the cloud inside of every silver lining. I began combing through my memories, looking for sad things to write about.
The problem is that sadness isn’t my natural setting. I grew tired of writing cheerless essays about my sorry lot in life. I went back to writing in my usual mode, and sold my pieces mainly to small local publications, which had fewer qualms with upbeat stories about Sacramento living.
It’s all right for successful, college-educated professionals like Lara Bazelon, Jeff Bercovici, Meghan Daum, and others to write about how much joy their working lives bring them. The people who edit the publications in which such articles appear are themselves college-educated professionals. They too probably enjoy their upper-middle-class lives. To my knowledge, when Bercovici wrote positively about his happy experience as a Forbes staff writer, no one accused him of sucking up to Steve Forbes, the magazine’s owner and publisher and a man whose net worth is estimated to be north of $400 million. When Meghan Daum enthuses about her work at Columbia University, no one accuses her of shilling for an institution with an endowment of more than $10 billion. Lara Bazelon has written for the Washington Post, which, like Amazon.com, is owned by Jeff Bezos. But as for as I know, no one has accused her of shilling for him.
But for working-class people, the rules are different. All those upper-middle-class professionals who edit the nation’s most prominent publications permit only one narrative when it comes to the toiling masses. Their lives are nasty, brutish, and short, and must always be portrayed as such. To publish a story about a person who enjoys working at Wal-Mart or Starbucks or Georgia Pacific or Amazon is considered tantamount to white-washing the horrific crimes (whatever those may be) of oligarchs such as the Walton family, Howard Schultz, the Koch brothers, or Bezos.
If you read about a working stiff in the pages of the New York Times, you’re almost certain to find it a downbeat experience. The working class in America are burdened with long hours of hard work for miserable pay. Which is why they are all so angry all the time. Or hooked on anti-anxiety medication. It’s why they are prime targets for populist nationalists like Trump. That, at least, is the conventional wisdom. This type of journalism becomes a self-replicating phenomenon. So that when a publication does run a rare story in which a working-class lunkhead claims to actually like working for Amazon, and claims to actually enjoy his life, the mainstream media treat it as a kind of betrayal. So, if you don’t have a professional degree and you hope to sell freelance personal essays to prestigious publications, take my advice and KISSASS.
Kevin Mims is a freelance writer living in Sacramento, CA. His work has appeared in numerous venues including the New York Times, National Public Radio’s Morning Edition, Salon, and many others. You can follow him on Twitter @KevinMims16
The post How (and Why) to KISSASS appeared first on Quillette.
Everything You Don’t Know About Mass Incarceration

School Busing: Yes, It’s Personal
This is personal for me. When you hear these words uttered by a political candidate, what do you expect will follow? If you are closer in age to Joe Biden than to Kamala Harris, you will likely expect a reasoned argument, or perhaps an anecdote intended to show that the candidate has hands-on experience with a certain issue. If you are closer in age to Harris, these same words will likely translate as, This my turf, not yours! You cannot possibly know anything about it, so get the hell off! And what follows will be a fierce proprietary claim, not just to a particular identity but to exclusive, authentic, unassailable, nontransferable knowledge of everything associated with that identity, whether or not the person actually possesses such knowledge.
Case in point: during the second presidential debate on June 27, Biden and Harris had a testy exchange about school busing, a topic that was a very hot potato half a century ago but has long since become a very cold spud. Why did Harris decide to re-heat it? Is she planning to make school busing a key proposal in her campaign? Or was that cold potato the only vegetable she could find to hurl at the white guy who served alongside America’s first African-American president? I suspect it was the latter, and there is no denying that it worked. For an entire news cycle (which now means about 15 minutes) the Twittersphere was deeply divided on the issue of whether school busing is an effective remedy for racial inequality.
For the record, I do not question Harris’s assertion that she benefited from Berkeley’s decision to bus students from the lower-middle-class neighborhood in the western flatlands to an upper-middle-class school in the eastern hills. Nor do I dispute her self-identification as African American, although it does strike me as odd that racial identity and sexual preference must now be regarded as inborn and indelible, while biological sex is celebrated as a matter of free choice.
As for Biden, I do not think it is entirely his fault that the media describe him as coming from a blue-collar background. After all, it took me almost five minutes on Google to learn that his father started out as a salesman, then worked his way up to executive, co-owner of a small airport, and sales manager for car dealerships and real-estate firms. By the time a reporter did that, the news cycle would be almost over.
But I do object to all the sloppy rhetoric that went flying around after the debate. And here’s why. School busing is personal for me, too.
A few decades ago, I conducted a natural experiment in what today might be called the intersection of race, class, and public education. I use the word experiment because it was in vogue at the time. My experiment was conducted in three stages, and in each, I learned a different lesson.
The first stage was a master’s program in urban education at the University of Pennsylvania, in which I enrolled after college—not because I had always dreamed of being a teacher but because I was obsessed with race. The word woke was not known to me at the time, though its African-American roots are deep. But woke is what I was trying to be, the only imaginable alternative being a white racist.
I chose the Penn program because it was “experimental,” meaning no formal courses in education. Instead, I and a dozen other well-meaning college grads were given sink-or-swim placements in a half-dozen “experimental” schools around Philadelphia. Mine was in the Free School, a mini high school housed in a Chestnut Street storefront near the Penn campus. All but one of the teachers were white, and all but two of the 50 students were black. The students were also quite motivated, their parents having sought out this alternative to the overcrowded chaos of West Philadelphia High. The head teachers, both white, had taught in “the system” and were committed to freeing the students from its rigid routines and cramped, irrelevant curriculum. I was in total agreement, having read Jonathan Kozol’s exposé of the Boston public schools, Death at an Early Age, and adopted its radical view that the system was deliberately destroying black youth.
My best friend in the program was Diane, a working-class Italian American from western Pennsylvania who taught math at a different school called Parkway. Diane considered the Free School a bit flaky, and it didn’t help when I sang the praises of “experimental” courses such as “Police-Community Relations,” “ESP and Parapsychology,” and “Making Sense of Your Senses.” To my defense of these courses as fun and relevant while also imparting basic skills, Diane looked dubious, and remarked that there were a lot of ways to teach math, but she had never found one that did not require more work than fun.
I might never have seen Diane’s point if the students in the Free School hadn’t staged a walkout. At ten o-clock on a sunny October morning, they rose from their seats en masse and marched out onto the sidewalk, where they declared their intention to picket the Free School until it started teaching “real” courses instead of “hippie” ones. This came as a shock to me, because my own memories of high school were singularly lacking in the vitality and din of the Free School, where great funky music was always playing somewhere, and every class was enlivened by the students’ quick wit and abundant street smarts.
I had noticed that when it came to doing the actual assignments, those same witty, street-smart students bubbled—indeed, effervesced—with excuses. But not until the frank discussions that followed the walkout did I begin to see the problem. The star students could handle the fun, relevant assignments, but because they were stars, they wanted a more serious curriculum. Meanwhile, the majority were bright and eager, but lacking in the necessary skills, and none of the teachers wanted to admit that what these students really needed was dull, boring remedial instruction. The Free School was supposed to be experimental, not remedial.
For me, the Free School was highly instructive in a subject the students did not need to study: soul. Soul had been part of African-American culture since Day One, but I had only discovered it in college, where I made my first black friends and gained my first exposure to the music called by that name. Soul was style, crackling energy, spiritual electricity—the quintessence of blackness and the opposite of everything stolid and repressed about my own upbringing in an affluent WASP suburb of Boston. I knew I would never have soul in a true sense, but I wanted to tap into just enough of it to jolt other white people out of their racist stupor.
I soon got the chance. After my year at the Free School, I was hired as one of four teachers in an even more experimental program called Sidetrack, an outgrowth of a Boston-based program called METCO (Metropolitan Council for Educational Opportunity), which since 1966 had been busing students from Roxbury and other black neighborhoods out to white suburban schools—on a purely voluntary basis. By 1971 METCO was spending nearly $2 million to bus 1,600 black students to 30 suburban schools and had a waiting list of 1,300.
The next step, according to a group of educators in the wealthy town of Lincoln, was to obtain a grant under Title III of the federal Elementary and Secondary Education Act, passed in 1965. Title III was devoted to “innovative projects,” and that was just what the Lincoln folks had in mind. As argued in their proposal, METCO did not go far enough, because it failed to address the “major environmental imbalance [that] results from insulated urban and suburban ghettos where racial prejudices are left unchallenged and unchanged.” As a remedy, Sidetrack would bus black students from Roxbury out to Lincoln, while at the same time busing white students from Lincoln into Roxbury.
This plan had a marvelous symmetry. There would be two classrooms, one in the Lewis Middle School in Roxbury, and the other in the Brooks Middle School in Lincoln. Each classroom would have two teachers, one of each race, and 30 students, 15 of whom would be bused from the other school. Halfway through the year, the two classes would switch locations, and the students who had been attending Sidetrack in their home school would now get bused to the alien one. One reason why the plan struck a responsive chord in me was that Lincoln bordered on Weston, the town where I grew up. I looked forward to the day when the Sidetrack soul train would pull into Lincoln with me riding shotgun.
It did not work out that way. The story is long, and I am not the heroine. Suffice it to say that I began the year in Lincoln, attempting with my co-teacher, a charismatic math teacher named Morris, to cope with the daunting challenge of reconciling Sidetrack’s contradictory goals. The first goal, set forth in the proposal and emphasized by the Lincoln sponsors (who controlled the money) was to foster “positive cross-cultural changes” and help suburban kids “relate to every variety of humankind in myriad situations.” The second goal, emphasized the Roxbury sponsors, was to give the urban kids a high-octane academic boost.
It was unclear how we were supposed to pull this off, because most of the Roxbury students were one or two full grades behind their Lincoln counterparts. What we did, messily but not unsuccessfully, was individualize the lessons, so that on any given day, the two nerdiest boys from Lincoln would spend an hour doing their schoolwork and the rest of the time building catapults out of pipe cleaners; while the four hippest Roxbury students would solve ten math problems in exchange for permission to play music and teach each other the latest dance step. This approach did not produce instant racial harmony. On the contrary, the students quite often made pungent comments about each other that got everyone so riled up, Morris and I would take them all outside for a quick game of soccer.
By December we were making progress, but the optics were not good. Our classroom and activities were being monitored by the Lincoln sponsors, and they did not like what they saw. Warnings were issued, and on the eve of Christmas vacation, I was summoned to the superintendent’s office and fired. It seemed obvious why the Lincoln sponsors fired me and not Morris. He had more leverage, by virtue of his sex and color, and I was just another white liberal who for reasons of her own treated other white people as soul-deficient. That made me eminently dispensable.
What happened next was remarkable. Morris refused to accept the decision, and immediately launched a letter-writing campaign among the students—and, more important, among the Roxbury sponsors. It would be nice to report that the black parents and educators of Boston were outraged at losing me, but that was not really the point. The point, which Morris kept alive throughout the holidays, was that the Roxbury sponsors had not been consulted. In January they met and decided to flex some political muscle. Lincoln may control the purse strings, they said, but the right to hire and fire resided equally with them. To drive home the point, they voted to reinstate me.
But Sidetrack never recovered. The federal grant called for a second year, but that spring, plans were made to downsize it to a six-week “student swap,” and the ambitious language about “positive cross-cultural exchanges” got deleted. As for academic achievement, that sore topic was postponed till the summer, when all 60 students were tested. As it turned out, neither Roxbury’s hopes nor Lincoln’s fears were realized. In each school, the scores of the Sidetrack students were roughly the same as those of their non-Sidetrack peers. It was too late to argue that the students had learned valuable lessons not included in the tests. The program was kaput.
A couple years later, Morris took a graduate course for which he wrote a paper about Sidetrack. In that paper, with no ill intention, he held a mirror up to me. I will never forget what that mirror revealed:
Martha came from a setting very similar to Lincoln and was anxious to demonstrate to Lincoln people that her allegiance was not with them but elsewhere. She was much more outspoken than I against the values and attitudes Lincolnites brought to the program. In large measure, she was rejecting all that Lincoln stood for. Nonetheless, the question remains as to whether she realized that, in so completely rejecting Lincoln, she was also rejecting much of who she was. That unfortunate detail did not escape the attention of all of us even at the time; it certainly did not escape the attention of all of the students. That, however, would be another study in itself.
The third stage of my experiment was a two-year stint in the Achievement School, a remedial program for underachieving middle-school boys, housed in Rindge Tech, an all-male vocational high school in Cambridge, Massachusetts. A few years later Rindge would merge with Cambridge Latin, the city’s academic high school. But when I taught there, it was a demoralized and demoralizing place, with poor attendance and shabby facilities, known mostly for the prowess of its basketball team.
This was the first time I taught students who were not in my classroom voluntarily, and the differences were palpable. It was not unusual to walk down the corridors of Rindge and see a student, or occasionally a teacher, being forcibly ejected from a classroom. The constant fighting, cursing, and yelling assaulted my ears, and I grew to hate the sound of my own shrill voice trying to make itself heard. Rindge is only a few blocks from Harvard, but the tough, often troubled youth filling its halls were not the sons of academics but of blue-collar and welfare families in what was still then a working-class city.
All of this was new, but what struck me most forcefully was the presence of whites. Along with the African Americans I was used to, there were West Indians, Puerto Ricans, Dominicans, and Cape Verdeans—as well as Irish, Italians, Greeks, and other white ethnics, many from fatherless families in the East Cambridge housing projects. And the most unruly and unreachable ones came in all colors.
This is where I found myself in the strained atmosphere leading up to the Boston busing crisis. In 1965, the state had passed a bill, the Racial Imbalance Act, which classified as “racially imbalanced” any public school that was more than 50 percent non-white. The bill had been pushed through the legislature by a coalition of black and white citizens concerned about discrimination in the Boston public schools. But as noted by its many critics, the vast majority of whites who supported the bill lived in the surrounding suburbs and adjacent cities like Brookline and Cambridge, where its provisions did not apply. Instead, the bill applied to Irish and Italian enclaves like Charlestown, Dorchester, and South Boston, where the memory of class and religious discrimination by Boston’s Brahmin elite had not faded.
The same was true of the June 1974 court order handed down by Federal District Judge W. Arthur Garrity. Like the Racial Imbalance Act, this court order focused exclusively on the legal municipality of Boston, as opposed to the larger and generally more affluent metropolitan area. This meant that the buses would carry students from the city’s poor and predominantly black neighborhoods into its poor and predominantly white neighborhoods. Not surprisingly, this opened deep fault lines, not just between black and white but between white and white.
I felt this acutely, because most of my white liberal friends were so supportive of the court order, they could scarcely contain themselves. Indeed, every discussion of the topic turned into a contest over who could most strenuously denounce the anti-busing groups. I was no fan of those groups—for example, I was disgusted by the way ROAR (Restore Our Alienated Rights) copied the tactics of the civil rights movement while carrying picket signs saying “NIGGERS SUCK.” But I was repelled by my peers’ flamboyant loathing. And as for the radicals still active in Boston and Cambridge, they had long since gone off the deep end: Maoists and anti-Maoists squabbling over whether to mount an armed invasion of South Boston. (I’m not making this up.)
Yet neither was there refuge in the mainstream. The Boston Globe insisted on treating court-ordered busing as a public works project similar to cleaning up the Harbor, duly voted upon by a majority of citizens and guaranteed to create a more pleasant and healthful environment for future generations. Given the obvious class dimension of the conflict, this bland managerial optimism struck me as the height of hypocrisy. In this respect, if not others, I empathized with the angry working-class whites whose expressed political will was being circumvented by an unaffected, hypocritical elite.
I also doubted whether the educational problems of the poor were best addressed by starting a race war. The slogan “racial balance” stuck in my craw every time I walked into Rindge Tech: there was plenty of racial balance there, but what difference did it make? I did not buy the proposition that black children could not learn unless they went to school with whites. On the contrary, my Sidetrack experience had made me sympathize with, if not fully support, the black separatist impulse to educate black children in a setting that keeps the mostly hostile, sometimes patronizing white world at a distance.
My friend Morris acknowledged these anti-busing points but insisted that the issue was political. The schools had to be integrated, he said, not for integration’s sake but to force the Boston School Committee to equalize resources. “Green follows white” was his motto, and in Boston there was plenty of evidence to back it up. The system was one of patent inequality, clearly evident in the conditions we had seen in the Lewis Middle School. A recipient of federal funds under Title I, the Lewis School that has served as a partner in Sidetrack was better off than most of the predominantly black schools in Boston. But that wasn’t saying much.
All of this left me pro-busing, but not for the usual reasons. If the court order was basically a bludgeon to crush the power of the school committee, then perhaps the federal court should call it by its right name and get the crushing over with? The only white person I could share this blunt opinion with was my new boyfriend Peter. I had met Peter through my Philadelphia friend Diane, and like her, he was from a blue-collar background. And while he was “political” in the sense of having protested the Vietnam War, worked with a Catholic youth group in rural Mexico, and done community organizing in Dorchester, he was not “political” in the sense of force-feeding his radical opinions to every human being he met. It is hard to convey how refreshing this was.
Peter lived in a group house in Cambridge, and one of his housemates was a recent graduate of Haverford, pursuing a joint degree in law and education at Harvard. Marc was keenly interested in the busing issue, but as I soon discovered, his chief concern was the narrowly legalistic one of whether city officials would in fact enforce “the law of the land.” I tried to engage Marc on what I saw as the larger political questions, but our conversations, while initially good-natured and leavened by Peter’s friendly ribbing of Marc as a bookworm lacking real-life experience, soon became tense. Marc’s big project at the time was drafting a “Bill of Rights for Public School Students” at the Harvard Center for Law and Education (where the busing litigation was also underway).
One evening while having dinner with Peter and his housemates, I asked Marc how he expected such a measure to get through the myriad of legislatures governing the nation’s public schools. He replied that it would not go through the legislatures, it would go through the courts. Then he explained that, in his view, the resulting policy would be implemented by placing a legal advocate in every school to litigate student complaints. I had consumed a fair amount of wine at that point, and at this prospect I felt a subversive ripple of mirth. A lawyer in every principal’s office? Envisioning how this scenario would play out in the Achievement School, I commented sarcastically how grateful my fellow teachers and I would be to have every rowdy kid and his brother represented by counsel.
Ignoring my sarcasm, Marc proceeded to make it clear that he was not about to compromise lofty principle for something as mundane as school discipline. From there the conversation degenerated. The more elevated Marc’s defense of my students’ constitutional rights, the more deliberately outrageous my assessment of their character—until I heard myself, say, in the deadpan absurdist style I had picked up from other teachers in Rindge, “Look, Marc. Here’s what you don’t realize. The only way to keep the little buggers in line is with a baseball bat!”
Peter laughed. His housemates did not. And it came to me in a flash: I was not a racist, but neither was I a guilty white liberal, much less the type of aggressive anti-racist that today is called “woke.” What I was, had no name. It still doesn’t. But in today’s insanely polarized environment, perhaps we should give it one.
The post School Busing: Yes, It’s Personal appeared first on The American Interest.
The Real Ballot Question in South Africa: How to Keep the Country from Falling Apart
South Africa’s sixth election since the introduction of universal suffrage in 1994 takes place on May 8. It has been 25 years since the country cast off the moral abomination of apartheid. But the noble and worthy dreams that took flight in the era of Nelson Mandela have been crushed by reality. Indeed, the dreadful irony is that Afrikaner nationalists’ dire predictions about majority rule seem to have come true.
The country is in a parlous state: A recent Bloomberg report found that on a wide range of indicators, South Africa has done worse over the last five years than any other country in the world save those in a state of war. Corruption is rampant at every level, starting with the police. The power cuts that began in 2007 have gotten steadily worse. And although the government has managed to keep the lights on for the election campaign, the most optimistic forecast is another five years of intermittent supply. This in a country that, in 1994, had an oversupply of electricity at some of the cheapest rates in the world. Aggressive affirmative-action policies have seen the skilled and experienced whites who once ran the power stations dispersed around the world. In their place are many thousands more workers on higher salaries but without sufficient technical knowledge. Eskom, South Africa’s national power supplier, has a debt burden so large that it cannot even pay the interest on its debt, let alone the principal.
Unemployment, which stood at 3.7-million when the African National Congress (ANC) came to power in 1994, now stands at nearly 10-million, and recent data show that South Africa is the most unequal country in the world when it comes to income, consumption and wealth. To be sure, the architects of apartheid bequeathed a society that already was not only racist, but unequal. Yet the situation has become exacerbated by the rise of a vast, overpaid bureaucracy and a corrupt political elite. The program of state-mandated black “empowerment” requires that companies effectively give away equity to silent partners who have no function but to balance the racial books. Few companies are willing to invest on such terms, so even many fabulously rich mines have been closing down, with jobs being lost in the process. South Africa is now in its fifth consecutive year of falling real incomes.
Social unrest is rampant. More than 80 major public-works projects are stalled because they are besieged by local syndicates demanding a share of operating profits. A major cyclone hit the province of KwaZulu-Natal recently, killing 70. The response of local public-sector workers was to cut off water supplies to the wealthier suburbs and threaten electricity cuts, too, as a means to leverage the crisis to advance their own demands. The government, whose army and police force both have become ineffective in recent years, seems powerless to stop such behaviour, even if it wished to.
The election itself is a foregone conclusion. The ANC, which still leans heavily on its credentials as the anti-apartheid party of liberation, likely will win nearly 60% of the vote. Polls suggest that the liberal Democratic Alliance will lose ground and that the extreme-left populist Economic Freedom Fighters will double their vote. The ANC government already has committed itself to legislate the expropriation of property without compensation, the growth of a completely unaffordable national health service, and a variety of other populist policies. But even as it is , government debt is climbing toward 60% of GDP, and two credit-ratings agencies have consigned the country’s debt to junk status. The main teachers’ trade union now sells teaching jobs to the highest bidder—and intimidates or even kills those who expose such deals. Hospitals and schools have decayed below apartheid levels. In many cases, medicines and blankets are sold off by corrupt hospital staff. Throughout the country, small towns are collapsing because ANC municipal cliques have stolen the available funds, leaving local authorities unable to repair or replace dysfunctional infrastructure, which is why one can see sewage flowing in the streets.
Such a situation might seem to augur well for the country’s centrist official opposition, the Democratic Alliance, which has gained steadily over the last 25 years. But this time around, it chose a young and inexperienced leader, Mmusi Maimane, who has failed to energize black voters or even maintain the party’s existing mainly Asian, “Coloured” and white constituency. If the DA goes backwards on May 8, he could lose his job and the party would be thrown into turmoil.
Meanwhile, ANC leader Cyril Ramaphosa retains a 60% approval rating, and faces no viable rival within his party. He is an amiable and well-meaning man, but weak and quite unable to control the various ANC factions. Not only rank-and-file South African voters, but a good number of white businessmen (and even editorial writers at The Economist), placed high hopes on Ramaphosa following the 2018 resignation of Jacob Zuma. But there seems little prospect that he can fulfil such expectations. The ANC election list is studded with convicted criminals found guilty of grossly corrupt behaviour. These include Deputy President David Mabuza, the subject of a major New York Times exposé, and ANC Secretary-General Ace Magashule, the subject of a 2019 book entitled Gangster State: Unravelling Ace Magashule’s Web of Capture. (Magashule’s supporters stormed into bookshops to burn copies of the book, and Magashule has threatened to sue, though as yet there is no sign of a writ.)
In theory, Ramaphosa could be forced out of the ANC leadership by forces loyal to his corrupt predecessor, Jacob Zuma. But even Ramaphosa’s foes realize that his popularity is about all the ANC has left. Perhaps the best case scenario is that, having reaffirmed his mandate, Ramaphosa could have South Africa apply for an IMF bailout once the elections are over. But the ANC is ideologically opposed to this, knowing that such a move would mean structural reform and a war on corruption. So the more likely scenario involves the government seizing pension funds and whatever other lumps of capital it can find, or forcing financial institutions to buy government bonds, as a means to strong-arm its way out of the mess—even though this would simply accelerate capital flight and push away the foreign investment that Ramaphosa is desperate to attract.
Another possible scenario is more apocalyptic. The downward spiral may be so pronounced that an increasingly desperate political elite will throw all blame on whites and Asians (who represent 9% and 2.5% of the country respectively), setting off the sort of full blown meltdown witnessed under Robert Mugabe in Zimbabwe. I am far from the first journalist to muse about this, and such fears have been motivating large-scale emigration by skilled and wealthy members of both communities for years.
Another cataclysmic scenario: The government will continue to lose control of the country, leading to a breakup of South Africa into its component regional parts. Frans Cronje, head of the liberal Institute of Race Relations, foresees a future in which a small white and black middle class will continue to live in a prosperous bubble in a few of the bigger cities; while the countryside is ruled by rapacious chiefs, and the rest of urban South Africa is run by murderous gangs. Some would argue that we aren’t far from that now.
Finally, it should be noted that while South Africa’s legacy of apartheid makes it unique, it is dealing with the same problem of uncontrolled migration that afflicts other, far wealthier nations. Border control has broken down, with the result that millions of Zimbabweans, Malawians, Congolese and others have flooded into a country that already doesn’t have enough jobs. Polls show that massive majorities say there are too many foreigners in the country, and some sporadic outbreaks of xenophobic violence have broken out. The government is desperately embarrassed by this situation, but has no means of effectual response. There is a terrible risk of truly catastrophic scenes of violence against new arrivals.
Needless to say, this is not the South Africa that Nelson Mandela and a happy world greeted with enthusiasm in 1994. It always was asking a lot of the ANC elite to step into the ruling role following generations of institutionalized white supremacy. But they have done far worse than anyone expected. If Ramaphosa has the nerve to seize the situation after the election, force through major reforms and start throwing his corrupt colleagues into jail, the situation could still conceivably be saved in the long run. But that is asking an awful lot of a 66-year-old man who still seems trapped within old-style African nationalist platitudes. The sad truth is that he seems more likely to preside over my country’s continued decline into poverty and chaos than avert it.
W. Johnson is a British writer living in South Africa.
Featured image: South African anti-corruption protestors in Cape Town, South Africa, 2017.
The post The Real Ballot Question in South Africa: How to Keep the Country from Falling Apart appeared first on Quillette.
Her Loveliness Revealed
Can Autism be Cured via a Gluten Free Diet?
I’d like to share a story from a friend and her son–let’s call them Heidi and Sven.
Sven was always a sickly child, delicate and underweight. (Heidi did not seem neglectful.) Once Sven started school, Heidi started receiving concerned notes from his teachers. He wasn’t paying attention in class. He wasn’t doing his work. They reported repetitious behavior like walking slowly around the room and tapping all of the books. Conversation didn’t quite work with Sven. He was friendly, but rarely responded when spoken to and often completely ignored people. He moved slowly.
Sven’s teachers suggested autism. Several doctors later, he’d been diagnosed.
Heidi began researching everything she could about autism. Thankfully she didn’t fall down any of the weirder rabbit holes, but when Sven’s started complaining that his stomach hurt, she decided to try a gluten-free diet.
And it worked. Not only did Sven’s stomach stop hurting, but his school performance improved. He stopped laying his head down on his desk every afternoon. He started doing his work and responding to classmates.
Had a gluten free diet cured his autism?
Wait.
A gluten free diet cured his celiac disease (aka coeliac disease). Sven’s troublesome behavior was most likely caused by anemia, caused by long-term inflammation, caused by gluten intolerance.
When we are sick, our bodies sequester iron to prevent whatever pathogen is infecting us from using it. This is a sensible response to short-term pathogens that we can easily defeat, but in long-term sicknesses, leads to anemia. Since Sven was sick with undiagnosed celiac disease for years, his intestines were inflamed for years–and his body responded by sequestering iron for years, leaving him continually tired, spacey, and unable to concentrate in school.
The removal of gluten from his diet allowed his intestines to heal and his body to finally start releasing iron.
Whether or not Sven had (or has) autism is a matter of debate. What is autism? It’s generally defined by a list of symptoms/behaviors, not a list of causes. So very different causes could nonetheless trigger similar symptoms in different people.
Saying that Sven’s autism was “cured” by this diet is somewhat misleading, since gluten-free diets clearly won’t work for the majority of people with autism–those folks don’t have celiac disease. But by the same token, Sven was diagnosed with autism and his diet certainly did work for him, just as it might for other people with similar symptoms. We just don’t have the ability right now to easily distinguish between the many potential causes for the symptoms lumped together under “autism,” so parents are left trying to figure out what might work for their kid.
Interestingly, the overlap between “autism” and feeding problems /gastrointestinal disorders is huge. Now, when I say things like this, I often notice that people are confused about the scale of problems. Nearly every parent swears, at some point, that their child is terribly picky. This is normal pickiness that goes away with time and isn’t a real problem. The problems autistic children face are not normal.
Parent of normal child: “My kid is so picky! She won’t eat peas!”
Parent of autistic child: “My kid only eats peas.”
See the difference?
Let’s cut to Wikipedia, which has a nice summary:
Gastrointestinal problems are one of the most commonly associated medical disorders in people with autism.[80] These are linked to greater social impairment, irritability, behavior and sleep problems, language impairments and mood changes, so the theory that they are an overlap syndrome has been postulated.[80][81] Studies indicate that gastrointestinalinflammation, immunoglobulin E-mediated or cell-mediated food allergies, gluten-related disorders (celiac disease, wheat allergy, non-celiac gluten sensitivity), visceral hypersensitivity, dysautonomia and gastroesophageal reflux are the mechanisms that possibly link both.[81]
A 2016 review concludes that enteric nervous system abnormalities might play a role in several neurological disorders, including autism. Neural connections and the immune system are a pathway that may allow diseases originated in the intestine to spread to the brain.[82] A 2018 review suggests that the frequent association of gastrointestinal disorders and autism is due to abnormalities of the gut–brain axis.[80]
The “leaky gut” hypothesis is popular among parents of children with autism. It is based on the idea that defects in the intestinal barrier produce an excessive increase of the intestinal permeability, allowing substances present in the intestine, including bacteria, environmental toxins and food antigens, to pass into the blood. The data supporting this theory are limited and contradictory, since both increased intestinal permeability and normal permeability have been documented in people with autism. Studies with mice provide some support to this theory and suggest the importance of intestinal flora, demonstrating that the normalization of the intestinal barrier was associated with an improvement in some of the ASD-like behaviours.[82] Studies on subgroups of people with ASD showed the presence of high plasma levels of zonulin, a protein that regulates permeability opening the “pores” of the intestinal wall, as well as intestinal dysbiosis (reduced levels of Bifidobacteria and increased abundance of Akkermansia muciniphila, Escherichia coli, Clostridia and Candida fungi) that promotes the production of proinflammatory cytokines, all of which produces excessive intestinal permeability.[83] This allows passage of bacterial endotoxins from the gut into the bloodstream, stimulating liver cells to secrete tumor necrosis factor alpha (TNFα), which modulates blood–brain barrier permeability. Studies on ASD people showed that TNFα cascades produce proinflammatory cytokines, leading to peripheral inflammation and activation of microglia in the brain, which indicates neuroinflammation.[83] In addition, neuroactive opioid peptides from digested foods have been shown to leak into the bloodstream and permeate the blood–brain barrier, influencing neural cells and causing autistic symptoms.[83] (See Endogenous opiate precursor theory)
Here is an interesting case report of psychosis caused by gluten sensitivity:
In May 2012, after a febrile episode, she became increasingly irritable and reported daily headache and concentration difficulties. One month after, her symptoms worsened presenting with severe headache, sleep problems, and behavior alterations, with several unmotivated crying spells and apathy. Her school performance deteriorated… The patient was referred to a local neuropsychiatric outpatient clinic, where a conversion somatic disorder was diagnosed and a benzodiazepine treatment (i.e., bromazepam) was started. In June 2012, during the final school examinations, psychiatric symptoms, occurring sporadically in the previous two months, worsened. Indeed, she began to have complex hallucinations. The types of these hallucinations varied and were reported as indistinguishable from reality. The hallucinations involved vivid scenes either with family members (she heard her sister and her boyfriend having bad discussions) or without (she saw people coming off the television to follow and scare her)… She also presented weight loss (about 5% of her weight) and gastrointestinal symptoms such as abdominal distension and severe constipation.
So she’s hospitalized and they do a bunch of tests. Eventually she’s put on steroids, which helps a little.
Her mother recalled that she did not return a “normal girl”. In September 2012, shortly after eating pasta, she presented crying spells, relevant confusion, ataxia, severe anxiety and paranoid delirium. Then she was again referred to the psychiatric unit. A relapse of autoimmune encephalitis was suspected and treatment with endovenous steroid and immunoglobulins was started. During the following months, several hospitalizations were done, for recurrence of psychotic symptoms.
Again, more testing.
In September 2013, she presented with severe abdominal pain, associated with asthenia, slowed speech, depression, distorted and paranoid thinking and suicidal ideation up to a state of pre-coma. The clinical suspicion was moving towards a fluctuating psychotic disorder. Treatment with a second-generation anti-psychotic (i.e., olanzapine) was started, but psychotic symptoms persisted. In November 2013, due to gastro-intestinal symptoms and further weight loss (about 15% of her weight in the last year), a nutritionist was consulted, and a gluten-free diet (GFD) was recommended for symptomatic treatment of the intestinal complaints; unexpectedly, within a week of gluten-free diet, the symptoms (both gastro-intestinal and psychiatric) dramatically improved … Despite her efforts, she occasionally experienced inadvertent gluten exposures, which triggered the recurrence of her psychotic symptoms within about four hours. Symptoms took two to three days to subside again.
Note: she has non-celiac gluten sensitivity.
One month after [beginning the gluten free diet] AGA IgG and calprotectin resulted negative, as well as the EEG, and ferritin levels improved.
Note: those are tests of inflammation and anemia–that means she no longer has inflammation and her iron levels are returning to normal.
She returned to the same neuro-psychiatric specialists that now reported a “normal behavior” and progressively stopped the olanzapine therapy without any problem. Her mother finally recalled that she was returned a “normal girl”. Nine months after definitely starting the GFD, she is still symptoms-free.
This case is absolutely crazy. That poor girl. Here she was in constant pain, had constant constipation, was losing weight (at an age when children should be growing,) and the idiot adults thought she had a psychiatric problem.
This is not the only case of gastro-intestinal disorder I have heard of that presented as psychosis.
Speaking of stomach pain, did you know Curt Cobain suffered frequent stomach pain that was so severe it made him vomit and want to commit suicide, and he started self-medicating with heroin just to stop the pain? And then he died.
Back to autism and gastrointestinal issues other than gluten, here is a fascinating new study on fecal transplants (h/t WrathofGnon):
Many studies have reported abnormal gut microbiota in individuals with Autism Spectrum Disorders (ASD), suggesting a link between gut microbiome and autism-like behaviors. Modifying the gut microbiome is a potential route to improve gastrointestinal (GI) and behavioral symptoms in children with ASD, and fecal microbiota transplant could transform the dysbiotic gut microbiome toward a healthy one by delivering a large number of commensal microbes from a healthy donor. We previously performed an open-label trial of Microbiota Transfer Therapy (MTT) that combined antibiotics, a bowel cleanse, a stomach-acid suppressant, and fecal microbiota transplant, and observed significant improvements in GI symptoms, autism-related symptoms, and gut microbiota. Here, we report on a follow-up with the same 18 participants two years after treatment was completed. Notably, most improvements in GI symptoms were maintained, and autism-related symptoms improved even more after the end of treatment.
Fecal transplant is exactly what it sounds like. The doctors clear out a person’s intestines as best they can, then put in new feces, from a donor, via a tube (up the butt or through the stomach; either direction works.)
Unfortunately, it wasn’t a double-blind study, but the authors are hopeful that they can get funding for a double-blind placebo controlled study soon.
I’d like to quote a little more from this study:
Two years after the MTT was completed, we invited the 18 original subjects in our treatment group to participate in a follow-up study … Two years after treatment, most participants reported GI symptoms remaining improved compared to baseline … The improvement was on average 58% reduction in Gastrointestinal Symptom Rating Scale (GSRS) and 26% reduction in % days of abnormal stools… The improvement in GI symptoms was observed for all sub-categories of GSRS (abdominal pain, indigestion, diarrhea, and constipation, Supplementary Fig. S2a) as well as for all sub-categories of DSR (no stool, hard stool, and soft/liquid stool, Supplementary Fig. S2b), although the degree of improvement on indigestion symptom (a sub-category of GSRS) was reduced after 2 years compared with weeks 10 and 18. This achievement is notable, because all 18 participants reported that they had had chronic GI problems (chronic constipation and/or diarrhea) since infancy, without any period of normal GI health.
Note that these children were chosen because they had both autism and lifelong gastrointestinal problems. This treatment may do nothing at all for people who don’t have gastrointestinal problems.
The families generally reported that ASD-related symptoms had slowly, steadily improved since week 18 of the Phase 1 trial… Based on the Childhood Autism Rating Scale (CARS) rated by a professional evaluator, the severity of ASD at the two-year follow-up was 47% lower than baseline (Fig. 1b), compared to 23% lower at the end of week 10. At the beginning of the open-label trial, 83% of participants rated in the severe ASD diagnosis per the CARS (Fig. 2a). At the two-year follow-up, only 17% were rated as severe, 39% were in the mild to moderate range, and 44% of participants were below the ASD diagnostic cut-off scores (Fig. 2a). … The Vineland Adaptive Behavior Scale (VABS) equivalent age continued to improve (Fig. 1f), although not as quickly as during the treatment, resulting in an increase of 2.5 years over 2 years, which is much faster than typical for the ASD population, whose developmental age was only 49% of their physical age at the start of this study.
Important point: their behavior matured faster than it normally does in autistic children.
This is a really interesting study, and I hope the authors can follow it up with a solid double-blind.
Of course, not all autists suffer from gastrointestinal complaints. Many eat and digest without difficulty. But the connection between physical complaints and mental disruption across a variety of conditions is fascinating. How many conditions that we currently believe are psychological might actually be caused a by an untreated biological illness?
Age Gaps And Birth Order Effects
Psychologists are split on the existence of “birth order effects”, where oldest siblings will have different personality traits and outcomes than middle or youngest siblings. Although some studies detect effects, they tend to be weak and inconsistent.
Last year, I posted Birth Order Effects Exist And Are Very Strong, finding a robust 70-30 imbalance in favor of older siblings among SSC readers. I speculated that taking a pre-selected population and counting the firstborn-to-laterborn ratio was better at revealing these effects than taking an unselected population and trying to measure their personality traits. Since then, other independent researchers have confirmed similar effects in historical mathematicians and Nobel-winning physicists. Although birth order effects do not seem to consistently affect IQ, some studies suggest that they do affect something like “intellectual curiosity”, which would explain firstborns’ over-representation in intellectual communities.
Why would firstborns be more intellectually curious? If we knew that, could we do something different to make laterborns more intellectually curious? A growing body of research highlights the importance of genetics on children’s personalities and outcomes, and casts doubt on the ability of parents and teachers to significantly affect their trajectories. But here’s a non-genetic factor that’s a really big deal on one of the personality traits closest to our hearts. How does it work?
People looking into birth order effects have come up with a couple of possible explanations:
1. Intra-family competition. The oldest child choose some interest or life path. Then younger children don’t want to live in their older sibling’s shadow all the time, so they do something else.
2. Decreased parental investment. Parents can devote 100% of their child-rearing time to the oldest child, but only 50% or less to subsequent children.
3. Changed parenting strategies. Parents may take extra care with their firstborn, since they are new to parenting and don’t know what small oversights they can get away with vs. what will end in disaster. Afterwards, they are more relaxed and willing to let the child “take care of themselves”. Or they become less interested in parenting because it is no longer novel.
4. Maternal antibodies. Studies show that younger sons with older biological brothers (but not sisters!) are more likely to be homosexual. This holds true even if someone is adopted and never met their older brother. The most commonly-cited theory is that during a first pregnancy, the mother’s immune system may develop antibodies to some unexpected part of the male fetus (maybe androgen receptors?) and damages these receptors during subsequent pregnancies. A similar process could be responsible for other birth order effects.
5. Maternal vitamin deficiencies. An alert reader sent me Does Birth Spacing Affect Maternal Or Child Nutritional Status? It points out that people maintain “stockpiles” of various nutrients in their bodies. During pregnancy, a woman may deplete her nutrient stockpiles in the difficult task of creating a baby, and the stockpiles may take years to recover. If the woman gets pregnant again before she recovers, she might not have enough nutrients for the fetus, and that may affect its development.
How can we distinguish among these possibilities? One starting point might be to see how age gaps affect birth order effects. How close together do two siblings have to be for the older to affect the younger? If a couple has a child, waits ten years, and then has a second child, does the second child still show the classic laterborn pattern? If so, we might be more concerned about maternal antibodies or changes in parenting style. If not, we might be more concerned about vitamin deficiencies or distracted parental attention.
Methods And Results
I used the 2019 Slate Star Codex survey, in which 8,171 readers of this blog answered a few hundred questions about their lives and opinions.
Of those respondents, I took the subset who had exactly one sibling, who reported an age gap of one year or more, and who reported their age gap with an integer result (I rounded non-integers to integers if they were not .5, and threw out .5 answers). 2,835 respondents met these criteria.
Of these 2,835, 71% were the older sibling and 29% were the younger sibling. This replicates the results from last year’s survey, which also found that 71% of one-sibling readers were older.
Here are the results by age gap:

Birth order effects are strong from one-year to seven-year age gaps, and don’t differ much within that space. After seven years, birth order effects decrease dramatically and are no longer significantly different from zero.
I also investigated people who had more than one sibling, but were either the oldest or the youngest in their families.

More siblings = more problems more of a birth order effect, but the overall pattern was similar. There is a possible small decline in strength from one to seven years, followed by a very large decline between seven and eight years.
Here’s the previous two graphs considered as a single very-large-n sample:

The pattern remains pretty clear: vague hints of a decline from age 1 to 7, followed by a very large decline afterwards.
(Tumblr user athenaegalea kindly double-checked my calculations; you can see her slightly-differently-presented results here).
Weirdly, among people who reported a zero-year age gap, 70% are older siblings. This wouldn’t make much sense for twins, since here older vs. younger just means who made it out of the uterus first. I don’t know if this means there’s some kind of reporting error that discredits this entire project, whether people who were born about 9 months apart reported this as a zero year age gap, or whether it’s just an unfortunate coincidence.
These results suggest that age gaps do affect the strength of birth order effects. People with siblings seven or fewer years older than them will behave as laterborns; people separated from their older siblings by more than seven years will act like firstborn children.
Discussion
This study found an ambiguous and gradual decline from one to seven years, but also a much bigger cliff from seven to eight years. Is this a coincidence, or is there something important that happens at seven?
Most of the sample was American; in the US, children start school at about age five. Although it might make sense for older siblings stop mattering once they are in school, this would predict a cliff at five years rather than seven years.
Developmental psychologists sometimes distinguish between early childhood (before 6-8 years) and middle childhood (after that point). This is supposed to be a real qualitative transition, just like eg puberty. We might take this very seriously, and posit that having a sibling in early childhood causes birth order effects, but one in middle childhood doesn’t. But why should this be? Overall I’m still pretty confused about this.
These results may be consistent with an intra-family competition hypothesis. Children try to avoid living in the shadow of their older siblings, perhaps by avoiding intellectual pursuits those children find interesting. But if there is too much of an age gap, then siblings are at such different places that competition no longer feels relevant.
These results may be partly consistent with a parental investment hypothesis. Parents might have to split their attention between first and laterborn children, so that laterborns never get the period of sustained parental attention that firstborns do. But since an age gap as small as one year produces this effect, this would suggest that only the first year of childrearing matters; after the first year, even the firstborn children in this group are getting split attention. This is hard to explain if we are talking about as complicated a trait as “intellectual curiosity” – surely there are things parents do when a child is two or three to make them more curious?
These results don’t seem consistent with hypotheses based on changing parenting strategies or maternal antibodies, unless parenting strategies or the immune system “reset” to their naive values after a certain number of years.
They also don’t seem too consistent with vitamin-based hypotheses. I don’t know how long it takes to replenish vitamin stockpiles, and it’s probably different for every vitamin. But I would be surprised if giving people one vs. five years for this had basically no effect, but giving them eight instead of seven years had a very large effect. Overall I would expect the first year of vitamin replenishment to be the most important, with diminishing returns thereafter, which doesn’t fit the birth order effect pattern.
Overall these results make me lean slightly more towards intra-family competition or parental investment as the major cause of birth order effects. I can’t immediately think of a way to distinguish between these two hypotheses, but I’m interested in hearing people’s ideas.
I welcome people trying to replicate or expand on these results. All of the data used in this post are freely available and can be downloaded here.
What Company Has The Fastest Growing Revenue Per Employee?
References for my debate with Gary Taubes on The Joe Rogan Experience
This is a list of references I am likely to cite in my debate with Gary Taubes on the Joe Rogan Experience on March 19. During the debate, I’ll be calling out numbers corresponding to the references below. Scroll down to the number I mentioned to see the references for yourself.
Gary and I prepared a document explaining our models that you can download here. For context, I am favorable toward low-carbohydrate diets, but the references below mostly reflect issues that Gary and I are likely to disagree on.
The brain
1. The brain regulates body fatness
This is supported by a mountain of evidence going back 180 years. The brain, and particularly a non-conscious part of the brain called the hypothalamus, contains the only known system in the body that regulates body fatness. Damage to specific parts of the hypothalamus cause severe obesity or leanness in animals and humans, and experimentally controlling the activity of specific groups of neurons alters body fatness in animal models. See these review papers for an overview of some of what we know. I also give a lay-friendly overview of this research in my book The Hungry Brain.
Nearly all anti-obesity drugs that are currently approved by the FDA target the brain, including liraglutide, lorcaserin, phentermine/topiramate, and naltrexone/bupropion. The only exception is orlistat, which reduces dietary fat absorption in the gut. Interestingly, one of the most effective of these weight loss drugs, liraglutide, increases post-meal insulin secretion.
2. The genetics of obesity point to the brain, not fat cells or insulin, as the primary determinant of body fatness
Obesity risk is strongly influenced by genetics, and recent studies have begun to uncover the specific genetic differences that make some people fatter than others. This gives us the opportunity to see what these genes do, providing a window into the causes of common obesity. Results show that gene variants that impact body fatness are primarily related to brain function— not primarily insulin or fat cells (although many mechanisms may contribute to a smaller degree). Importantly, these (GWA) studies are unbiased because they examine the whole genome without preconceived notions about which genes or biological pathways might be important.
The largest and most recent study on the genetics of body fatness concluded that “[body mass index]-associated genes are mostly enriched among genes involved in neurogenesis and more generally involved in the development of the central nervous system.”
3. The brain regulates appetite
This should be obvious, because appetite is a motivational state that is generated by the brain– like all motivational states. In fact, we know so much about how appetite-regulating brain circuits work that researchers can turn appetite on and off at will by controlling specific types of neurons in animals. Here are a few review papers that give a broad overview of much of what we know. I give a lay-friendly overview of this research in my book The Hungry Brain.
4. The determinants of appetite are complex and cannot be reduced to glucose and insulin
The brain determines hunger and satiety by in response to signals it receives from inside and outside the body. From inside the body, the brain receives information about the body’s energy status. This comes from neural signals and hormones ascending from the small intestine, pancreas, liver, and fat tissue that tell the brain how much food is in the gut, what type of food it is, and how much fat the body contains.
From outside the body, the brain receives signals about what food cues surround you, and this can also stimulate hunger (think about smelling pizza). All of this information is integrated by the brain, which uses it to generate the overall feeling of hunger or satiety. For a review of some of the research on this see this paper.
5. Lean people, and people with obesity, both “defend” their current level of body fatness against fat loss
When people lose fat, their brains initiate a sort of “starvation response” that favors the regain of lost fat over time. This is familiar to most people who have dieted: increased hunger, more cravings, reduced metabolic rate, and eventual weight regain. This is the brain’s response to fat loss, regardless of whether a person starts off lean or with obesity. This suggests that the “setpoint” around which body fatness is regulated is increased in obesity, since the brain nonconsciously “defends” the obese state. This is one of the key reasons why weight loss is challenging and often temporary.
We know this effect is due to a decline in the fat-regulating hormone leptin during weight loss, because replacing leptin to the pre-weight-loss level largely prevents this “starvation response”. Therefore, the reason people with obesity “defend” a higher level of fat mass is that their brains require a higher level of leptin to feel like they aren’t starving.
6. Single-gene mutations that lead to obesity in humans act in the brain
A number of single-gene mutations have been identified that lead to severe obesity in humans and animals. These are all related to the brain systems that regulate body fatness, and particularly the fat-regulating hormone leptin. I’m not aware of any mutations in insulin or fat cell-related genes that cause obesity.
Calories
7. People with obesity eat, and expend, more calories than lean people
Studies using accurate methods consistently show that people with obesity eat, and expend, about 20-35 percent more calories than lean people, after correcting for height, sex, and physical activity level. Calorie intake and expenditure increase continuously in parallel with body weight. Since calorie intake is equal to calorie expenditure in a weight-stable person, measuring calorie expenditure is the simplest and most accurate way to demonstrate that intake and expenditure are both elevated.
8. Reducing the calorie intake of a person with obesity to that of a lean person causes weight loss
People with obesity consume about 20-35 percent more calories than lean people. Tightly controlled studies have demonstrated that restricting calorie intake by about this much in people with obesity causes rapid weight and fat loss, demonstrating that the elevated calorie intake is required to sustain the obese state.
9. Calorie intake, not carbohydrate intake, is the main dietary determinant of body fat loss
Several controlled feeding studies have compared the effect of calorie-restricted diets with different proportions of fat and carbohydrate on weight and fat loss. Fat loss is determined primarily by the number of calories in the diets, not the proportion of fat or carbohydrate, even when insulin levels differ substantially. This was confirmed by a recent meta-analysis (study of studies) of 20 studies, which concluded that “for all practical purposes ‘a calorie is a calorie’ when it comes to body fat”.
10. Changes in body fatness as a result of diet depend primarily on calorie intake, not carbohydrate intake
This was demonstrated by a meta-analysis (study of studies) of 20 tightly controlled studies in which people were fed diets that differed in carbohydrate and fat content, but not in protein or calorie content. In other words, same calories, different carb:fat ratio. Calorie-for-calorie, higher-carbohydrate diets led to slightly more body fat loss than higher-fat diets, but the difference was very small. The researchers concluded that “for all practical purposes ‘a calorie is a calorie’ when it comes to body fat.”
11. Energy expenditure (metabolic rate) is scarcely affected by differences in carbohydrate and fat intake
This was demonstrated by a meta-analysis (study of studies) of 28 tightly controlled feeding studies. Altering the proportion of carbohydrate to fat in the diet had very little impact on metabolic rate when calorie and protein intake were the same, although metabolic rate was slightly higher on higher-carbohydrate diets.
A recent study received a lot of attention for finding that a very-low-carbohydrate diet led to a higher metabolic rate (+209 kcal/day) than a low-fat diet in people maintaining weight loss. While this study was rigorous and innovative in many ways, some of the data it collected are clearly erroneous because they appear to break the first law of thermodynamics, which is physically impossible. Once the erroneous data are removed, the effect size shrinks, loses its statistical significance, and becomes similar to the other 28 studies that were conducted before it.
Carbohydrate, sugar, and fat
12. Low-fat, high-carbohydrate diets cause weight loss, even without deliberate portion control
The most rigorous study on this is the DIETFITS randomized controlled trial, which was partially funded by Gary Taubes’s organization NuSI. In 609 people, a whole-food low-fat diet resulted in 12 pounds (5.3 kg) of weight loss at one year, not significantly different from the 13 pounds (6.0 kg) of weight lost on a whole-food low-carbohydrate diet. Neither diet included advice to restrict calorie intake. The low-fat diet supplied about twice as much carbohydrate, and 1.5 times as much sugar, as the low-carbohydrate diet, although neither diet was high in sugar. It also had about twice the glycemic load.
Another study conducted at the University of Washington tested the effect of dietary fat restriction on calorie intake and body weight in 16 overweight people using very careful measurements. When they were transitioned to a low-fat diet (15%) and told to eat as much as they wanted, their daily calorie intake dropped by 291 calories and they steadily lost weight and body fat over a 12-week period, losing 8 lbs (3.8 kg) total. Importantly, their total carbohydrate intake increased from 253 grams per day to 318 grams per day. Here’s the graph showing daily calorie intake and weight change (circles = calorie intake, diamonds = weight):
A meta-analysis (study of studies) representing 16 low-fat diet studies also reported that low-fat diets without deliberate portion control cause weight loss.
13. A low-calorie diet composed almost entirely of refined carbohydrate, including sugar, causes substantial weight loss
This paper discusses 106 patients who lost an average of 140 pounds (64 kg) and improved their blood sugar control eating the “rice diet”, a diet composed almost entirely of white rice, fruit, juice, and white sugar. Here is a photo of one man before and after the diet, from the paper:
The weight loss version of the rice diet was low in calories, supplied over 200 grams of mostly refined carbohydrate per day, and patients also increased physical activity. This demonstrates that refined carbohydrate does not override the impact of calorie intake and physical activity on body fatness.
The rice diet was also effective for treating diabetes, whether or not it was calorie-restricted.
14. Dietary fat can be fattening in a variety of nonhuman species
A review paper on this topic states that “With few exceptions, obesity is induced by high-fat diets in monkeys, dogs, pigs, hamsters, squirrels, rats, and mice.” There are hundreds of studies demonstrating this, but the most conclusive one was published in 2018 by John Speakman’s lab. They fed five different strains of mice diets varying in fat, carbohydrate, and protein content and showed that body fatness was primarily linked to the amount of fat the mice were eating. Body fatness increased as dietary fat increased up to 60% of calories, and then body fatness declined as dietary fat increased further (this is consistent with other research showing that the very-high-fat, very-low-carb ketogenic diet promotes leanness in mice, as it does in humans). Diets high in sugar and refined starch were not particularly fattening. The takeaway is that the most fattening diet contains abundant fat and carbohydrate together, while diets at the extremes (very-low-fat and very-low-carb) are more slimming.
15. Dietary fat can be fattening in humans
This really depends on context, since low-carbohydrate, high-fat diets tend to be slimming relative to diets that are high in both carbohydrate and fat. Nevertheless, unrestricted diets rich in fat tend to lead to higher calorie intake and fat gain relative to unrestricted diets rich in carbohydrate. This seems to be related to the high calorie density and palatability of fat.
Overfeeding fat under controlled conditions also causes body fat gain.
16. Fat and carbohydrate are equally fattening when overconsumed
Two randomized controlled trials have reported the effect of overfeeding the same number of calories of high-carbohydrate vs. high-fat diets in humans, and both reported equal fat gain.
- Horton and colleagues increased the calorie intake of volunteers by 50 percent by adding only fat vs. only carbohydrate for 14 days under tightly controlled conditions, and measured changes in body fat mass using gold-standard hydrostatic weighing. After 14 days, both groups had gained 3.3 lbs of fat, despite higher insulin levels in the high-carbohydrate group. In the high-carbohydrate arm, most of the extra carbohydrate was refined starch and sugar. In the high-fat arm, most of the extra fat was dairy fat (cream, butter).
- Lammert and colleagues increased the calorie intake of volunteers by 1,194 calories per day for 21 days under tightly controlled conditions. Subjects were fed either a high-carbohydrate (78% CHO, 11% fat) or a high-fat (31% CHO, 58% fat) diet containing the same amount of calories and protein, and the researchers measured changes in body fat mass using gold-standard hydrostatic weighing. After 21 days, both groups had gained 1.8-1.9 lbs of fat.
17. Sugar intake has been declining for 20 years in the US and 50 years in the UK, while obesity and diabetes rates have risen
Here is a graph showing sugar intake and the obesity rate in the US between 1980 and 2013. The sugar data include all added sugars such as table sugar, honey, and high-fructose corn syrup, but not sugars naturally occurring in fruits and vegetables.
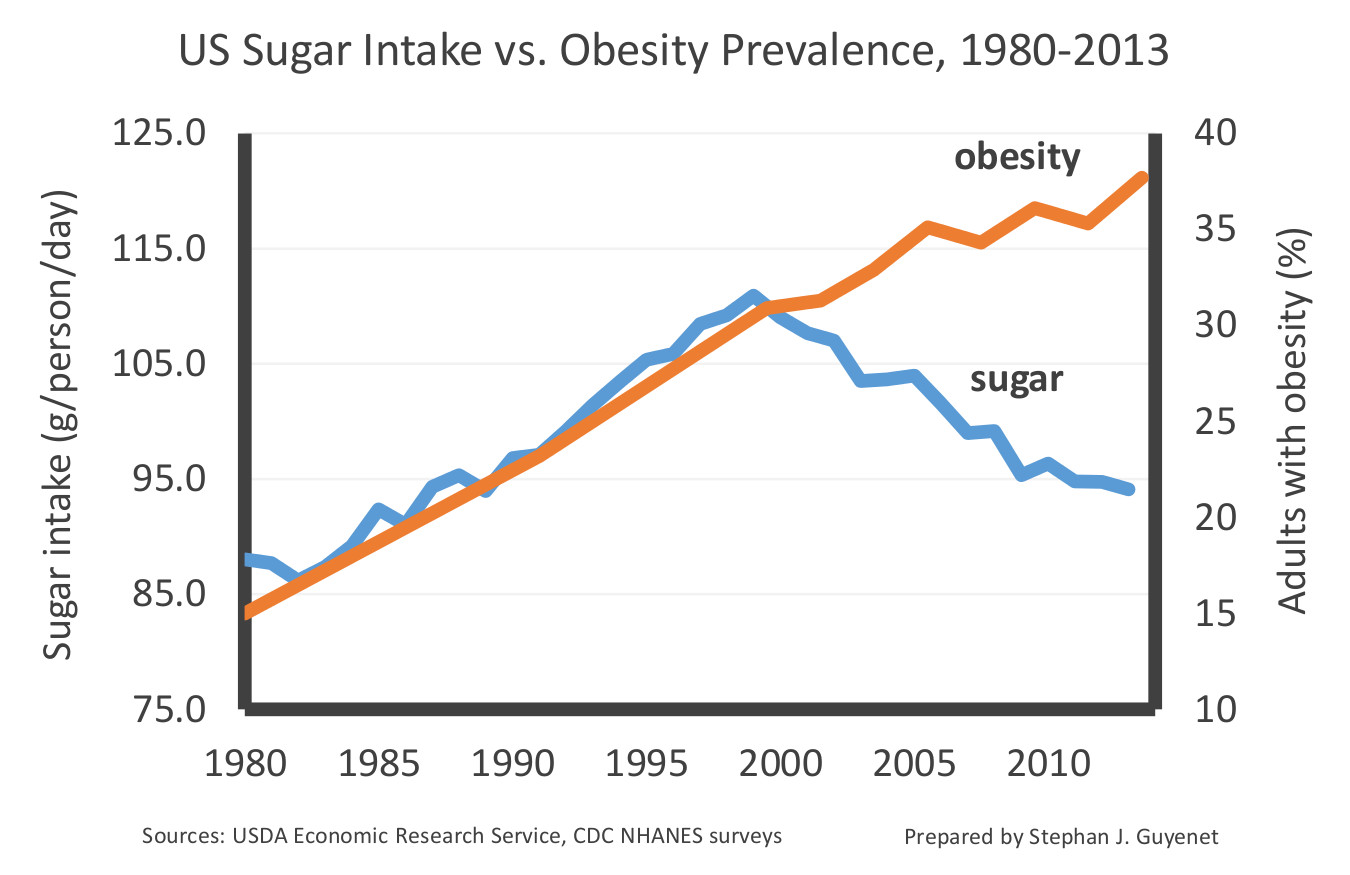
This graph illustrates the lack of correlation between sugar intake and obesity rates after 1999. This decline in sugar intake has been confirmed by several independent lines of evidence. The data suggest that sugar intake has dropped by 15-23 percent over the last two decades, primarily because people are drinking fewer sweetened beverages. Diabetes rates have also increased during the decline in sugar intake.
Overall carbohydrate intake has also declined over the last two decades in the US:
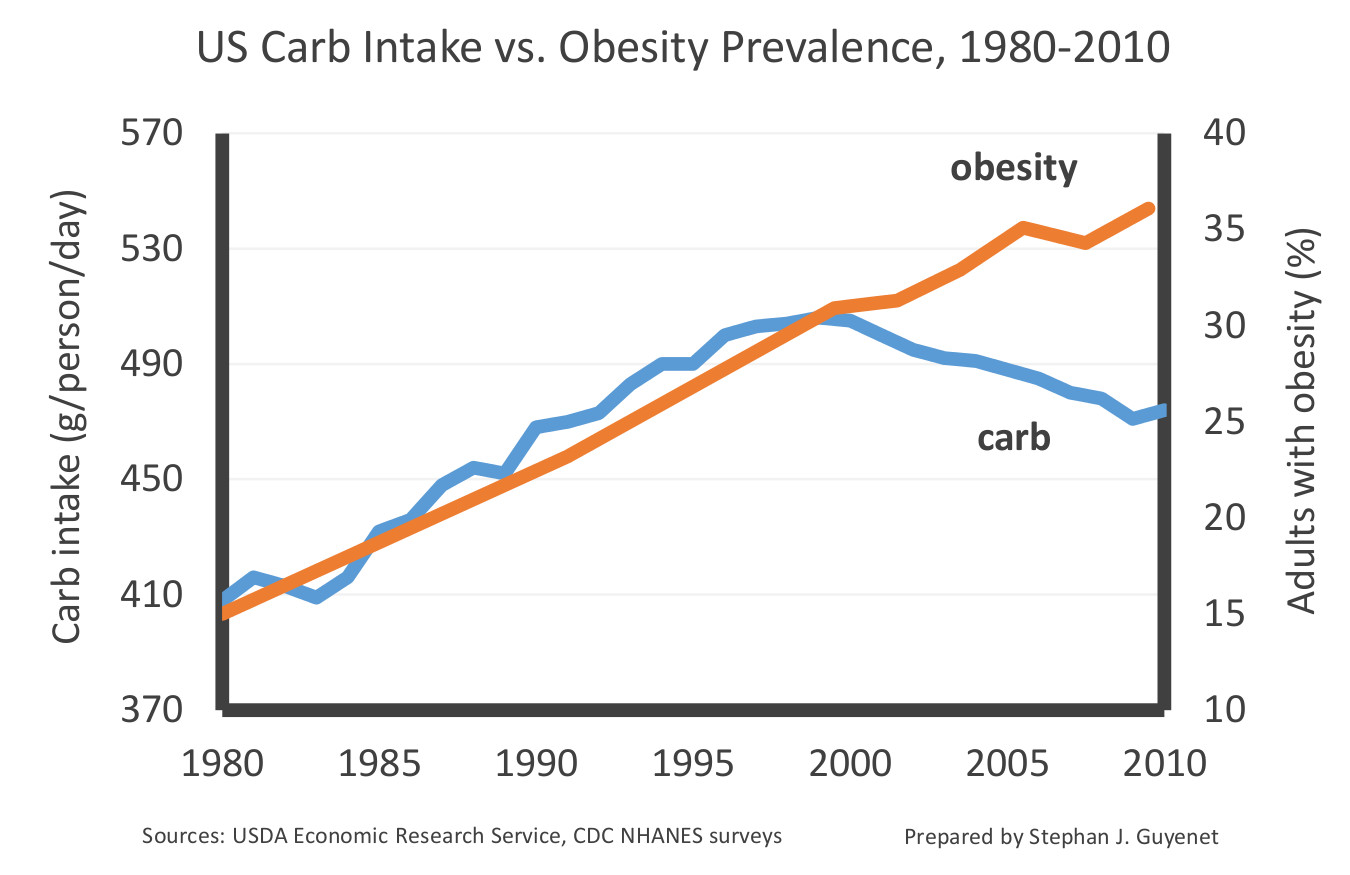
This graph shows that sugar intake has declined by 22 percent in the UK over the last 50 years, while obesity and diabetes rates have increased substantially (prepared by Kevin Bass):
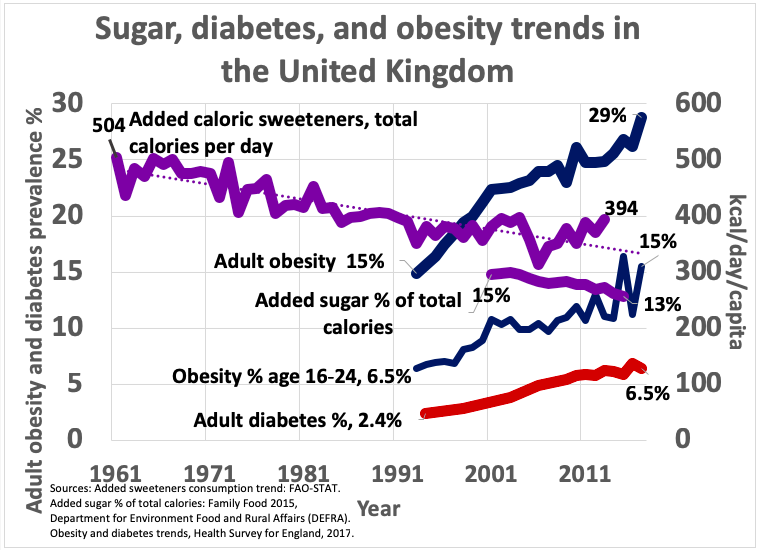
18. Carbohydrate, fat, and protein intake in the US over the last century
This graph represents absolute carbohydrate, fat, and protein intake in the US since 1909. It’s based on US Department of Agriculture data.
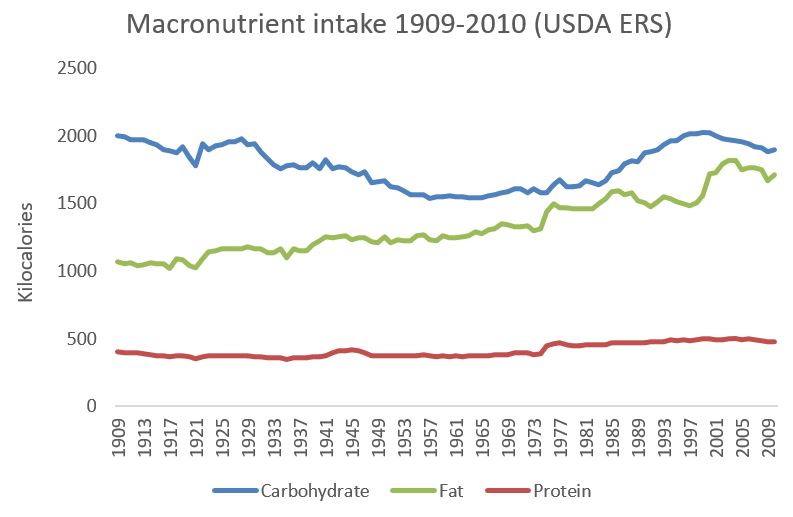
Note that fat is the only macronutrient that has consistently and substantially increased over time. Carbohydrate intake declined in the 1940s-50s, rose again in the 1980s-90s, and has been declining since 1999.
Here are the same data, represented as percentages of total calorie intake:
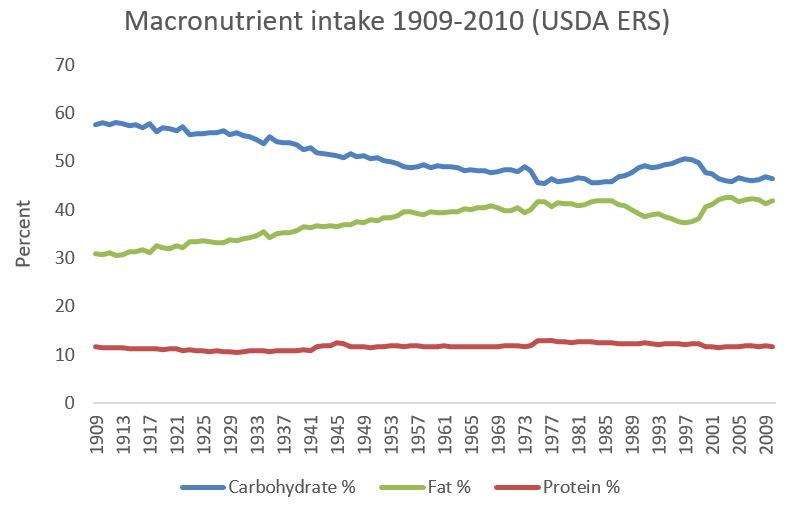
Aside from a little bump in the 1980s and 1990s, as a percentage of calories the US diet has progressively become higher in fat and lower in carbohydrate.
19. White flour intake was much higher in 1900 in the US than it is today
I downloaded this graph directly from the US Department of Agriculture website, although the web page I downloaded it from is no longer online. It speaks for itself. The large majority of this flour would have been refined, white flour from the late 1800s onward.
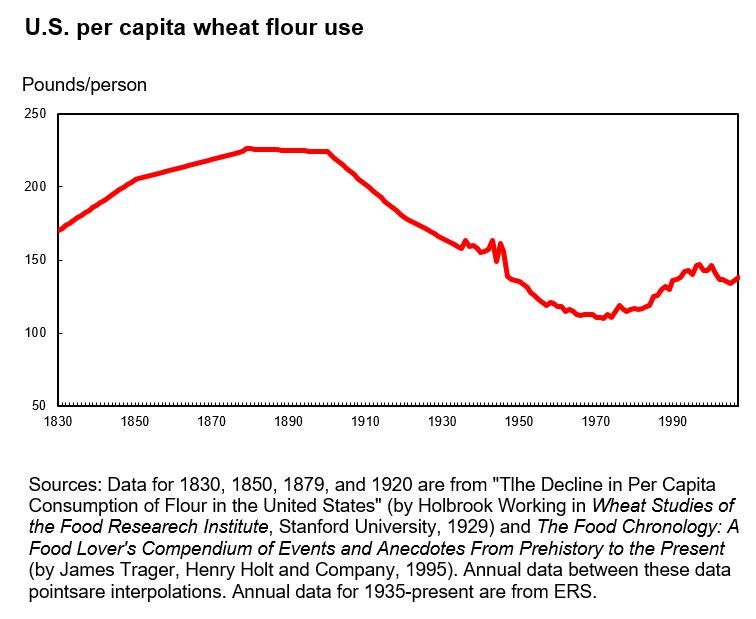
20. Sugar intake in the US, 1822-2016
This graph represents added sugar intake, including honey and high-fructose corn syrup but not fruit sugars, from several data sources:
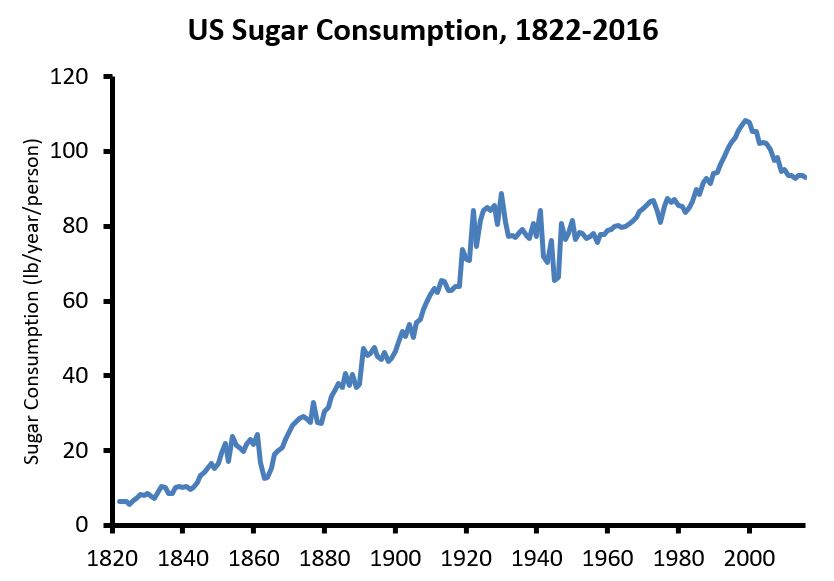
21. Cultures with high intakes of sugar but otherwise healthy diets and lifestyles do not have obesity or diabetes
A well-studied Tanzanian hunter-gatherer population called the Hadza gets 15 percent of its average year-round calorie intake from honey, plus fruit sugar on top of it. This approximates US sugar intake, yet the Hadza do not exhibit obesity, diabetes, or cardiovascular disease.
Another mostly hunter-gatherer population, the Mbuti pygmies of the Congo, also ate large amounts of honey at the time they were studied:
The Mbuti of the Congo forests eat large amounts of honey. According to Ichikawa (1981), honey is their favorite food. At times, during the rainy season up to 80% of the calories in their diet come from honey.
They did not exhibit obesity or insulin resistance.
The Kuna of Panama are interesting because they generally have a non-industrialized diet and lifestyle, except that they obtain white sugar and a few sugar-containing foods via trade. Their diet is 65 percent carbohydrate and 17 percent sugar (95 g/d), according to calculations I did based on dietary intake data. That is more sugar than the average American currently consumes, although 62 percent of their sugar intake is from fruit. The Kuna are lean and have excellent cardiovascular health.
This does not exonerate sugar by any means, but it does suggest that it is unlikely to be the primary cause of obesity, metabolic disease, and cardiovascular disease.
22. During the Cuban economic crisis, sugar intake rose, calorie intake declined, and obesity plummeted
From 1989 through about 1995, the Cuban economy collapsed. Calorie intake declined, fat intake declined, and the diet became very rich in sugar and other refined carbohydrates:
By 1993, carbohydrate, fat, and protein contributed 77 percent, 13 percent, and 10 percent of total energy, respectively, whereas in 1980 their respective contributions were 65 percent, 20 percent, and 15 percent (8). The primary sources of energy during the crisis were sugar cane and rice.
Sugar intake “rose to 28% of total energy intake“. A shortage of gasoline meant that people began walking and riding bicycles more, such that total physical activity increased. During this time, the prevalence of obesity decreased by about half, then eventually rebounded as the crisis resolved and the diet went back to normal. The prevalence of underweight only increased slightly during the crisis, indicating that the decline in obesity was not due to widespread starvation.
23. Cultures with very high intakes of carbohydrate tend to be lean, even if the carbohydrate is white rice
The traditional diet of most agricultural societies around the world is high in carbohydrate and low in fat. Many of these cultures have been studied, and they are typically lean with low rates of diabetes and cardiovascular disease, even if they have abundant food. The book Western Diseases: Their Emergence and Prevention contains many such examples.
In 1990, Staffan Lindeberg, MD, PhD conducted a detailed survey of the diet, lifestyle, and health of the residents of Kitava, a Melanesian island scarcely touched by industrialization. He found a diet based on starchy plant foods (African yam, sweet potato, taro, cassava), fruit, vegetables, seafood, and coconut, with 69 percent of calories coming from carbohydrate (compared to ~49% in the US currently). Despite food abundance, none of the 247 Kitavans Lindeberg examined had obesity or diabetes, even in middle age and older. They had no sign of cardiovascular disease and were unfamiliar with its symptoms. Here is a photo of a Kitavan man being examined by Lindeberg (courtesy of Staffan Lindeberg):

The book Western Diseases: Their Emergence and Prevention contains historical data on the Japanese diet between 1950 and 1975, a time during which obesity was even more rare in Japan than it is today (p. 338). In 1975, long after postwar food shortages were over, the Japanese diet was 62 percent carbohydrate, mostly from white rice. The Japanese ate it daily as their primary staple food, and still do, yet the prevalence of overweight and obesity were, and continue to be, lower than any other industrialized nation. People who emigrate from Japan to the US and begin eating a diet lower in white rice and higher in fat become much heavier, demonstrating that their leanness is not just genetic.
Cross-country comparisons show that nations with carbohydrate-focused diets tend to have the lowest obesity rates, while nations that eat a similar amount of carbohydrate and fat have the highest obesity rates (reproduced from this post with permission from Cian Foley):
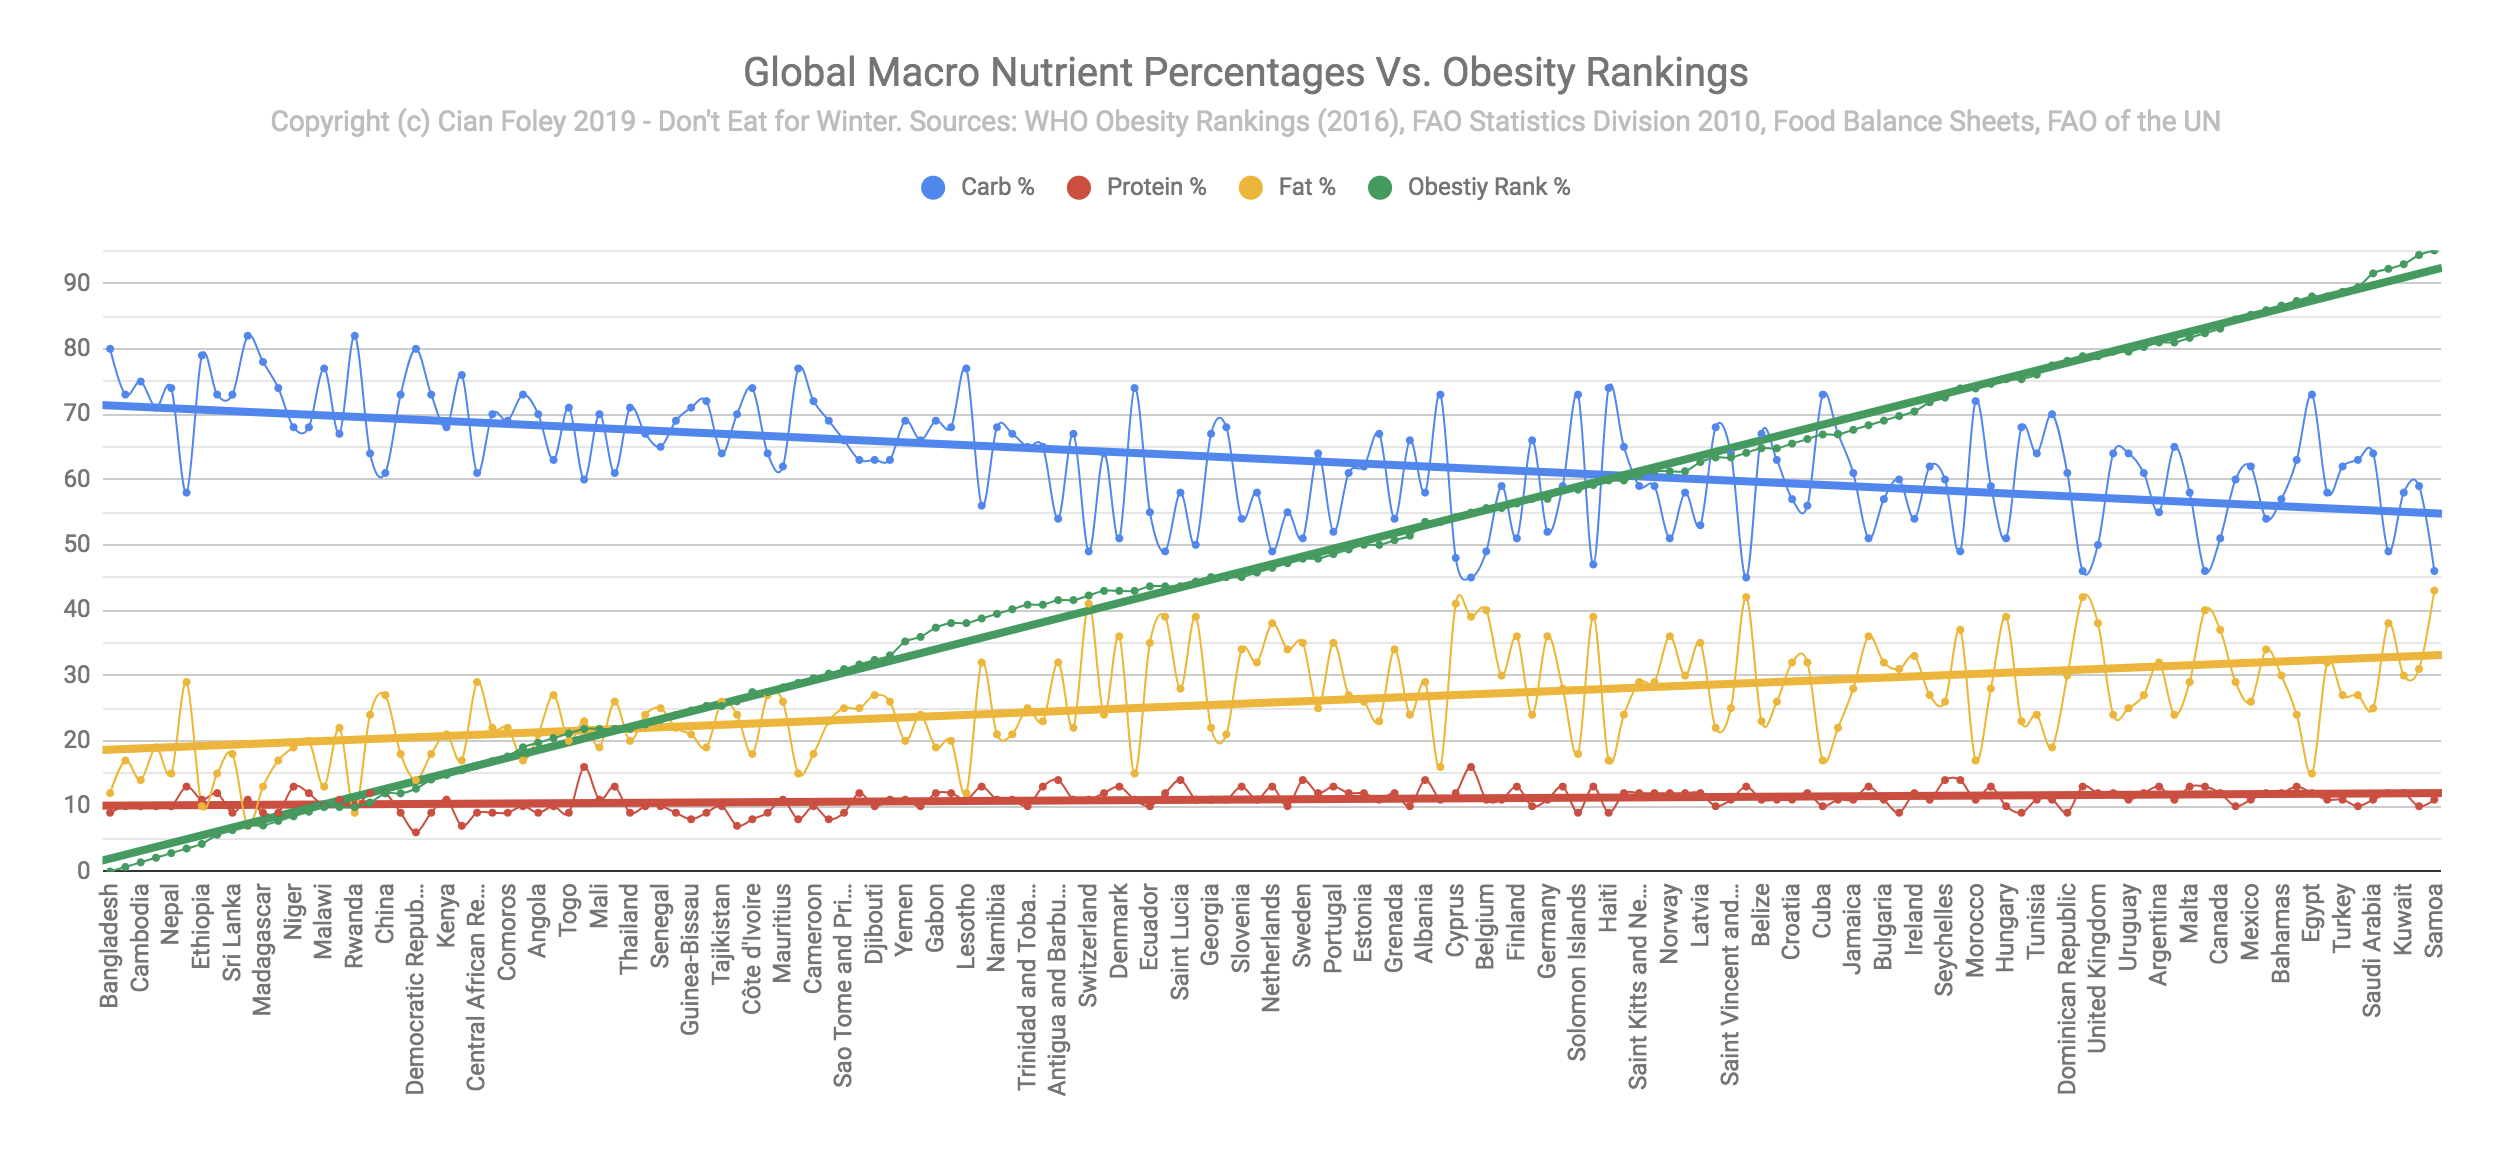
There are certainly explanations for this besides macronutrients– such as poverty– but at the very least this shows that carbohydrate is not an overriding driver of fat gain.
24. In human randomized controlled trials, sugar is only fattening by virtue of its calories
A meta-analysis of 30 randomized controlled trials reported that increasing sugar intake does not increase body weight unless total calorie intake increases. Importantly, calorie intake does often increase when people increase their consumption of sugar-sweetened beverages, so sugar-sweetened beverages aren’t off the hook.
Fructose is half of table sugar (sucrose). A meta-analysis of 31 fructose feeding trials concluded that “Fructose does not seem to cause weight gain when it is substituted for other carbohydrates in diets providing similar calories. Free fructose at high doses that provided excess calories modestly increased body weight, an effect that may be due to the extra calories rather than the fructose.”
25. In randomized controlled trials, low-carbohydrate and low-fat diets yield similar (unimpressive) long-term weight loss results
In real-life conditions, low-fat and low-carbohydrate diets both produce modest weight loss in the average person, usually less than 17 pounds at the 12 month mark. Most meta-analyses (studies of studies) report that weight loss differences between the two diets are “minimal” at 12 months, although low-carbohydrate diets usually fare better up to 6 months. The differences in weight loss between individuals on the same diet are much larger than the differences between diets.
People often dismiss these findings because the diets weren’t lower in carbohydrate. This is a valid critique but it also applies to the low-fat diets used in these studies, which were typically not very low in fat. Also, the fact that people usually don’t restrict carbohydrate or fat as much as instructed shows that most people find the diets hard to sustain in real life.
26. Meta-analyses of ketogenic diet studies
In a quick literature search, I found one meta-analysis of ketogenic diet studies, which reports long-term weight loss after 12 or more months. The ketogenic diets caused 2 pounds (0.9 kg) more weight loss than the low-fat diets.
27. Adherence to ketogenic diets tends to be mediocre
A detailed review of the ketogenic diet literature concluded:
People who are left to their own devices generally do not adhere well to the diet. They typically start strong, but have a hard time adhering to the diet after 1-3 months. Carb intake increases and ketone levels drop.
I have little doubt that better adherence would lead to greater weight loss, but this is true of any weight loss diet.
28. The Virta Health study
The Virta Health study is a non-randomized, controlled trial that reported outcomes for people with type 2 (common) diabetes who followed a ketogenic diet with intensive diet and medical support, vs. care as usual. At one year, participants in the ketogenic diet arm lost 30 pounds (14 kg), lowered their average blood glucose substantially, and greatly reduced their need for diabetes medications other than metformin. Metabolic and cardiovascular risk markers, and the low adverse event rate, suggest that the diet was safe over this period of time. Two-year outcomes suggest that people had begun rebounding back to their original weights and health, but maintenance was still good by the standards of diet interventions.
The Virta Health study reports findings that are quite a bit more impressive than other studies of low-carbohydrate and ketogenic diets. Here are a few reasons why that might be the case:
- Non-randomized trials like the Virta Health study tend to report better results than randomized trials because people self-select into the group they prefer.
- Participants may have been highly motivated because they had type 2 diabetes and the Virta Health program is expensive.
- The Virta Health program provides intensive support to help people adhere to the diet, so adherence was better than in most studies.
29. Eating sugar does not impair weight loss on calorie-reduced diets
I am aware of three weight loss studies that have compared the weight loss response in people eating different amounts of sugar. All three reported that sugar had no impact on weight loss in the context of calorie restriction. One of the studies compared a diet that was 43 percent sugar (sucrose) to one that was 4 percent sugar. Both diets caused the same amount of weight and fat loss over 6 weeks.
Diabetes
30. Weight loss greatly reduces the risk of developing type 2 (common) diabetes
This was conclusively demonstrated by several large, multi-year, randomized controlled trials with actual diabetes diagnoses as the endpoint. One of these trials was the Diabetes Prevention Program study, in which modest weight loss with a calorie-restricted low-fat diet and exercise caused a 58% reduction in the risk of developing diabetes over 2.8 years in 3,234 people with prediabetes. The benefit was largely explained by weight loss, and it was still detectable 15 years later. The diet focused on fat and calorie reduction and was not low in carbohydrate or sugar.
At least four other randomized controlled trials, conducted in four different countries, in people of different races and ethnicities, produced very similar results.
31. Reducing fat intake, without reducing carbohydrate intake, causes weight loss and reduces type 2 (common) diabetes risk
The drug orlistat reduces the absorption of dietary fat in the gut by about 30 percent, without impacting carbohydrate absorption. Large, multi-year placebo-controlled randomized trials have shown that orlistat causes weight loss and reduces the risk of developing type 2 diabetes by 37 percent. This demonstrates that weight loss and protection against diabetes can occur as a result of reducing fat intake, without reducing carbohydrate intake. Orlistat is a FDA-approved weight loss drug.
32. Exercise substantially reduces the risk of developing type 2 (common) diabetes
This was conclusively demonstrated by the Da Qing trial, a 6-year randomized controlled trial. The trial reported that increasing exercise reduces the risk of progressing from prediabetes to diabetes by 46 percent. A second randomized controlled trial reported that two years of supervised aerobic exercise reduced the risk of developing type 2 diabetes by 72 percent, and resistance training reduced the risk by 65 percent. The fact that the exercise was supervised is important– it means the participants actually did it.
33. Weight loss via a temporary very-low-calorie diet durably puts type 2 (common) diabetes into remission
This was conclusively demonstrated by large, a one-year randomized controlled trial in people with type 2 diabetes. The intervention was 3-5 months of a very-low-calorie diet (825–853 kcal/day of a beverage, 59% C, 13% F, 26% P) followed by diet/lifestyle support for the remainder of the year. This caused diabetes remission in 46 percent of people. In other words, 46 percent of people were able to eat normally again and go off medication without experiencing diabetic blood sugar levels for months after the end of the low-calorie diet. Among those who lost the most weight, 86 percent went into remission.
Insulin and insulin resistance
34. Insulin resistance predicts a variety of age-related diseases
In 2001, Gerald Reaven’s group published a very simple but powerful study. They directly measured insulin sensitivity in 147 lean and overweight middle-aged people and waited 6 years to see who got sick, who died, and who didn’t. In the third of the group that was the most insulin resistant, 36 percent developed a health condition or died over the next 6 years, while in the third of the group with the least insulin resistance, none developed a health condition or died. The health conditions that occurred in the insulin-resistant group included high blood pressure, coronary heart disease, stroke, cancer, type 2 diabetes, and death.
35. People with higher insulin levels don’t gain more weight over time than people with lower insulin levels
Many studies have measured insulin levels in an attempt to predict who will gain weight and who will not. Some studies have measured fasting insulin levels, others carbohydrate-stimulated insulin levels. These studies were collected together in a review paper. The research overall suggests that there is no reliable connection between current insulin level and future weight gain. Of the 22 studies included in the review, 5 reported that higher insulin is correlated with more weight gain, 9 reported no correlation between the two, and 8 reported that higher insulin is correlated with less weight gain.
36. Weight loss increases insulin sensitivity, regardless of whether it’s achieved by a low-fat or low-carbohydrate diet
This was demonstrated by a randomized controlled trial in 2009. The low-fat (60% carbohydrate) and low-carbohydrate (20% carbohydrate) diet groups each cut about 500 calories per day and both lost about 9 pounds (4 kg) of body fat over 8 weeks. At the end, insulin sensitivity improved, with no significant difference between groups. Importantly, this study used a gold-standard method for measuring insulin sensitivity, making this result more informative than the vast majority of other low-fat vs. low-carb studies, which tend to indirectly estimate insulin sensitivity using the less reliable HOMA method.
This finding is echoed by an earlier randomized controlled trial in which a 21-day low-fat vs. low-carbohydrate diet, without weight loss, yielded no differences in insulin sensitivity in people with mild type 2 diabetes. This trial also used a gold-standard measure of insulin sensitivity.
37. Insulin resistance is “an appropriate response to nutrient excess“
Exposing cells and tissues to excess energy causes insulin resistance, regardless of whether the excess energy comes from carbohydrate (glucose), fat (fatty acids), or protein (amino acids). This probably happens because excess energy is toxic to cells, so cells turn down their insulin responsiveness in order to take in less energy.
Nutrient excess causes insulin resistance in intact humans as well. Temporarily increasing circulating levels of fat, carbohydrate, or protein in human volunteers markedly impairs their insulin sensitivity.
38. When fat cells “fill up” due to fat gain, energy spills over onto other tissues, causing insulin resistance
As fat tissue expands, fat cells become less effective at taking up fat, especially after meals, and this fat spills over onto other tissues. Depending on underlying genetic factors, different people have different “personal fat thresholds” at which fat gain causes their fat tissue becomes less effective at trapping fat, resulting in insulin resistance and often diabetes.
39. The impact of foods on blood glucose and insulin has little do with how filling they are
This was most clearly demonstrated by a study that fed people the same number of calories from 38 common foods, including bread, potatoes, beans, meat, fruit, peanuts, candy, and pastries, and measured fullness ratings for two hours. Fullness was unrelated to blood glucose responses, and weakly related to insulin responses (higher insulin release correlated with greater fullness).
In contrast, simple food properties like calorie density, protein content, and palatability were strongly related to fullness.
40. Insulin resistance is caused (in large part) by exceeding the unique storage capacity of your own fat tissue
Studies have examined the genetics of insulin resistance, giving us insight into the biological pathways that underlie insulin resistance in the general population. These studies tend to find that gene variants that reduce the storage capacity of fat tissue are associated with insulin resistance.
People with different genetic backgrounds tend to develop diabetes at different levels of body fatness. For example, people of South Asian descent do not need to gain as much fat to develop diabetes as people of European and West African descent. Together, this suggests that each person has a “personal fat threshold“, and if they gain fat beyond that threshold, their fat tissue is no longer able to contain fat effectively, it spills over onto other tissues, leading to insulin resistance and a high risk of diabetes.
41. Mendelian randomization studies on the impact of insulin level on body fatness
Mendelian randomization is a genetic technique that can help to understand the relationship between risk factors and health conditions. Several such studies have examined the relationship between insulin secretion and body fatness. The first two reported no effect of insulin secretion or fasting insulin level on body fatness. The third study reported that insulin secretion increases body fatness, but that this mechanism only accounts for 1-10 percent of between-person differences in body fatness.
Thus, all Mendelian randomization studies to date suggest that the impact of insulin on body fatness is either small or nonexistent.
42. Of the three published studies funded by Taubes’s organization the Nutrition Science Initiative (NuSI), at least two, and possibly all three, refuted the carbohydrate-insulin hypothesis
The first study was a tightly controlled metabolic ward study reporting that metabolic rate slightly and transiently increased, but fat loss actually slowed, on a very-low-carbohydrate ketogenic diet (2% sugar), compared with a high-sugar (25%) higher-carbohydrate diet of equal calories. This study also reported that the very-low-carbohydrate diet did not increase total energy levels in the bloodstream, as claimed by Taubes’s model.
The second study was a one-year randomized controlled diet trial (DIETFITS) reporting that a low-fat vs. low-carbohydrate diet led to the same degree of weight loss and the same metabolic rate after one year, and baseline insulin secretion did not predict who did better on which diet.
The third study reported that a very-low-carbohydrate diet led to higher calorie expenditure than a low-fat diet in people maintaining weight loss. However, a reanalysis of the raw data suggests that the effect may be an artifact of faulty data.
Exercise
43. Exercise tends to cause weight and fat loss in people with excess body fat
This has been demonstrated by dozens of randomized controlled trials, although the findings are not always consistent across individuals or trials, probably because many trials use modest exercise interventions and people adhere to them poorly. Meta-analyses (studies of studies) tend to report that exercise causes weight and fat loss, including the most recent meta-analysis of 36 studies.
Greater volume of exercise, particularly when supervised to ensure compliance, causes greater weight and fat loss. In one randomized controlled trial that assigned overweight volunteers to different exercise amounts, greater amounts led to more body fat loss, with the greatest amount leading to a loss of 12 lbs of body fat over eight months relative to a group that did not exercise (175 min a week on a cycle trainer, treadmill, or elliptical).
Thanks to Adam Tzur of Sci-Fit for references.
44. Exercise increases insulin sensitivity
This has been demonstrated by many randomized controlled trials. Here are a few review papers of the evidence.
45. Sedentary behavior causes insulin resistance
Athletes have high insulin sensitivity, yet ten days of inactivity markedly reduces it. Five days of bed rest markedly increases insulin resistance in non-athletes as well. Reducing daily walking time also promotes insulin resistance in only two weeks.
Food reward
46. Fat and carbohydrate both cause dopamine release and increase eating drive, particularly when combined
The gut senses fat, carbohydrate, and protein, and this causes dopamine release in the brain that stimulates motivation and learning. This has been extensively documented in animals, and in humans it has been replicated for fat and carbohydrate.
The combination of carbohydrate and fat causes greater activity in dopamine-responsive brain regions, and greater eating drive, than either alone. To visualize this yourself, imagine how much you would want to eat regular ice cream, vs. fat-free ice cream, vs. unsweetened ice-cream.
47. The most commonly/intensely craved foods combine carbohydrate and fat together, while foods that are high in sugar or fat alone are less commonly craved
This should be common sense (think of ice cream without the sugar or fat), but it has been extensively supported by research. Foods rich in fat and carbohydrate together stimulate eating drive more than either alone, measured both by brain activity and people’s willingness to pay for the foods.
Studies on cravings and food addiction have found that foods combining carbohydrate and fat are the most likely to trigger cravings and addiction-like behaviors, including savory foods that contain no sugar. The most commonly craved food is chocolate. Foods that are only high in sugar or fat can also trigger cravings, but it’s less common.
48. We eat more food when it tastes better
This is common sense, but here are some references to scientific studies just in case anyone doubts it.
Rigor
49. Calling for more rigor in science does not necessarily make a person rigorous
Science has flaws at many levels that make it less efficient and effective than it could be. However, using the concept of rigor selectively to criticize findings you don’t like is not rigorous.
Those who genuinely care about scientific rigor should be promoting the most effective tools we have for increasing it: Study preregistration, open data, proper application of statistics, conflict of interest regulations and disclosures, replication, meta-analysis, and Registered Reports. They should also be promoting the organizations that develop and advance these tools like the Center for Open Science. The most effective tools for increasing the rigor of science are coming from within science itself– designed by people who understand how science works. Non-scientists can help by learning about these efforts, promoting them, and pushing for their adoption.
50. Expert reviews of Taubes’s writing have uncovered extensive misuse of evidence
Gary Taubes has an extensive history of misrepresenting source material to benefit his narrative. The most detailed fact checks of his books were written by Seth Yoder at The Science of Nutrition, and the results are frankly disturbing. My own review of The Case Against Sugar also uncovered evidence misuse and a general unwillingness to cite relevant scientific evidence and apply logic appropriately.
51. The Nutrition Science Initiative (NuSI), with Gary Taubes at its helm, attempted to interfere with the research that it funded once unfavorable results came in
Initially, NuSI assured researchers that it would have “no control over research design, conduct, or reporting”, which was essential due to Taubes’s conflicts of interest. NuSI asked lead researcher Kevin Hall to communicate this to me, which he did in 2012 and I documented on my website. Once the first results came in undermining the carbohydrate-insulin hypothesis, NuSI broke its agreement and began interfering with the scientific process, eventually causing the resignation of lead researcher Kevin Hall. Hall concluded that “Potentially conflicted funders should not be involved in the conduct, analysis, or reporting of research. NuSI’s meddling in the EBC study violated both the final contract terms and our verbal agreement at the outset of the study.”
Miscellaneous
52. The most fattening diet in animals and humans is human junk food, and its fattening effect cannot be explained by carbohydrate or fat alone
In rodents, the most fattening diet ever tested is the “cafeteria diet”, which consists of a buffet of calorie-dense, tasty human foods like condensed milk, chocolate chip cookies, salami, cheese, banana, marshmallows, milk chocolate, and peanut butter. When rodents are given a choice between the cafeteria diet and their normal low-fat rodent pellets, not surprisingly they gorge on the human foods and virtually ignore the boring pellets. Other species quickly grow fat on calorie-dense human food as well, including raccoons and monkeys. Humans with ready access to a variety of calorie-dense, tasty foods also overeat and gain weight rapidly.
In rodents, diets that are only high in fat or only high in refined carbohydrate (including sugar) are not nearly as fattening as the cafeteria diet, demonstrating that neither fat nor refined carbohydrate alone can explain its full fattening effect. Similar findings are observed in humans, where increasing sugar intake alone isn’t nearly as fattening as the cafeteria diet.
53. Obesity has a strong genetic component
This has been demonstrated by many different studies in humans. A meta-analysis (study of studies) of 115 such studies concluded that 75 percent of the difference in body fatness (BMI) between people is due to genetic differences. Note: this is perfectly compatible with the idea that diet and lifestyle changes are responsible for the high prevalence of obesity in the 21st century; these studies describe the genetic component of differences in body fatness between people in a given environment. If we all live in a fattening environment, those of us who are genetically susceptible to obesity will develop it. Without a fattening environment, these genetic differences matter less and few people develop obesity.
54. Synthesis of fat from carbohydrate is negligible in humans eating typical Western diets
The scientific term for this is de novo lipogenesis, and although the pathway exists in humans it only converts a tiny fraction of ingested carbohydrate into fat under realistic circumstances (typically less than 1 gram per day). In contrast, most people consume 50-200 grams of fat from the diet. See this review paper for the evidence, or the physiology textbook Metabolic Regulation, pages 200-201.
55. Partially suppressing the release of fat from fat cells (lipolysis) does not cause fat gain, hunger, or a slower metabolic rate
A drug called acipimox inhibits lipolysis, or the release of fatty acids from fat cells, mimicking the effect of insulin. As a consequence, free fatty acid levels in circulation decline (this is a key circulating fuel in the bloodstream). The carbohydrate-insulin hypothesis predicts that this should lead to fat gain, hunger, and a reduced metabolic rate. A 6-month placebo-controlled randomized controlled trial of acipimox showed that the drug reduces circulating free fatty acid levels by 38 percent but has no impact on body composition, calorie intake, or metabolic rate.
56. The fat tissue of people with obesity releases fat at a greater rate than that of lean people, not a slower rate
The most informative study to date on this found that the greater a person’s fat mass, the higher the total rate of fat (free fatty acid) release. Thus, nothing is “trapping” fat inside the fat cells of people with obesity– to the contrary, they release fat from their fat tissue at a greater rate than lean people.


Increasingly Competitive College Admissions: Much More Than You Wanted To Know
0: Introduction
This is from businessstudent.com:

Acceptance rates at top colleges have declined by about half over the past decade or so, raising concern about intensifying academic competition. The pressure of getting into a good university may even be leading to suicides at elite high schools.
Some people have dismissed the problem, saying that a misplaced focus on Harvard and Yale ignores that most colleges are easier to get into than ever. For example, from The Atlantic, Is College Really Harder To Get Into Than It Used To Be?:
If schools that were once considered “safeties” now have admissions rates as low as 20 or 30 percent, it appears tougher to get into college every spring. But “beneath the headlines and urban legends,” Jim Hull, senior policy analyst at the National School Board Association’s Center for Public Education, says their 2010 report shows that it was no more difficult for most students to get into college in 2004 than it was in 1992. While the Center plans to update the information in the next few years to reflect the past decade of applicants, students with the same SAT and GPA in the 90’s basically have an equal probability of getting into a similarly selective college today.
Their link to the report doesn’t work, so I can’t tell if this was ever true. But it doesn’t seem true today. From Pew:

The first graph shows that admission rates have decreased at 53% of colleges, and increased at only 31%. The second graph shows that the decreases were mostly at very selective schools, and the increases were mostly at less selective schools. We shouldn’t exaggerate the problem: three-quarters of US students go to non-selective colleges that accept most applicants, and there are more than enough of these for everyone. But if you are aiming for a competitive school – not just Harvard and Yale, but anywhere in the top few hundred institutions – the competition is getting harder.
This matches my impression of “facts on the ground”. In 2002, I was a senior at a California high school in a good neighborhood. Most of the kids in my class wanted to go to famous Ivy League universities, and considered University of California colleges their “safety schools”. The idea of going to Cal State (California’s middle- and lower- tier colleges) felt like some kind of colossal failure. But my mother just retired from teaching at a very similar school, and she says nowadays the same demographic of students would kill to get into a UC school, and many of them can’t even get into Cal States.
The stories I hear about this usually focus on how more people are going to college today than ever, but there’s still only one Harvard, so there’s increasing competition for the same number of spots.
As far as I can tell, this is false.

The college attendance rate is the same today as it was in 2005. If you’ve seen graphs that suggest the opposite, they were probably graphs of the total number of Americans with college degrees, which only proves that more people are getting degrees today than in the 1940s or whenever it was that the oldest generation still alive went to college.
(in fact, since the birth rate is declining, this means the absolute number of college-goers is going down).
I’ll go further. Harvard keeps building more dorms and hiring more professors, so there are the same number of Harvard spots per American today as there were ten years ago, twenty years ago, and all the way back to the 1800s:

I want to look into this further and investigate questions like:
– How did we get to this point? Have college admissions always been a big deal? Did George Washington have to freak out about getting into a good college? What about FDR? If not, why not?
– Is academia really more competitive now than in the past? On what time scale? At what levels of academia? Why is this happening? Will it stop?
– Is freaking out about college admissions the correct course of action?
1. A Harvard-Centric History Of College Admissions
For the first two centuries of American academia, there was no competition to get into college. Harvard admitted…
(Harvard is by far the best-documented college throughout most of this period, so I’ll be focusing on them. No, Ben Casselman, you shut up!)
…Harvard admitted anyone who was fluent in Latin and Greek. The 1642 Harvard admission requirements said:
When any schollar is able to read Tully [Cicero] or such like classicall Latine Authore ex tempore & make and speake true Latin in verse and prose, suo (ut auint) Marte, and decline perfectly the paradigmes of Nounes and Verbes in the Greek tongue, then may hee bee admitted into the Colledge, nor shall any claim admission before such qualifications.
Latin fluency sounds impressive to modern ears, like the sort of test that would limit admission to only the classiest of aristocrat-scholars. But knowledge of classical languages in early Massachussetts was shockingly high, even among barely-literate farmers. In 1647, in between starving and fighting off Indian attacks, the state passed a law that every town of at least 100 families must have a school that taught Latin and Greek (it was called The Old Deluder Satan Law, because Puritans). Even rural families without access to these schools often taught classical languages to their own children. Mary Baker Eddy, who grew up in early 19th-century rural New Hampshire, wrote that:
My father was taught to believe that my brain was too large for my body and so kept me much out of school, but I gained book-knowledge with far less labor than is usually requisite. At ten years of age I was as familiar with Lindley Murray’s Grammar as with the Westminster Catechism; and the latter I had to repeat every Sunday. My favorite studies were natural philosophy, logic, and moral science. From my brother Albert I received lessons in the ancient tongues, Hebrew, Greek, and Latin. My brother studied Hebrew during his college vacations.
By the standards of the time, Harvard admission requirements were tough but fair, and well within the reach of even poorer families. More important, they were only there to make sure students were prepared for the coursework (which was in Latin). They weren’t there to ration out a scarce supply of Harvard spots. In fact this post, summarizing Jerome Karabel’s Chosen, says that “there was no class size limit, because Harvard was trying to compete with Oxford and Cambridge for size”. They wanted as many students as they could get; their only limit was the number of qualified applicants.
These policies continued through the 19th century, with changes only in the specific subjects being tested. In the late 1700s they added some math; in the early 1800s they added some science. You can find a copy of the 1869 Harvard entrance exam here. It’s pretty hard – but it had an 88% pass rate (surely at least in part because you wouldn’t take it unless you were prepared) and everyone who passed was guaranteed a spot at Harvard. Some documents from Tufts around this time suggest their procedure was pretty similar. Some other documents suggest that if you went to a good high school, they assumed you were prepared and let you in without requiring the exams.
When did this happy situation end? Information on this topic is hard to find. I can’t give specific sources, but I get the impression that at the very end of the 19th century, there was a movement to standardize college admissions. At first this just meant make sure every college has the same qualification exams, so that one school isn’t asking about Latin and another about Greek. This culminated in the creation of the College Board in 1899, which administered an admission test that acted as a sort of great-great-grandfather of the SAT. Very gradually, so gradually that nobody at the time really remarked on it, this transitioned from making sure students were ready, to rationing out scarce spots. By about 1920, the transition was basically complete, so that nobody was surprised when people talked about “how colleges should decide who to accept” or questions like that. If you can find more on this transition, please contact me.
Acceptance was originally based entirely on your score on the qualifying exam. But by the 1920s, high-scorers on this exam were disproportionately Jewish. Although Jews were only about 2% of the US population, they were 21% of Harvard’s 1922 class (for more on why this might happen, read my post The Atomic Bomb Considered As Hungarian High School Science Fair Project). In order to arrest this trend, Harvard and other top colleges decided to switch from standardized testing to an easier-to-bias “holistics admissions” system that would let them implement a de facto Jewish quota.
Quota proponents not only denied being anti-Semitic but argued they were actually trying to fight anti-Semitism; if the student body became predominantly Jewish, this might inflame racial tensions against Jews. Harvard president Abbott Lowell, the quotas’ strongest proponent, said: “The anti-Semitic feeling among the students is increasing, and it grows in proportion to the increase in the number of Jews. If their number should become 40% of the student body, the race feeling would become intense”. Was he just trying to rationalize his anti-Semitism? I don’t think so. I doubt modern Harvard officials are anti-Asian in any kind of a hateful sense, but they enforce Asian quotas all the same. What would they say if you asked them why? Maybe that if a country full of whites, blacks, and Latinos had predominantly Asian elite colleges, that might make (as Lowell put it) “the race feeling become intense”. I see no reason to think that 1920s officials were thinking any differently than their modern counterparts.
Whatever the reasons, by the mid-1920s the Jewish quota was in place and Harvard had switched to holistic admissions. But Lowell and his contemporaries emphasized that the new policies were never meant to make Harvard selective. “It is neither feasible nor desirable to raise the standards of the College so high that none but brilliant scholars can enter…the standards ought never to be so high for serious and ambitious students of average intelligence.”
We’ll talk later about how this utopian dream of top-notch education for anyone with a foreskin failed. But before we get there, a more basic question: how come Harvard wasn’t overrun with applicants? If the academic requirements were within reach of most smart high-schoolers, how come there was no need to ration spots?
Below, I discuss a few possibilities in more depth.
1.1: Historical Tuition Fees
Were early American colleges so expensive that everyone except aristocrats was priced out?
No:

I find very conflicting accounts of colonial tuition prices. But after the Revolution, tuition stayed stable about about a third average median income until about 1990, when it increased to 1.5x median income. In other words: relative to income, historical tuition costs were about a fifth of what they are today. Some good universities seem to have not had tuition at all – Stanford had a $0 price tag for its first 35 years.
Even when tuition existed, historical accounts suggest it wasn’t especially burdensome for most college students, and record widespread effort to accommodate people who couldn’t pay.The first Harvard scholarship was granted in the 1640s. There are occasional scattered references to people showing up at Harvard without enough money to pay and being given jobs as servants to college officials or other students to help cover costs; in America, Ralph Waldo Emerson took advantage of this kind of program; in Britain, Isaac Newton did.
If you were a poor farmer who couldn’t get a scholarship and didn’t want to work as a servant, sometimes college were willing to accept alternative forms of payment. According to The Billfold:
Harvard tuition — which ran about fifty-five pounds for the four-year course of study — was paid the same way [in barter], most commonly in wheat and malt. The occasional New England father sent his son to Cambridge with parsnips, butter, and, regrettably for all, goat mutton. A 141-pound side of beef covered a year’s tuition.

1.2 Discrimination
Early colleges only admitted white men. Did this reduce the size of the applicant pool enough to give spots to all white men who applied?
I don’t think racial discrimination can explain much of the effect. Throughout the 19th century, America hovered around 85% white. New England, where most Harvard applicants originated, may have been 95% to 99% white – see eg this site which says Boston was 1.3% black in 1865; non-black minorities were probably a rounding error. So there’s not much room for racial discrimination to reduce the applicant pool.
The exclusion of women from colleges in the 1800s is less than generally believed:

(source: unprincipled sketchy attempt to combine this with this to get one measure that covers the entire period)
For every woman in college in 1890, there were about 1.3 men; this is no larger a gender gap than exists today, though in the reverse direction. How come you never hear about this? Many of the women were probably in teacher-training colleges or some other gendered institution; until the early 1900s, none of them were at Harvard. But after gender integration, the women’s colleges were usually annexed to the nearest men’s college, turning them into a single institution. Under these circumstances, it doesn’t seem that likely that integration had a huge effect on admissions selectivity. Also, admitting women can only double the size of the applicant pool, but 1800s college seemed much more than twice as easy to get into.
Overall I don’t think this was a major part of the difference either.
1.3: Lack Of Degree Requirement For Professional Schools
Nowadays college is competitive partly because people expect it to be their ticket to a good job. But in the 19th century, there was little financial benefit to a college degree.
Suppose you wanted to become a doctor. Most medical schools accepted students straight out of secondary school, without a college degree. In fact, most medical schools accepted all “applicants”, the same as Harvard. Like Harvard, there was sometimes a test to make sure you knew Greek and Latin (the important things for doctors!) but after that, you were in.
(This article has some great stories about colonial and antebellum US medical education. Anyone who wanted could open up a medical school; profit-motive incentivized them to accept everybody. Medical-schooling was so profitable that the bottleneck became patients; since there were no regulations requiring medical students to see patients, less scrupulous schools tended to skip this part. Dissection was a big part of the curriculum, but there were no refrigerators, so fresh corpses became a hot commodity. Grave robbing was a real problem, sparking small-scale wars between medical schools and their local towns. “In at least 2 instances, the locals actually raided the school to obtain a body. In 1 case, the school building was destroyed by fire, and in another, 2 people, a student and a professor, were killed.” There were no requirements for how long medical schools should last, so some were as short as nine months. But there were also no requirements for who could call themselves a doctors, so students would sometimes stay until they got bored, then drop out and start practicing anyway. Tuition was about $100 per year, plus cost of living and various hidden fees; by my estimates that’s about half as much (as percent of an average doctor’s salary) as medical school tuition today. This situation continued until the Gilded Age, when medical schools started professionalizing themselves a little more.)
Or suppose you wanted to be a lawyer. The typical method was called “reading law”, which meant you read some law textbooks, served an apprenticeship with a practicing lawyer, and then started calling yourself a lawyer (in some states you also needed a letter from a court testifying to your “good moral character”). Honestly the part where you apprenticed with an practicing lawyer was more like a good idea than a requirement. It’s not completely clear to me that you needed to do anything other than read enough law textbooks to feel comfortable lawyering, and then go lawyer. Most lawyers did not have a college degree.
Abraham Lincoln, a lawyer himself, advised a law student:
If you are absolutely determined to make a lawyer of yourself the thing is more than half done already. It is a small matter whether you read with any one or not. I did not read with any one. Get the books and read and study them in their every feature, and that is the main thing. It is no consequence to be in a large town while you are reading. I read at New Salem, which never had three hundred people in it. The books and your capacity for understanding them are just the same in all places.
Levi Woodbury, the 30th US Supreme Court Justice (appointed 1846), was the first to attend any kind of formal law school. James Byrnes, the 81st Supreme Court Justice (appointed 1941), was the last not to attend law school. It’s apparently still technically possible in four states (including California) to become a lawyer by reading law, but it’s rare and not very encouraged.
The ease of entering these professions helps explain why there was no oversupply of Harvard applicants. But then why wasn’t there an oversupply of doctors and lawyers? We tend to imagine that of course you need strict medical school admissions, because some kind of unspecified catastrophe would happen if any qualified person who wanted could become a doctor. Did these open-door policies create a glut of professionals?

No. There were fewer doctors and lawyers per capita than there are now.
Did it drive down salaries for these professions?
I don’t have great numbers on lawyer salaries, but based on this chart from 1797 Britain and this chart from 1900s America, I get the impression that throughout this period lawyers made about 3-5x as much as unskilled laborers, 3-4x as much as clerks and teachers, and about the same as doctors. This seems to match successful modern lawyers, and probably exceed average modern lawyers. This may because unskilled laborers now earn a minimum wage and teachers have unions, but in any case the 19th-century premium to a law degree seems to have been at least as high and probably higher.
The same seems true of doctor salaries. The paper above estimates physician salaries at $600 per year, during a time when agricultural laborers might have been making $100 and clerks and teachers twice that.
I conclude that letting any qualified person become a doctor or a lawyer, without gatekeeping, did not result in a glut of doctors and lawyers, and did not drive down salaries for those professions beyond levels we would find reasonable today.
1.4: Conclusions
So why weren’t there gluts of would-be college students, doctors, and lawyers? I can’t find any single smoking gun, but here are some possibilities.

Throughout this period, between 60% and 80% of Americans were farmers. Unless you were wealthy or urban, the question of “what career do you want in order to actualize your potential” didn’t come up. You were either going to be a farmer, or else you had some specific non-farm pathway in mind that you could pursue directly instead of getting a college degree to “keep your options open”.
Since rural children were expected to work on the farm, there was no protracted period of educational unproductivity. There was no assumption that your kids weren’t going to be earning anything until age 18 and so you might as well protract their unproductivity until age 22. That meant that paying to send your child to Boston or wherever, and to support him in a big-city lifestyle for four years, was actually a much bigger deal than the tuition itself. This article claims that in 1816, tuition itself was only about 10% of the expenses involved in sending a child to college (granted, poor people pinching pennies could get by for much less than the hypothetical well-off student analyzed here, but I think the principle still holds).
Another limiting factor may have been that there was ample opportunity outside of college and the professions, in almost every area. Twelve US presidents, including George Washington, did not go to college. Benjamin Franklin, everyone’s model of an early American polymath genius, did not go to college. Of the ten richest people in American history (mostly 19th-century industrialists), as far as I can tell only two of them went to college. Aside from the obvious race and gender discrimination, the 19th century was a lot closer to real meritocracy than today’s credentialist fake meritocracy; people responded rationally by ignoring credentials and doing meritorious things.
2. How Did The Zero-Competition Regime Transition To The Clusterf**k We Have Today?
Here is a graph of Harvard admission rates over time, based mostly on these data:

During the early part of the 1900s, Harvard was still in the 19th-century equilibrium of admitting most qualified non-Jewish applicants. Around 1940, the admission rate dropped from 95% to 25%. Most sources I read attribute this to the GI Bill, a well-intentioned piece of legislation that encouraged returning WWII veterans to get a college education. So many vets took the government up on the offer that Harvard was overwhelmed for the first time in its history.
But this isn’t the whole story.
You’ve seen this before – this is percent of Americans (by gender) to graduate college. It’s sorted by birth cohort, which means 1920 on the x-axis corresponds to the people who were in college in the 1940s – eg our GIs. The GI Bill is visible on this graph – around 1920, there is a spike in attendance for men but not women, which is the pattern we would predict from GIs. But it only takes college graduation rate from 10% to 15% (compared to its current 40%). And after the GI Bill, the college graduation rate starts dropping again – as we would expect of a one-time shock from a one-time war. And between 1955 and 1960, Harvard admissions rebound to about 40% of applicants.
The big spike in college attendance rates – and a corresponding dip in Harvard admission percentage – takes place in the 1938 to 1952 birth cohort. Why are all these people suddenly going to college? They’re dodging the draft. A big part of the increase in college admissions was people taking advantage of the college loophole to escape getting sent to Vietnam.
Again, this is a one-time shock, and mostly applies to men. So how come we see a quadrupling of college graduation during this period affecting men and women alike?
A standard narrative says that work has gotten more difficult over the past century, and so workers need more education. I’ve always found this hard to believe. In other countries, students still go to medical school and law school without a separate college degree first. Programming is a classic example of a high-skilled complicated modern profession, but many programmers dropped out of college, many others didn’t attend at all, and many programming “boot camps” are opening up offering to teach programming skills outside the context of a college education. And in many of the jobs that do require college education, the education is irrelevant to their work. Both of my adult jobs – as an English teacher and as a doctor – required me to have a college degree in order to apply. But my college education was relevant to neither (I’m a philosophy major). The degree requirement seemed like more of a class barrier / signaling mechanism than an assertion that only people who knew philosophy could make good teachers and doctors. I realize I’m making a strong claim here, and I don’t have space to justify it fully – for more on this, read my Against Tulip Subsidies and SSC Gives A Graduation Speech – or better yet, Bryan Caplan’s The Case Against Education.
If increasing need for skills didn’t cause increasing college attendance, what did? Again, this is based off of idiosyncratic beliefs I don’t have the space to justify (again, read Caplan) but it could be a sort of self-reinforcing signaling cycle. Once the number of people in college reached a certain level, it led to a well-known social expectation that intelligent and conscientious men would have college degrees, which made college a sign of intelligence and, conversely, not having been to college a sign of stupidity. If only 10% of smart/hard-working people have been to college, not having a college degree doesn’t mean someone isn’t smart/hard-working; if 90% of smart/hard-working people have been to college, not having a college degree might call their intelligence and work ethic into question. This cycle meant that after the shocks of the mid-1900s, there was a strong expectation of a degree in the knowledge professions, which forced women and later generations of men to continue going to college to keep up. The government’s decision to provide an endless stream of supposedly-free college loans exacerbated the problem and sabotaged the only natural roadblock that could have stopped it.
At the same time, several factors were coming together to discourage hunch-based “I like the cut of his jib” style hiring practices. Community ties were becoming weaker, so hirers typically wouldn’t have social contacts with potential hirees. Family businesses whose owners could hire based on hunches were giving way to large corporations where interviewers would have to justify their hiring decisions to higher-ups. Increasing concern about racism was raising awareness that hunch-based hiring tended to discriminate against minorities, and the advent of the discrimination lawsuit encouraged hiring based on objective criteria so you could prove you rejected someone for reasons other than race. The Supreme Court decision Griggs v. Duke may or may not have played a role by making it legally risky for corporations to give prospective hires aptitude tests. All of this created a “perfect storm” where employers needed some kind of objective criteria to evaluate potential new hires, and all the old criteria weren’t cutting it anymore. The rise of the college degree as a signal for intelligence, and the increased sorting of people by college selectivity, fit into this space perfectly.
Once society established that knowledge-worker jobs needed college degrees, the simultaneous rises in automation, globalization, and inequality made knowledge-worker jobs increasingly necessary to earn a living, completed the process.

If my story were true, this would suggest college attendance would not have risen so quickly in other countries that didn’t have these specific factors. I don’t have great cross-country data, but here’s what I can find:


College attendance in the UK supposedly remained very low until a 1992 act designed to encourage it, but it looks like part of that is just them reclassifying some other schools as colleges. I don’t know how it really compared to the US and I welcome information from British readers who know more than I do about this. Through the rest of the world, college attendance lagged North America by a long time, but the continent-wide categories probably combine countries at different levels of economic development. I don’t really know about this one.
Moving on: the graphs in the Introduction show that college attendance has been stable since about 2005. Why did the rise stop? These articles point out a few relevant trends.
First, the economy is usually to blame for this kind of thing. There was a slight increase in attendance during the 2008 recession, and a slight decrease during the recent boom. But over the course of the cycle, it still seems like the increase in college attendance has slowed or stopped overall, in a way that wasn’t true of past business cycles.
Second, birth rates are decreasing, which means fewer college-aged kids. The national population is still increasing, mostly because of immigrants, but many immigrants are adults without much past education, so they’re not as significant a contribution to the college population.
Third, the price of college keeps going up. I’m surprised to hear this as a contribution to declining attendance, because I thought it was the glut of students that kept prices high, but maybe both factors affect each other.
Fourth, for-profit colleges are falling apart.

In some cases, the government has shut them down for being outright scams. In other cases, potential students have wised up, realized they are outright scams, and stopped being interested in attending them. These colleges advertised to (some would say “preyed on”) people who weren’t able to get into other colleges, so their collapse looks like a fall in the college enrollment/graduation rate.
These are all potentially relevant, but they seem kind of weak to me: the sort of thing that explains the year-to-year trend, but not why the great secular movement in favor of more college has stopped.
Maybe it’s just reached a natural ceiling. Seventy percent of high school graduates are now going to college. The remaining 30% may disproportionately include people with serious socioeconomic or health problems that make going to college very hard for them.
Also, keep in mind that only about 60% of college students graduate in anywhere near the expected amount of time. Some economists have come up with rational-college-avoidance models where people who don’t expect to be able to graduate from college don’t waste their money trying.
3. If Number Of Students Applying To College Has Been Constant Or Declining Over The Past Ten Years, Why Are Admissions To Top Colleges So Much More Competitive?
To review: over the past ten years, the number of US students applying to college has gone down (the number applying to four-year private colleges has stayed about the same). But Harvard’s acceptance rates have decreased by half, with similar cuts across other top schools, and more modest cuts across most good and moderately-good colleges. There’s also a perception of much greater pressure on students to have perfect academic records before applying. Why?
3.1: Could the issue be increasing number of international students?
This would neatly match the evidence of constant US numbers vs. increasing selectivity.
Harvard equivocates between a few different definitions of “international student”, but I think it’s comparing apples to apples when it says the Class of 2013 was 10% foreign citizens and the Class of 2022 is 12%. These two classes bound the time period we’re worrying about, and this doesn’t seem like a big change. Also, across all US colleges international student enrollments seem to be dropping, not increasing. Some of this may have to do with strict Trump administration visa policies, or with international perceptions of increasing US hostility to foreigners.
Since fewer international students are applying in general, and even top schools show only a trivial increase, this probably isn’t it.
3.2: Could the issue be more race-conscious admission policies?
Might top colleges be intensifying affirmative action and their preference for minorities and the poor, thus making things harder for the sort of upper-class white people who write news articles about the state of college admissions? Conversely, might colleges by relaxing their restrictions on high-achieving Asians, with the same result?
This matches the rhetoric colleges have been putting out lately, but there is not a lot of signs it’s really happening. Harvard obsessively chronicles the race of its student body, and the class of 2010 and class of 2022 have the same racial composition. The New York Times finds that whites are actually better represented at colleges (compared to their percent of the US population) than they were 35 years ago, although Asians are the real winners.

The Times doesn’t explain why this is happening. It may be due to weakening affirmative action, including bans by several states. Or it may be because of a large influx of uneducated Mexican immigrants who will need a few more generations of assimilation before their families attend college at the same rate as whites or previous generations of Latinos.
What about Asians? There was a large increase in Asian admissions, but it was mostly before this period. The Ivy League probably has some kind of unofficial Asian quota which has been pretty stable over the past decade. Although the Asian population continues to grow, and their academic achievement continues to increase, this probably just increases intra-Asian competition rather than affecting people of other races.
3.3: Could the issue be increasing number of applications per student?
Here’s an interesting fact – even though no more Americans or foreigners are applying to colleges today vs. ten years ago, Harvard is receiving twice as many applications – from about 20,000 to more than 40,000. How can this be?

The average college student is sending out many more applications.
I am not Harvard material. But when I was looking at colleges, my mother pressured me to apply to Harvard. “Come on!” she said. “It will just take a few hours! And who knows? They might accept you! You’ll never get in if you don’t try!”
Harvard did not accept me. But my mother’s strategy is growing in popularity. Part of this might be genuine egalitarianism. Maybe something has gone very right, and the average American really does believe he or she has a shot at the Ivy League. But part of it may also be a cynical ploy by colleges to improve their rankings in US News and other similar college guides. These rankings are partly based on how “selective” they are, ie what percent of students they turn away. If they encourage unqualified candidates to apply, they can turn those unqualified candidates away, and then they appear more “selective” and their ranking goes up.
But increased application volume is mostly driven by an increasingly streamlined college admissions process, including the Common Application. I didn’t like my mother’s advice, because every college application I sent in required filling in new forms, telling them my whole life story all over again, and organizing all of it into another manila envelope with enclosed check. It was like paying taxes, except with essay questions. And there was a good chance you’d have to do it all over again for each institution you wanted to apply for. Now that’s all gone. 800 schools accept the Common Application, including the whole Ivy League. From the Times again:
Six college applications once seemed like a lot. Submitting eight was a mark of great ambition. For a growing number of increasingly anxious high school seniors, figures like that now sound like just a starting point…
For members of the class of 2015 who are looking at more competitive colleges, their overtaxed counselors say, 10 applications is now commonplace; 20 is taking on a familiar ring; even 30 is not beyond imagining. And why stop there? Brandon Kosatka, director of student services at the Thomas Jefferson School for Science and Technology in Alexandria, Va., recently worked with a student who wanted a spot in a music conservatory program. To find it, she applied to 56 colleges. A spokeswoman for Naviance, an online tool that many high school students and their counselors use to keep track of applications, said one current user’s “colleges I’m applying to” tab already included 60 institutions. Last year the record was 86, she said.
Does this mean increasing competitiveness is entirely an illusion? Suppose in the old days, each top student would apply to either Harvard or Yale. Now each top student applies to both Harvard and Yale, meaning that both colleges get twice as many applicants. Since each of them can only admit the same number of students, it looks like their application rate has been cut in half. But neither one has really become more competitive!
This can’t quite be it. After all, in the first case, Yale would expect 100% of accepted students to attend. In the second, Yale would know that about 50% of accepted students would choose Harvard instead, so it would have to accept twice as many students, and the acceptance rate per application wouldn’t change.
But if more people are following my mother’s strategy of applying to Harvard “just in case” even when you’re not Harvard material, then this could be an important factor. If the number of people who aren’t Harvard material but have mothers who imagine they are is twice as high as the number of people who are really Harvard material, then Harvard admissions will triple. If Harvard accepts these people, they will definitely go to Harvard, so there is no need for Harvard to increase its admission rate to compensate. Here there really is an illusion of increasing competition.
Finally, this process could increase sorting. Suppose that, for the first time in history, a Jewish mother had an accurate assessment of her son’s intellectual abilities, I really was Harvard material, and I was unfairly selling myself short. If the existence of a Common Application lets more people apply to Harvard “just in case”, and if the Harvard admissions committee is good at their job, then the best students will get more efficiently matched with the best institutions. In the past, Harvard might have been losing a lot of qualified applicants to unjustified pessimism; now all those people will apply and the competition will heat up.
And in the past, I think a lot of people, including really smart people, just went to the nearest halfway-decent state college to their house. Partly this was out of humility. Partly it was because people cared about family and community more. And partly it was because college wasn’t viewed as the be-all and end-all of your value as a human being and you had to get into the Ivy League or else your life was over. If all these people are now trying to get into Harvard, that will increase competition too.
Can we measure this?

This is the best I can do. It shows that over the past ten years, the number of students at public universities who come from in-state has dropped by 5%. This is probably related to sorting – people working on sorting themselves efficiently will go to the best school they can get into rather than just the closest one in their state. But it’s not a very dramatic difference. I suspect, though I can’t prove, that this is hiding a larger change at the very top of the distribution.
3.4: Could the issue be that students are just trying harder?
Imagine the exact same students applying to the exact same schools. But in 2009, they take it easy and start studying for their SATs the night before, and in 2019, they all have private tutors and are doing five extracurricular activities. College admissions will seem more competitive in 2019.
Any attempt to measure this will be confounded by reverse causation – increased effort might or might not cause increased selectivity, but increased selectivity will definitely cause increased effort. I’m not sure how to deal with this.
If studying harder improves SAT scores, these could be a proxy for how much effort students putting in. They changed the test in 2016 in a way that makes scores hard to compare, but we can at least compare scores from earlier years. Scores decline between 2005 and 2015 in both math and reading. This may be because more students are taking the SAT (1.5 million in 2008 vs. 2.1 million in 2018) so test-takers are a less selected population. This is kind of surprising given that college enrollment is stable or declining, but it could be that as part of pro-equality measures, schools are pressuring more low-achieving kids to take the SATs in order to “have a chance at college”, but those students don’t really end up attending. In support of this theory, scores are declining most quickly among blacks, Hispanics, and other poorer minority groups who may not have taken the SAT in earlier years; they are stable among whites, and increasing among Asians (increasing numbers of whom may be high-achieving Chinese immigrants). At least, this is the best guess I can come up with for why this pattern is happening. But it means SATs are useless as a measure of whether students are “trying harder”.
Why might students be trying harder? If there’s a ten year lag between things happening and common knowledge that the things have happened, the explosion of college attendance during the 1990s, with an ensuing increase in competitiveness, might have finally percolated down to the average student in the form of advice that getting into college is very hard and they should work to be more competitive. In addition, the Internet is exposing new generations of neurotic parents to messages that unless their child is perfect they will never get into college and probably die alone in a ditch.
Further, the decline of traditional criteria might be causing an increasing emphasis on extracurriculars, which take a harder toll on college students. Because of grade inflation, colleges are no longer counting high school grades as much as they used to; because meritocracy is passé, they’re no longer paying as much attention to the SAT. This implies increased emphasis on extracurriculars – things like student government, clubs, internships, charitable work, and the like. Despite popular misconceptions, the SAT is basically an IQ test, and doesn’t really reward obsessive freaking out and throwing money at the problem. But getting the right set of extracurriculars absolutely rewards obsessively freaking out and throwing money at the problem. Maybe twenty years ago, you just played the IQ lottery and hoped for the best, whereas now you work yourself ragged trying to become Vice-President of the Junior Strivers Club.
But all of this is just speculation; I really don’t know how to get good data on these subjects.
3.5: Are funding cuts reducing the number of college spots available?
Some people argue that cuts in public education are reducing the number of positions available at public universities, meaning the same number of students are competing for fewer spots. This source confirms large cuts in public funding:

These universities have tried to compensate by increasing tuition (or increasing the percent out-of-state students, who pay higher tuition). It looks like they’ve done this on a pretty much one-to-one basis, so that they’re actually getting more money per student now than they did when public funding was higher.

And from California:

It’s not clear that declining state support affected enrollment at all. Colleges just raised their prices by a lot.
In 2007, 2.8x as many students were in public universities compared to private ones. In 2017, the ratio was 2.9. If the problem were limited availability of public universities to absorb students, we might expect the percent of students at public universities to go down. This doesn’t seem to be happening.
Overall it doesn’t look like funding cuts to public universities mattered very much here.
3.6: Conclusions?
The clearest reason for increasing academic competition in the past ten years is the increasing number of applications per person, enabled by the online Common Application. This has doubled the number of applications sent to top colleges like Harvard despite the applicant pool staying the same size. Some of this apparent increased competition is a statistical illusion, but parts of it may be real due to increased sorting.
Other reasons may include increased common knowledge of intense competition making everyone compete more intensely, and decreased use of hard-to-game metrics like the SAT in favor of easy-to-game metrics like extracurriculars.
4. What Has Been Happening Beyond The College Level?
Competition is intensifying.
Between 2006 and 2016, the number of applicants to US medical schools increased by 35% (note change in number of applicants, not number of applications).
In a different statistic covering different years, the number of people enrolled at medical school increased 28% from 2002 to 2017. These two numbers aren’t directly comparable, but by eyeballing them we get the impression that the number of spots is increasing more slowly than the number of applicants, probably much more slowly.
As predicted, the MCAT (the med school version of the SAT) scores necessary for admission have been increasing over time.

This is also the impression I have been getting from doctors I know who work in the medical school and residency admissions process. I got to interview some aspiring residents a few years ago for a not-even-all-that-impressive program, and they were fricking terrifying.
Law schools keep great data on this (thanks, law schools!). US News just tells us outright that law schools are less competitive than in 2008, even at good programs. Here’s the graph:

And despite it feeling like lawyers are everywhere these days, law school attendance has really only grown at the same rate as the population since 1970 or so, and dropped over the past decade. This may be relating to word getting out that lawyer is no longer as lucrative a career as it used to be.
Unlike law schools, graduate school basically fails to keep any statistics whatsoever, and anything that might be happening at the graduate level is a total mystery. We know the number of PhDs granted:

…and that’s about it.
Part of what inspired me to write this post was listening to a famous scientist (can’t remember who) opine that back when he was a student in the 1940s, he kind of wandered into science, found a good position at a good lab, worked up the ranks to become a lab director, and ended up making great discoveries. He noted that this was unthinkable today – you have to be super-passionate to get into science grad school, and once you’re in you have to churn out grant proposals and be the best of the best to have any shot at one day having a lab of your own. I’ve heard many people say things like this, but I can’t find the evidence that would put it into perspective. If anyone knows more about the history of postgraduate education and work in the sciences, please let me know.
I’m also interested in this because it would further help explain undergraduate competition. If more people were gunning for med school and grad school, it would be more important to get into a top college in order to have a good chance of making it in. Since increasing inequality and returns to education have made advanced-degree jobs more valuable relative to bachelors-only jobs, this could explain another fraction of academic competitiveness. But aside from the medical school data, I can’t find evidence that this is really going on.
5. Is Freaking Out Over College Admissions Correct?
Dale and Krueger(2011) examine this question, using lifetime earnings as a dependent variable.
In general, they find no advantage from attending more selective colleges. Although Harvard students earn much more than University of Podunk students, this is entirely explained by Harvard only accepting the highest-ability people. Conditional on a given level of ability, people do not earn more money by going to more selective colleges.
A subgroup analysis did find that people who started out disadvantaged did gain from going to a selective college, even adjusted for pre-existing ability. Blacks, Latinos, and people from uneducated families all gained from selective college admission. The paper doesn’t speculate on why. One argument I’ve heard is that colleges, in addition to providing book-learning, help induct people into the upper class by teaching upper-class norms, speech patterns, etc, as well as by ensuring people will have an upper-class friend network. This may be irrelevant if you’re already in the upper class, but useful if you aren’t.
A second possibility might be that college degrees are a signal that help people overcome statistical discrimination. Studies have shown that requiring applicants share drug test results or criminal histories usually increases black applicants’ chances of getting hired. This is probably because biased employers assume the worst about blacks (that they’re all criminal drug addicts), and so letting black applicants prove that they’re not criminal drug addicts puts them on more equal footing with white/Asian people. In the same way, if employers start with an assumption of white/Asian competence and black/Latino incompetence, selective college attendance might not change their view of whites/Asians, but might represent a major update to their view of blacks/Latinos.
Dale and Krueger also find that the value of college did not increase during the period of their study (from 1976 to 1989).
Does this mean that at least whites and Asians can stop stressing out about what colleges they get into?
What if you want to go to medical or law school? I can’t find an equally rigorous study, but sites advising prospective doctors tell them that the college they went to matters less than you’d think. The same seems true for aspiring lawyers. As usual, there is no good data for graduate schools.
What if you want to be well-connected and important?
From here, the percent of members of Congress who went to Ivy League colleges over time, by party:

Only about 8% of Congresspeople went to Ivy League colleges, which feels shockingly low considering how elite they are in other ways. The trend is going up among Democrats but not Republicans. There is obviously a 40-50 year delay here and it will be a long time before we know how likely today’s college students are to get elected to Congress. But overall this looks encouraging.
On the other hand, presidents and Supreme Court Justices are overwhelmingly Ivy. Each of the last five presidents went to an Ivy League school (Clinton went to Georgetown for undergrad, but did his law degree at Yale). Every current Supreme Court justice except Clarence Thomas went to an Ivy for undergrad, and all of them including Thomas went to an Ivy for law school. But there’s no good way to control for whether this is because of pre-existing ability or because the schools helped them succeed.
Tech entrepreneurs generally went to excellent colleges. But here we do have a hint that this was just pre-existing ability: many of them dropped out, suggesting that neither the coursework nor the signaling value of a degree was very important to them. Bill Gates, Mark Zuckerberg, and Larry Ellison all dropped out of top schools; Elon Musk finished his undergrad, but dropped out of a Stanford PhD program after two days. This suggests that successful tech entrepreneurs come from the population of people smart enough to get into a good college, but don’t necessarily benefit from the college itself.
Overall, unless people come from a disadvantaged background, there’s surprisingly little evidence that going to a good college as an undergraduate is helpful in the long term – except possibly for a few positions like President or Supreme Court justice.
This doesn’t rule out that it’s important to go to a good institution for graduate school; see this paper. In many fields, a prestigious graduate school is almost an absolute requirement for becoming a professor. But there doesn’t seem to be an undergrad equivalent of this.
Digression: UC schools
I mentioned at the beginning the universal perception in California that UCs are much harder to get into. I know this is the perception everywhere, but it seems much worse in California. Sure, it’s anecdotal evidence, but the anecdotes all sound like this:
My friend’s daughter got 3.85 GPA, had 5 AP classes in high school, was on competitive swimming team, volunteered 100+ hours, was active in school activities, yet she got rejected by all 4 UCs that she applied to. And these were not even the highest tier of UCs, not Berkeley. She did not apply for more schools and thought that UC San Diego and UC Santa Cruz were her safe choices. The whole family is devastated.
The data seem to back this up. Dashed line is applications, dotted line is admissions, solid line is enrollments:

…but I don’t know how much of this is just more applications per person, like everywhere else.
Why should UC schools be hit especially hard? I assumed California’s population was growing faster than the rest of the country’s, but this doesn’t seem true: both California and the US as a whole grew 13% between 1990 and 2000, when the cohort attending college between 2008 and 2018 would have been born.
The Atlantic points out that, because of budget cuts, UC schools are admitting more out-of-state students (who have to pay higher tuition), lowering the number of spots available to Californians. But is this really that big an effect?

It looks like nonresidents went from 6% to 12% over the space of a decade. That shouldn’t screw things up so badly.
I’m really not sure about this. One possibility is that California’s schools are remarkably good. On money.com’s list of best colleges, four of the top ten schools are UCs, plus you get to live in California instead of freezing to death in New England. Since the college admissions crisis is concentrated at the top schools, California has been hit especially hard.
I’m not satisfied with this explanation; let me know if you know more.
6. Conclusions
1. There is strong evidence for more competition for places at top colleges now than 10, 50, or 100 years ago. There is medium evidence that this is also true for upper-to-medium-tier colleges. It is still easy to get into medium-to-lower-tier colleges.
2. Until 1900, there was no competition for top colleges, medical schools, or law schools. A secular trend towards increasing admissions (increasing wealth + demand for skills?) plus two shocks from the GI Bill and the Vietnam draft led to a glut of applicants that overwhelmed schools and forced them to begin selecting applicants.
3. Changes up until ten years ago were because of a growing applicant pool, after which the applicant pool (both domestic and international) stopped growing and started shrinking. Increased competition since ten years ago does not involve applicant pool size.
4. Changes after ten years ago are less clear, but the most important factor is probably the ease of applying to more colleges. This causes an increase in applications-per-admission which is mostly illusory. However, part of it may be real if it means students are stratifying themselves by ability more effectively. There might also be increased competition just because students got themselves stuck in a high-competition equilibrium (ie an arms race), but in the absence of data this is just speculation.
5. Medical schools are getting harder to get into, but law schools are getting easier to get into. There is no good data for graduate schools.
6. All the hand-wringing about getting into good colleges is probably a waste of time, unless you are from a disadvantaged background. For most people, admission to a more selective college does not translate into a more lucrative career or a higher chance of admission to postgraduate education. There may be isolated exceptions at the very top, like for Supreme Court justices.
I became interested in this topic partly because there’s a widespread feeling, across the political spectrum, that everything is getting worse. I previously investigated one facet of this – that necessities are getting more expensive – and found it to be true. Another facet is the idea that everything is more competitive and harder to get into. My parents’ generation tells stories of slacking off in high school, not worrying about it too much, and knowing they’d get into a good college anyway. Millennials tell stories of an awful dog-eat-dog world where you can have perfect grades and SAT scores and hundreds of hours of extracurriculars and still get rejected from everywhere you dreamed of.
I don’t really have a strong conclusion here. At least until ten years ago, colleges were harder to get into because more people were able to (or felt pressured to) go to college. The past ten years are more complicated, but might be because of increased stratification by ability. Is that good or bad? I’m not sure. I still don’t feel like I have a great sense of what, if anything, went wrong, whether our parents’ rose-colored picture was accurate, or whether there’s anything short of reversing all progress towards egalitarianism that could take us back. I’m interested to get comments from people who understand this area better than I do.
Social Censorship: The First Offender Model
RJ Zigerell (h/t Marginal Revolution) studies public support for eugenics. He finds that about 40% of Americans support some form of eugenics. The policies discussed were very vague, like “encouraging poor criminals to have fewer children” or “encouraging intelligent people to have more children”; they did not specify what form the encouragement would take. Of note, much lack of support for eugenics was a belief that it would not work; people who believed the qualities involved were heritable were much more likely to support programs to select for them. For example, of people who thought criminality was completely genetic, a full 65% supported encouraging criminals to have fewer children.
I was surprised to hear this, because I thought of moral opposition to eugenics was basically universal. If a prominent politician tentatively supported eugenics, it would provoke a media firestorm and they would get shouted down. This would be true even if they supported the sort of generally mild, noncoercive policies the paper seems to be talking about. How do we square that with a 40% support rate?
I think back to a metaphor for norm enforcement I used in an argument against Bryan Caplan:
Imagine a town with ten police officers, who can each solve one crime per day. Left to their own devices, the town’s criminals would commit thirty muggings and thirty burglaries per day (for the purposes of this hypothetical, both crimes are equally bad). They also require different skills; burglars can’t become muggers or vice versa without a lot of retraining. Criminals will commit their crime only if the odds are against them getting caught – but since there are 60 crimes a day and the police can only solve ten, the odds are in their favor.
Now imagine that the police get extra resources for a month, and they use them to crack down on mugging. For a month, every mugging in town gets solved instantly. Muggers realize this is going to happen and give up.
At the end of the month, the police lose their extra resources. But the police chief publicly commits that from now on, he’s going to prioritize solving muggings over solving burglaries, even if the burglaries are equally bad or worse. He’ll put an absurd amount of effort into solving even the smallest mugging; this is the hill he’s going to die on.
Suppose you’re a mugger, deciding whether or not to commit the first new mugging in town. If you’re the first guy to violate the no-mugging taboo, every police officer in town is going to be on your case; you’re nearly certain to get caught. You give up and do honest work. Every other mugger in town faces the same choice and makes the same decision. In theory a well-coordinated group of muggers could all start mugging on the same day and break the system, but muggers aren’t really that well-coordinated.
The police chief’s public commitment solves mugging without devoting a single officer’s time to the problem, allowing all officers to concentrate on burglaries. A worst-crime-first enforcement regime has 60 crimes per day and solves 10; a mugging-first regime has 30 crimes per day and solves 10.
But this only works if the police chief keeps his commitment. If someone tests the limits and commits a mugging, the police need to crack down with what looks like a disproportionate amount of effort – the more disproportionate, the better. Fail, and muggers realize the commitment was fake, and then you’re back to having 60 crimes a day.
I think eugenics opponents are doing the same thing as the police here: they’re trying to ensure certainty of punishment for the first offender. They’ve established a norm of massive retaliation against the first person to openly speak out in favor of eugenics, so nobody wants to be the first person. If every one of the 40% of people who support eugenics speak out at once, probably they’ll all be fine. But they don’t, so they aren’t.
Why aren’t we in the opposite world, where the people who support eugenics are able to threaten the people who oppose it and prevent them from speaking out? I think just because the opponents coordinated first. In theory one day we could switch to the opposite equilibrium.
I think something like this happened with gay rights. In c. 1969, people were reluctant to speak out in favor of gay rights; in 2019, people are reluctant to speak out against them. Some of that is genuinely changed minds; I don’t at all want to trivialize that aspect. But some of it seems to have just been that in 1969, it was common knowledge that the anti-gay side was well-coordinated and could do the massive-retaliation thing, and now it’s common knowledge that the pro-gay side is well-coordinated and can do the massive retaliation thing. The switch involved a big battle and lots of people massively retaliating against each other, but it worked.
Maybe everyone else already realized something like this. But it changes the way I think about censorship. I’m still against it. But I used to have an extra argument against it, which was something like “If eugenics is taboo, that means there must be near-universal opposition to eugenics, which means there’s no point in keeping it taboo, because even it it wasn’t taboo eugenicists wouldn’t have any power.” I no longer think that argument holds water. “Taboo” might mean nothing more than “one of two equally-sized sides has a tenuous coordination advantage”.
(in retrospect I was pretty dumb for not figuring this out, since it’s pretty the same argument I make in Can Things Be Both Popular And Silenced? The answer is obviously yes – if Zigerell’s paper is right, eugenics is both popular and silenced – but the police metaphor explains how.)
The strongest argument against censorship is still that beliefs should be allowed to compete in a marketplace of ideas. But if I were pro-censorship, I might retort that one reason to try to maintain my own side’s tenuous coordination advantage is that if I relax even for a second, the other side might be able to claw together its own coordination advantage and censor me. This isn’t possible in the “one side must be overwhelmingly more powerful” model of censorship, but it’s something that the “tenuous coordination advantage” model has to worry about. The solution would be some sort of stable structural opposition to censorship in general – but the gay rights example shows that real-world censors can’t always expect that to work out for them.
In order to make moderation easier, please restrict yourself to comments about censorship and coordination, not about eugenics or gay rights.
Less listing
Stocks are fleeing the exchanges in the US. Small and young stocks are disappearing most, with older larger stocks dominating. Less public means more private, not less companies. Companies are more and more financed by private equity, groups of large investors, debt, venture capital and so forth.
This is largely a US phenomenon, which is important for us to figure out what's going on:

What's going on? Doidge, Kahle, Karolyi, and Stulz have some intriguing hypotheses. US business is more and more invested in intellectual capital rather than physical capital -- software, organizational improvements, know-how, not blast furnaces. These, they speculate, are less well financed by issuing shares on the open market, and better by private owners and debt.

Improvements in financial technology such as derivatives allow companies to offload risks without the "agency costs" of equity, and then keep a narrower group of equity investors and more debt financing.
"We argue that the importance of intangible investment has grown but that public markets are not well-suited for young, R&D-intensive companies. Since there is abundant capital available to such firms without going public, they have little incentive to do so until they reach the point in their lifecycle where they focus more on payouts than on raising capital."
I.e. the only reason to go public is for the founders to cash out, and to offer a basically bond-like security for investors. But not to raise capital.
They leave out the obvious question -- to what extent is this driven by regulation? Sarbanes Oxley, SEC, and other regulations and political interference make being a public company in the US a more and more costly, and dangerous, proposition. This helps to answer the question, why in the US.
The move of young, entrepreneurial companies who need financing to grow to private markets, limited to small numbers of qualified investors, has all sorts of downsides. If you worry about inequality, regulations that only rich people may invest in non-traded stocks should look scandalous, however cloaked in consumer protection. But if you can only have 500 investors, they will have to be wealthy. Moving financing from equity to debt and derivatives does not look great from a financial stability point of view.
Our financial system has become remarkably democratized in recent years. Once upon a time only wealthy individuals held stocks, and had access to the superior investment returns they provide. Now index funds, 4501(k) plans are open to everyone, and their pension funds. What will they invest in as listed equity disappears?
A wealth tax, easy to assess on publicly traded stock and much harder to assess on private companies with complex share structures -- especially structures designed to avoid the tax -- will only exacerbate the problem. More moves to regulate the boards and activities of public companies will only exacerbate the problem.
An IDEA Whose Time Has Come
Wage Stagnation: Much More Than You Wanted To Know
[Epistemic status: I am basing this on widely-accepted published research, but I can’t guarantee I’ve understood the research right or managed to emphasize/believe the right people. Some light editing to bring in important points people raised in the comments.]
You all know this graph:

Median wages tracked productivity until 1973, then stopped. Productivity kept growing, but wages remained stagnant.
This is called “wage decoupling”. Sometimes people talk about wages decoupling from GDP, or from GDP per capita, but it all works out pretty much the same way. Increasing growth no longer produces increasing wages for ordinary workers.
Is this true? If so, why?
1. What Does The Story Look Like Across Other Countries And Time Periods?
Here’s a broader look, from 1800 on:

It no longer seems like a law of nature that productivity and wages are coupled before 1973. They seem to uncouple and recouple several times, with all the previous graphs’ starting point in 1950 being a period of unusual coupledness. Still, the modern uncoupling seems much bigger than anything that’s happened before.
What about other countries? This graph is for the UK (you can tell because it spells “labor” as “labour”)

It looks similar, except that the decoupling starts around 1990 instead of around 1973.
And here’s Europe:

This is only from 1999 on, so it’s not that helpful. But it does show that even in this short period, France remains coupled, Germany is decoupled, Spain is…doing whatever Spain is doing, and Italy is so pathetic that the problem never even comes up. Overall not sure what to think about these.
2. Could Apparent Wage Decoupling Be Because Of Health Insurance?
Along with wages, workers are compensated in benefits like health insurance. Since health insurance has skyrocketed in price, this means total worker compensation has gone up much more than wages have. This could mean workers are really getting compensated much more, even though they’re being paid the same amount of money. This view has sometimes been associated with economist Glenn Hubbard.
There are a few lines of argument that suggest it’s not true.
First, wage growth has been worst for the lowest-paid workers. But the lowest-paid workers don’t usually get insurance at all.


Second, the numbers don’t really add up. Median household income in 1973 was about $48,000 in today’s dollars. Since then, productivity has increased by between 70% and 140% (EVERYBODY DISAGREES ON THIS NUMBER), so if median income had kept pace with productivity it should be between $82,000 and $115,000. Instead, it is $59,000. So there are between $23,000 and $67,000 of missing income to explain.
The average health insurance policy costs about $7000 per individual or $20000 per family, of which employers pay $6000 and $14000 respectively. But as mentioned above, many people do not have employer-paid insurance at all, so the average per person cost is less than that. Usually only one member of a household will pay for family insurance, even if both members work; sometimes only one member of a household will buy insurance at all. So the average cost of insurance to a company per employee is well below the $6000 to $14000 number. If we round it off to $6000 per person, that only explains a quarter of the lowest estimate of the productivity gap, and less than a tenth of the highest estimate. So it’s unlikely that this is the main cause.
Third, some people have tried measuring productivity vs. total compensation, with broadly similar results:


The first graph is from the left-wing Economic Policy Institute, whose bias is towards proving that wage stagnation is real and important. The second graph is from the right-wing Heritage Foundation, whose bias is towards proving that wage stagnation is fake and irrelevant. The third graph is from the US Federal Reserve, a perfectly benevolent view-from-nowhere institution whose only concern is the good of the American people. All three agree that going from earnings to total compensation alone closes only a small part of the gap. The EPI also mentions that most of the difference between earnings and compensation opened up in the 1960s and stayed stable thereafter (why? haven’t health insurance costs gone up more since then), which further defeats this as an explanation for post-1973 trends.
We shouldn’t dismiss this as irrelevant, because many things that close only a small part of the gap may, when added together, close a large part of the gap. But this doesn’t do much on its own.
3. Could Apparent Wage Decoupling Be An Artifact Of Changing Demographics?
The demographics of the workforce have changed a lot since 1973; for example, more workers are women and minorities. If women and minorities get paid less, then as more of them enter the workforce, the lower “average” wages will go (without any individual getting paid less). If they gradually enter the workforce at the same rate that wages are increasing, this could look like wages being stagnant.
But if we disaggregate statistics by race and gender, we don’t see this. Here’s average male wage over the relevant time period:

And here’s average income disaggregated by race:

The patterns for whites and men are the same as the general pattern.
There is one unusual thing in this area. Here’s the pattern for women:

Women’s income is rising at almost the same rate as productivity! This is pretty interesting, but as far as I can tell it’s just because women’s career prospects have been improving over time because of shifting cultural attitudes, affirmative action, and the increasing dominance of female-friendly service and education-heavy jobs. I’m not sure this has any greater significance.
Did increased female participation in the workforce increase the supply of labor and so drive the price of labor down? There’s a tiny bit of evidence for that in the data, which show female workforce participation started rising much faster around 1973, with a corresponding increase in total workforce. But this spurt trailed off relatively quickly, and female participation has been declining since about 2000, and the wage stagnation trend continues. I don’t want to rule out the possibility that this was part of what made 1973 in particular such a strong inflection point, but even if it was, it’s long since been overwhelmed by other factors.
4. Could Apparent Wage Decoupling Be An Artifact Of How We Measure Inflation?
Martin Feldstein is a Harvard economics professor, former head of the National Bureau of Economic Researchers, former head of the President’s Council of Economic Advisors, etc. He believes that apparent wage stagnation is an artifact of mismeasurement.
His argument is pretty hard for me to understand, but as best I can tell, it goes like this. In order to calculate wage growth since 1973, we take the nominal difference in wages, then adjust for inflation. We calculate wage inflation with something called the Consumer Price Index, which is the average price of lots of different goods and services.
But in order to calculate productivity growth since 1973, we use a different index, the “nonfarm business sector output price index”, which is based on how much money companies get for their products.
These should be similar if consumers are buying the same products that companies are making. But there can be some differences. For example, if you’re looking at US statistics only, then some businesses may be selling to foreign markets with different inflation rates, and some consumers may be buying imported goods from countries with different inflation rates. Also (and I’m not sure I understand this right), if people own houses, CPI pretends they are paying market rent to avoid ignoring housing costs, but PPI doesn’t do this. Also, PPI is not as good at including services as CPI. So consumer and producer price indexes differ.
In fact, consumer inflation has been larger than producer inflation since 1973. So when we adjust wages for consumer inflation, they go way down, but when we adjust productivity for producer-inflation, it only goes down a little. This means that these different inflation indices make it look like productivity has risen much faster than wages, but actually they’ve risen the same amount.
As per Feldstein:
The level of productivity doubled in the U.S. nonfarm business sectorbetween 1970 and 2006. Wages, or more accurately total compensation per hour, increased at approximately the same annual rate during that period if nominal compensation is adjusted for inflation in the same way as the nominal output measure that is used to calculate productivity.
More specifically, the doubling of productivity represented a 1.9 percent annual rate of increase. Real compensation per hour rose at 1.7 percent per year when nominal compensation is deflated using the same nonfarm business sector output price index. In the period since 2000, productivity rose much more rapidly (2.9 percent ayear) and compensation per hour rose nearly as fast (2.5 percent a year).
Why is the CPI increasing so much faster than business-centered inflation indices?

The Federal Reserve blames tech. The services-centered CPI has comparatively little technology. The goods-heavy PPI (a business-centered index of inflation) has a lot of it. Tech is going down in price (how much did a digital camera cost in 1990? How about now?) so the PPI stays very low while the CPI keeps growing.
How much does this matter?
The left-leaning Economic Policy Institute says it explains 34% of wage decoupling:

The right-leaning Heritage Foundation says it explains more:

If we estimate the size of the gap as 70 pp (between total compensation CPI and productivity), switching to the top IPD measure closes 67% of the gap; switching to the PCE measure explains 37% of the gap. I’m confused because the EPI is supposedly based on Mishel and Gee, who say they have used the GDP deflator, which is the same thing as the IPD which the Heritage Foundation says they use. I think the difference is that Mishel and Gee haven’t already applied the change from wages to total compensation when they estimate percent of the gap closed? But I’m not sure.
One other group has tried to calculate this: Pessoa and Van Reenan: Decoupling Of Wage Growth And Productivity Growth? Myth And Reality. According to a summary I read, they believe 40% of wage decoupling is because of these inflation related concerns, but I have trouble finding that number in the paper itself.
And the CBO looks into the same issue. They’re not talking about it relative to productivity, but they say that technical inflation issues mean that the standard wage stagnation story is false, and wages have really grown 41% from 1979 – 2013. Since productivity increased somewhere between 70% and 100% during that time, this seems similar to some of the other estimates – inflation technicalities explain between 1/3 and 2/3 of the problem.
Everyone I read seems to agree this issue exists and is interesting, but I’m not sure I entirely understand the implications. Some people say that this completely debunks the idea of wage decoupling and it’s actually only half or a third what the raw numbers say. Other people seem to agree that a big part of wage decoupling is these inflation technicalities, but suggest that although they have important technical implications, if you want to know how the average worker on the street is doing the CPI is still the way to go.
Superstar economist Larry Summers (with Harvard student Anna Stansbury) comes the closest to having a real opinion on this here:
When investigating consumers’ experienced rise in living standards as in Bivens and Mishel (2015), a consumer price deflator is appropriate; however, as Feldstein (2008) argues, when investigating factor income shares a producer price deflator is more appropriate because it reflects the real cost to firms of employing workers.
I am a little confused by this. On the one hand, I do want to investigate consumers’ experienced rise (or lack thereof) in living standards. This is the whole point – the possibility that workers’ living standards haven’t risen since 1973. But most people nowadays work in services. If you deflate their wages with an index used mostly for goods, are you just being a moron and ensuring you will be inaccurate?
Summers and Stansbury continue:
Lawrence (2016) analyzes this divergence more recently, comparing average compensation to net productivity, which is a more accurate reflection of the increase in income available for distribution to factors of production. Since depreciation has accelerated over recent decades, using gross productivity creates a misleadingly large divergence between productivity and compensation. Lawrence finds that net labor productivity and average compensation grew together until 2001, when they started to diverge i.e. the labor share started to fall. Many other studies also find a decline in the US labor share of income since about 2000, though the timing and magnitude is disputed (see for example Grossman et al 2017, Karabarbounis and Neiman 2014, Lawrence 2015, Elsby Hobijn and Sahin 2013, Rognlie 2015, Pessoa and Van Reenen 2013).
If I intepret this correctly, it looks like it’s saying that the real decoupling happened in 2000, not in 1973. I see a lot of papers saying the same thing, and I don’t understand where they’re diverging from the people who say it happened in 1973. Maybe they’re using Feldstein’s method of calculating inflation? I think this must be true – if you look at the Heritage Foundation graph above, “total compensation measured with Feldstein’s method” and productivity are exactly equal to their 1973 level in 2000, but diverge shortly thereafter so that today compensation has only grown 77% compared to productivity’s 100%.
Nevertheless, Summers and Stansbury go on to give basically exactly the same “Why have wages been basically stagnant since 1973? Why are they decoupled from productivity?” narrative as everyone else, so it sure doesn’t look like they think any of this has disproven that. It looks like maybe they think Feldstein is right in some way that doesn’t matter? But I don’t know enough economics to figure out what that way would be. And it looks like Feldstein believes his rightness matters very much, and other economists like Scott Sumner seem to agree. And I cannot find anyone, anywhere, who wants to come out and say explicitly that Feldstein’s argument is wrong and we should definitely measure wage stagnation the way everyone does it.
My conclusions from this section, such as they are, go:
1. Arcane technical points about inflation might explain between 33% and 66% of the apparent wage stagnation/decoupling.
2. “Explain” may not mean the same as “explain away”, and it’s not completely clear how these points relate to anything we care about
5. Could Wage Decoupling Be Explained By Increasing Labor-Vs-Capital Inequality?
Economists divide inequality into two types. Wage inequality is about how much different wage-earners (or salary-earners, here the terms are used interchangeably) make relative to each other. Labor-vs-capital inequality is about how much wage earners earn vs. how much capitalists get in profits. These capitalists are usually investors/shareholders, but can also be small business owners (or, sometimes, large business owners). Since tycoons like Jeff Bezos and Mark Zuckerberg get most of their compensation from stocks, they count as “capitalists” even if they are paid some token salary for the work they do running their companies.
Here is the labor-vs-capital split for the US over the relevant time period; note the very truncated vertical axis:

This type of inequality was about the same in the early 1970s as in the early 2000s, and has no clear inflection point around 1973, so it probably didn’t start this trend off. But it did start seriously decreasing around 2000, the same time people who use the more careful inflation methodology say wages and productivity really decoupled. And obviously labor getting less money in general is the sort of thing that makes wages go down.
Why is labor-vs-capital inequality increasing? For the long story, read Piketty (my review, highlights, comments). But the short story includes:
Today’s wage inequality is tomorrow’s labor-vs-capital inequality. If some people get paid more than others, they can invest, their savings will compound, and they will have more capital. As wage inequality increases (see below), labor-vs-capital inequality does too.
The tech industry is more capital-intensive than labor-intensive. For example, Apple has 100,000 employees and makes $250 billion/year, compared to WalMart with 2 million employees and $500 billion/year – in other words, Apple makes $2.5 million per employee compared to Wal-Mart’s $250,000. Apple probably pays its employees more than Wal-Mart does, but not ten times more. So more of Apple’s revenue goes to capital compared to Wal-Mart’s. As tech becomes more important than traditional industries, capital’s share of the pie goes up. This is probably a big reason why capital has been doing so well since 2000 or so.
There’s an iconoclastic strain of thought that says most of the change in labor-vs-capital is just housing. Houses count as capital, so as housing costs rise, so does capital’s share of the economy. Read Matt Ronglie’s work (paper, summary, Voxsplainer) for more. Since houses are neither involved in corporate productivity nor in wages, I’m not sure how this affects wage-productivity decoupling if true.
Whatever the cause, the papers I read suggest that increasing labor-vs-capital inequality explains maybe 10-20% of of decoupling, almost all concentrated in the 2000 – present period.
6. Could Wage Decoupling Be Explained By Increasing Wage Inequality?
The other part of the two-pronged inequality picture above. This one seems more important.
One way economists look at this is in the difference between the median wage and the average wage:

Add in the other things we talked about – the health insurance, the inflation technicalities, the declining share of labor – and the “””average””” worker is doing almost as well as they were in 1973. In fact, this is almost tautologically true. If the entire pie is growing by X amount, and labor’s relative share of the pie is staying the same, then labor should be getting the same absolute amount, and (ignoring changes in the number of laborers) the average laborer should get the same amount.
So the decline in median wage is a mean vs. median issue. A few high-earners are taking a lot of the pie, keeping the mean constant but lowering the median. How high?

Remember, productivity has grown by 70-100% through this period. So even though the top 5% have seen their incomes grow by 69%, they’re still not growing as fast as productivity. The top 1% have grown a bit faster than productivity, although still not that much. The top 0.1% are doing really well.
This is generally considered the most important cause of wage stagnation and wage decoupling, other than among the iconoclasts who think the inflation issues are more important. Above, I referred to a few papers that tried to break down the importance of each cause. EPI thinks wage inequality explains 47% of the problem. Pessoa and Van Reenen think it explains more like 20% according to Mishel’s summary (my eyeballing of the paper suggests more like 33%, but I am pretty uncertain about this).
7. Is Wage Inequality Increasing Because Of Technology?
Here’s one story about why wage inequality is increasing.
In the old days, people worked in factories. A slightly smarter factory worker might be able to run the machinery a little better, or do something else useful, but in the end everyone is working on the same machines.
In the modern economy, factory workers are being replaced by robots. This creates very high demand for skilled roboticists, who get paid lots of money to run the robots in the most efficient way, and very low demand for factory workers, who need to be retrained to be fast food workers or something.
Or, in the general case, technology separates people into the winners (the people who are good with technology and who can use it to do jobs that would have taken dozens or hundreds of people before) and the losers (people who are not good with technology, and so their jobs have been automated away).
From an OECD paper:
Common explanations for increased wage inequality such as skill-biased technological change and globalisation cannot plausibly account for the disproportionate wage growth at the very top of the wage distribution. Skill-biased technological change and globalisation may both raise the relative demand for high-skilled workers, but this should be reflected in broadly rising relative wages of high-skilled workers rather than narrowly rising relative wagesof top-earners. Brynjolfsson and McAfee (2014) argue that digitalisation leads to “winner-takes-most” dynamics, with innovators reaping outsize rewards as digital innovations are replicable at very low cost and have a global scale. Recent studies provide evidence consistent with “winner-take-most” dynamics, in the sense that productivity of firms at the technology frontier has diverged from the remaining firms and that market shares of frontier firms have increased (Andrews et al., 2016). This type of technological change may allow firms at the technology frontier to raise the wages of its key employees to “superstar” levels.
It…sounds like they’re saying that technological change can’t be the answer, then giving arguments for why the answer is technological change.
I think this is just the authors’ poor writing skills, and that the real argument is less confusing. The Huffington Post is surprisingly helpful, describing it as:
What this means is that skilled professionals are not just winning out over working class stiffs, but the richest of the top 0.01 percent are winning out over the professional class as a whole.
That Larry Summers paper mentioned before becomes relevant here again. It argues that wages and productivity are not decoupled – which I know is a pretty explosive thing to say three thousand words in to an essay on wage decoupling, but let’s hear him out.
He argues that apparent decoupling between productivity and wages could result either from literal decoupling – that is, none of the gains of increasing productivity going to workers – or from unrelated trends – for example, increasing productivity giving workers an extra $1000 at the same time as something else causes workers to lose $1000. If a company made $1000 extra and the boss pocketed all of it and didn’t give workers any, that would be literal decoupling. If a company made $1000 extra, it gave workers $1000 extra, but globalization means there’s less demand for workers and so salaries would otherwise have dropped by $1000, so now they stay the same, that’s an unrelated trend.
Summers and Stansbury investigate this by seeing if wages increase more during the short periods between 1973 and today when productivity is unusually high, and if they stagnate more (or decline) during the short periods when it is unusually low. They find this is mostly true:
We find substantial evidence of linkage between productivity and compensation: Over 1973–2016, one percentage point higher productivity growth has been associated with 0.7 to 1 percentage points higher median and average compensation growth and with 0.4 to 0.7 percentage points higher production/nonsupervisory compensation growth.
S&S are very careful in this paper and have already adjusted for health insurance issues and inflation calculation issues. They find that once you adjust for this, productivity and wages are between 40% and 100% coupled, depending on what measure you use. (I don’t exactly understand the difference between the two measures they give; surely taking the median worker is already letting you consider inequality and you shouldn’t get so much of a difference by focusing on nonsupervisory workers?) As mentioned before, they finds the coupling is much less since 2000. They also find similar results in most other countries: whether or not those countries show apparent decoupling, they remain pretty coupled in terms of actual productivity growth:wage growth correlation.
They argue that if technology/automation were causing rising wage inequality or rising labor-capital inequality, then median wage should decouple from productivity fastest during the periods of highest productivity growth. After all, productivity growth represents the advance of labor-saving technology. So periods of high productivity growth are those where the most new technology and automation are being deployed, so if this is what’s driving wages down, wages should decrease fastest during this time.
They test this a couple of different ways, and find that it is false before the year 2000, but somewhat true afterwards, mostly through labor-capital inequality. They don’t really find that technology drives wage inequality at all.
I understand why technology would mean decoupling happens fastest during the highest productivity growth. But I’m not sure I understand what they mean when they say there is no decoupling and productivity growth translates into wage growth? Shouldn’t this disprove all posited causes of decoupling so far, including policy-based wage inequality? I’m not sure. S&S don’t seem to think so, but I’m not sure why. Overall I find this paper confusing, but I assume its authors know what they’re doing so I will accept its conclusions as presented.
So it sounds like, although technology probably explains some top-10% people doing moderately better than the rest, it doesn’t explain the stratospheric increase in the share of the 1%, which is where most of the story lies. I would be content to dismiss this as unimportant, except that…

…all the world’s leading economists disagree.
Maybe when they say “income inequality”, they’re talking about a more intuitive view of income inequality where some programmers make $150K and some factory workers make $30K and this is unequal and that’s important – even though it is not related to the larger problem of why everybody except the top 1% is making much less than predicted. I’m not sure.
I feel bad about dismissing so many things as “probably responsible for a few percent of the problem”. It seems like a cop-out when it’s hard to decide whether something is really important or not. But my best guess is still that this is probably responsible for a few percent of the problem.
8. Is Wage Inequality Increasing Because Of Policy Changes?
Hello! We are every think tank in the world! We hear you are wondering whether wage inequality is increasing because of policy changes! Can we offer you nine billion articles proving that it definitely is, and you should definitely be very angry? Please can we offer you articles? Pleeeeeeeeaaase?!
Presentations of this theory usually involve some combination of policies – decreasing union power, low minimum wages, greater acceptance of very high CEO salary – that concentrate all gains in the highest-paid workers, usually CEOs and executives.
I have trouble making the numbers add up. Vox has a cute thought experiment here where they imagine the CEO of Wal-Mart redistributing his entire salary to all Wal-Mart workers equally, possibly after having been visited by three spirits. Each Wal-Mart employee would make an extra $10. If the spirits visited all top Wal-Mart executives instead of just the CEO, the average employee would get $30. This is obviously not going to single-handedly bring them to the middle-class.
Vox uses such a limited definition of “top executive” that only five people are included. What about Wal-Mart’s 1%?
The Wal-Mart 1% will include 20,000 people. To reach the 1% in the US, you need to make $400,000 per year; I would expect Wal-Mart’s 1% to be lower, since Wal-Mart is famously a bad place to work that doesn’t pay people much. Let’s say $200,000. That means the Wal-Mart 1% makes a total of $4 billion. If their salary were distributed to all 2 million employees, those employees would make an extra $2,000 per year; maybe a 10% pay raise. And of course even in a perfectly functional economy, we couldn’t pay Wal-Mart management literally $0, so the real number would be less than this.
Maybe the problem is that Wal-Mart is just an unusually employee-heavy company. What about Apple? Their CEO makes $12 million per year. If that were distributed to their 132,000 employees, they would each make an extra $90.
How many total high-paid executives does Apple have? It looks like Apple hires up to 130 MBAs from top business schools per year; if we imagine they last 10 years each, they might have 1000 such people, making them a “top 1%”. If these people get paid $500,000 each, they could earn 500 million total. That’s enough to redistribute $4,000 to all Apple employees, which still isn’t satisfying given the extent of the problem.
Some commenters bring up the possibility that I’m missing stocks and stock options, which make up most of the compensation of top executives. I’m not sure whether this gets classified as income (in which case it could help explain income inequality) or as capital (in which case it would get filed under labor-vs-capital inequality). I’m also not sure whether Apple giving Tim Cook lots of stocks takes money out of the salary budget that could have gone to workers instead. For now let’s just accept that the difference between mean and median income shows that something has to be happening to drive up the top 1% or so of salaries.
What policies are most likely to have caused this concentration of salaries at the top?

Many people point to a decline in unions. This decline does not really line up with the relevant time period – it started in the early 1960s, when productivity and wages were still closely coupled. But it could be a possible contributor. Economics Policy Institute cites some work saying it may explain up to 10% of decoupling even for non-union members, since the deals struck by unions set norms that spread throughout their industries. A group of respected economists including David Card looks into the issue and finds similar results, saying that the decline of unions may explain about 14% or more of increasing wage inequality (remember that wage inequality is only about 40% of decoupling, so this would mean it only explains about 5% of decoupling). The conservative Heritage Foundation has many bad things to say about unions but grudgingly admits they may raise salaries by up to 10% among members (they don’t address non-members). Based on all this, it seems plausible that deunionization may explain about 5-10% of decoupling.
Another relevant policy that could be shaping this issue is the minimum wage. EPI notes that although the minimum wage never goes down in nominal terms, if it doesn’t go up then it’s effectively going down in real terms and relative to productivity. This certainly sounds like the sort of thing that could increase wage inequality.

But let’s look at that graph by percentiles again:
Wage stagnation is barely any better for the 90th percentile worker than it is for the people at the bottom. And the 90th percentile worker isn’t making minimum wage. This may be another one that adds a percentage point here and there, but it doesn’t seem too important.
I can’t find anything about it on EPI, but Thomas Piketty thinks that tax changes were an important driver of wage inequality. I’ll quote my previous review of his book:
He thinks that executive salaries have increased because – basically – corporate governance isn’t good enough to prevent executives from giving themselves very high salaries. Why didn’t executives give themselves such high salaries before? Because before the 1980s the US had a top tax rate of 80% to 90%. As theory predicts, people become less interested in making money when the government’s going to take 90% of it, so executives didn’t bother pulling the strings it would take to have stratospheric salaries. Once the top tax rate was decreased, it became worth executives’ time to figure out how to game the system, so they did. This is less common outside the Anglosphere because other countries have different forms of corporate governance and taxation that discourage this kind of thing.
Piketty does some work to show that increasing wage inequality in different countries is correlated with those countries’ corporate governance and taxation policies. I don’t know if anyone has checked how that affects wage decoupling.
9. Conclusions
1. Contrary to the usual story, wages have not stagnated since 1973. Measurement issues, including wages vs. benefits and different inflation measurements, have made things look worse than they are. Depending on how you prefer to think about inflation, median wages have probably risen about 40% – 50% since 1973, about half as much as productivity.
2. This leaves about a 50% real decoupling between median wages and productivity, which is still enough to be serious and scary. The most important factor here is probably increasing wage inequality. Increasing labor-capital inequality is a less important but still significant factor, and it has become more significant since 2000.
3. Increasing wage inequality probably has a lot to do with issues of taxation and corporate governance, and to some degree also with issues surrounding unionization. It probably has less to do with increasing technology and automation.
4. If you were to put a gun to my head and force me to break down the importance of various factors in contributing to wage decoupling, it would look something like (warning: very low confidence!) this:
– Inflation miscalculations: 35%
– Wages vs. total compensation: 10%
– Increasing labor vs. capital inequality: 15%
—- (Because of automation: 7.5%)
—- (Because of policy: 7.5%)
– Increasing wage inequality: 40%
—- (Because of deunionization: 10%)
—- (Because of policies permitting high executive salaries: 20%)
—- (Because of globalization and automation: 10%)
This surprises me, because the dramatic shift in 1973 made me expect to see a single cause (and multifactorial trends should be rare in general, maybe, I think). It looks like there are two reasons why 1973 seems more important than it is.
First, most graphs trying to present this data begin around 1950. If they had begun much earlier than 1950, they would have showed several historical decouplings and recouplings that make a decoupling in any one year seem less interesting.
Second, 1973 was the year of the 1973 Oil Crisis, the fall of Bretton Woods, and the end of the gold standard, causing a general discombobulation to the economy that lasted a couple of years. By the time the economy recombobulated itself again, a lot of trends had the chance to get going or switch direction. For example, here’s inflation:

5. Inflation issues and wage inequality were probably most important in the first half of the period being studied. Labor-vs-capital inequality was probably most important in the second half.
6. Continuing issues that confuse me:
– How much should we care about the difference between inflation indices? If we agree that using CPI to calculate this is dumb, should we cut our mental picture of the size of the problem in half?
– Why is there such a difference between the Heritage Foundation’s estimate of how much of the gap inconsistent deflators explain (67%) and the EPI’s (34%)? Who is right?
– Does the Summers & Stansbury paper argue against policy-based wage inequality as a cause of median wage stagnation, at least until 2000?
– Are there enough high-paid executives at companies that, if their money were redistributed to all employees, their compensation would have increased significantly more in step with productivity? If so, where are they hiding? If not, what does “increasing wage inequality explains X% of decoupling” mean?
– What caused past episodes of wage decoupling in the US? What ended them?
– How do we square the apparent multifactorial nature of wage decoupling with its sudden beginning in 1973 and with the general argument against multifactorial trends?
The Real Problem with the Blue-State Model
Public Education’s Dirty Secret
Bad teaching is a common explanation given for the disastrously inadequate public education received by America’s most vulnerable populations. This is a myth. Aside from a few lemons who were notable for their rarity, the majority of teachers I worked with for nine years in New York City’s public school system were dedicated, talented professionals. Before joining the system I was mystified by the schools’ abysmal results. I too assumed there must be something wrong with the teaching. This could not have been farther from the truth.
Teaching French and Italian in NYC high schools I finally figured out why this was, although it took some time, because the real reason was so antithetical to the prevailing mindset. I worked at three very different high schools over the years, spanning a fairly representative sample. That was a while ago now, but the system has not improved since, as the fundamental problem has not been acknowledged, let alone addressed. It would not be hard, or expensive, to fix.
Washington Irving High School, 2001–2004
My NYC teaching career began a few days before September 11, 2001 at Washington Irving High School. It was a short honeymoon period; the classes watched skeptically as I introduced them to a method of teaching French using virtually no English. Although the students weren’t particularly engaged, they remained respectful. During first period on that awful day there was a horrendous split-second noise. A plane flew right overhead a mere moment before it blasted into the north tower of the World Trade Center. At break time word was spreading among the staff. Both towers were hit and one had already come down. When I went to my next class I told the students what had happened. There was an eruption of rejoicing at the news. Many students clapped and whooped their approval, some getting out of their seats to do a sort of victory dance. It was an eye-opener, and indicative of what was to come.
The next three years were a nightmare. The school always teetered on the verge of chaos. The previous principal had just been dismissed and shunted to another school district. Although it was never stated, all that was expected of teachers was to keep students in their seats and the volume down. This was an enormous school on five floors, with students cordoned off into separate programs. There was even a short-lived International Baccalaureate Program, but it quickly failed. Whatever the program, however, the atmosphere of the school was one of danger and deceit. Guards patrolled the hallways, sometimes the police had to intervene. Even though the security guards carefully screened the students at the metal detectors posted at every entrance, occasionally arms crept in. Girls sometimes managed to get razors in, the weapon of choice against rivals for boys’ attention. Although I don’t know of other arms found in the school (teachers were kept in the dark as much as possible), one particularly disruptive and dangerous boy was stabbed one afternoon right outside school. It appears he came to a violent death a few years later. What a tragic waste of human potential.
As the weeks dragged painfully into months, it became apparent that the students wouldn’t learn anything. It was dumbfounding. It was all I could do to keep them quiet; that is, seated and talking among themselves. Sometimes I had to stop girls from grooming themselves or each other. A few brave souls tried to keep up with instruction. A particularly good history teacher once told me that she interrupted a conversation between two girls, asking them to pay attention to the lesson. One of them looked up at her scornfully and sneered, “I don’t talk to teachers,” turning her back to resume their chat. She told me that the best school she ever worked at was in Texas, where her principal managed not only to suspend the most disruptive students for long periods, he also made sure they were not admitted during that time to any other school in the district. It worked; they got good results.
This was unthinkable in New York, where “in-house suspension” was the only punitive measure. It would be “discriminatory” to keep the students at home. The appropriate paperwork being filed, the most outrageously disruptive students went for a day or two to a room with other serious offenders. The anti-discrimination laws under which we worked took all power away from the teachers and put it in the hands of the students.
Throughout Washington Irving there was an ethos of hostile resistance. Those who wanted to learn were prevented from doing so. Anyone who “cooperated with the system” was bullied. No homework was done. Students said they couldn’t do it because if textbooks were found in their backpacks, the offending students would be beaten up. This did not appear to be an idle threat. Too many students told their teachers the same thing. There were certainly precious few books being brought home.
I tried everything imaginable to overcome student resistance. Nothing worked. At one point I rearranged the seating to enable the students who wanted to engage to come to the front of the classroom. The principal was informed and I was reprimanded. This was “discriminatory.” The students went back to their chosen seats near their friends. Aside from imposing order, the only thing I succeeded at was getting the students to stand silently during the Pledge of Allegiance and mumble a few songs in French. But it was a constant struggle as I tried to balance going through the motions of teaching with keeping them quiet.
The abuse from students never let up. We were trained to absorb it. By the time I left, however, I had a large folder full of the complaint forms I’d filled out documenting the most egregious insults and harassment. There was a long process to go through each time. The student had a parent or other representative to state their case at the eventual hearing and I had my union rep. I lost every case.
Actually, the girls were meaner than the boys. The latter did not engage at all. They simply ignored me. Except for the delinquents among them, the boys didn’t make trouble. The girls on the other hand could be malicious. One girl even called me a “fucking white bitch.” It was confidence-destroying and extremely stressful. I was often reported to the principal for one transgression or another, like taking a sheet of paper from a student. Once I was even reprimanded for calmly taking my own cellphone from a girl who’d held on to it for half an hour, refusing all my requests to hand it back. The administration was consistently on the side of the student. The teacher was the fall guy, every time.
The abuse ranged from insults to outright violence, although I myself was never physically attacked. Stories abounded, however, of hard substances like bottles of water being thrown at us, teachers getting smacked on the head from behind, pushed in stairwells, and having doors slammed in our faces. The language students used was consistently obscene. By far the most commonly heard word throughout the school, literally hundreds of times a day, like a weapon fired indiscriminately, was “nigga.” The most amazing story from those painful years was the time I said it myself.
Sometimes you just have had enough. One day a girl sitting towards the back of the classroom shouted at some boy up front, “Yo! Nigga! Stop that!” I stood up as tall as I could and said in my most supercilious voice, “I don’t know which particular nigga the young lady is referring to, but whoever it is, would you please stop it.” The kids couldn’t believe their ears:
“Yo, miss! You can’t say that!”
“Why not? You say it all the time.”
“Uhh… Because you’re old.”
“That’s not why. Come on, tell the truth.”
This went on for a bit, until one brave lad piped up: “Because you’re white.” “Okay,” I said, “because I’m white. Well what if I said to you, ‘You’re not allowed to say some word because you’re black.’ Would that be okay?” They admitted that it wouldn’t. No one seemed to report it. To this day, it’s puzzling that I didn’t lose my job over that incident. I put it down to basic human decency.
Of course my teaching method had to be largely scrapped. The kids didn’t listen to me in either French or English. But they had a certain begrudging respect for me, I think because I told them the truth. I’d plead with them, “Look, kids, you’re destroying yourselves. Yes, the system stinks, but it’s the only show in town. Please, please don’t do this to yourselves. Education is your only way out.” But it was useless. I didn’t possess whatever magic some teachers have that explains their success, however limited.
Aside from the history teacher from Texas, other Washington Irving educators stood out as extraordinary, and this in an unimaginably bad learning environment. One was a cheerful Lebanese math teacher who had been felled as a child by polio. He called himself “the million dollar man” because of his handicapped parking permit, quite a handy advantage in Manhattan. Although he could only walk on crutches, he kept those kids in line! His secret? A lovely way about him and complete but polite disdain for his students. Where he came from, students were not allowed to act that way. Another was a German teacher, the wife of a Lutheran minister. Her imposing presence—she fit the valkyrie stereotype—kept those mouths closed. You could hear a pin drop in her unusually tidy classroom, and she managed to teach some German to the few hardy souls who wanted to learn it.
The most impressive of all was a handsome black American from Minnesota. He towered over us all, both physically and what the French call morally. He exuded an aura that inspired something like awe in his colleagues and students. I think he taught social studies. He was the only teacher who got away with blacking out his classroom door window, which added to his mystique. He engaged his students by concentrating their efforts on putting together a fashion show at the end of each school year. They designed and produced the outfits they strutted proudly on the makeshift catwalk, looking as elegant and confident as any supermodel. To tumultuous applause. They deserved it.
Although the school was always on the verge of hysteria and violence, it had all the trappings of the typical American high school. There were class trips and talent shows, rings and year books—even caps and gowns and graduation. High school diplomas were among the trappings, handed out to countless 12th graders with, from my observation, a 7th grade education. The elementary schools had a better record. But everyone knew that once the kids hit puberty, it became virtually impossible under the laws in force to teach those who were steeped in ghetto and gangster culture, and those—the majority—who were bullied into succumbing to it.
Students came to school for their social life. The system had to be resisted. It was never made explicit that it was a “white” system that was being rejected, but it was implicit in oft-made remarks. Youngsters would say things like, “You can’t say that word, that be a WHITE word!” It did no good to remind students that some of the finest oratory in America came from black leaders like Martin Luther King and some of the best writing from authors like James Baldwin. I would tell them that there was nothing wrong with speaking one’s own dialect; dialects in whatever language tend to be colorful and expressive, but it was important to learn standard English as well. It opens minds and doors. Every new word learned adds to one’s wealth, and there’s nothing like grammar for organizing one’s thoughts.
It all fell on deaf ears. It was impossible to dispel the students’ delusions. Astonishingly, they believed that they would do just fine and have great futures once they got to college! They didn’t seem to know that they had very little chance of getting into anything but a community college, if that. Sadly, the kids were convinced of one thing: As one girl put it, “I don’t need an 85 average to get into Hunter; I’m black, I can get in with a 75.” They were actually encouraged to be intellectually lazy.
The most Dantesque scene I witnessed at Washington Irving was a “talent show” staged one spring afternoon. The darkened auditorium was packed with excited students, jittery guidance counselors, teachers, and guards. Music blasted from the loudspeakers, ear-splitting noise heightened the frenzy. To my surprise and horror, the only talent on display was merely what comes naturally. Each act was a show of increasingly explicit dry humping. As each group of performers vied with the previous act to be more outrageous, chaos was breaking out in the screaming audience. Some bright person in charge finally turned off the sound, shut down the stage lights, and lit up the auditorium, causing great consternation among the kids, but it quelled the growing mass hysteria. The students came to their senses. The guards (and NYC policemen if memory serves) managed to usher them out to safety.
Once, on two consecutive days, enormous Snapple dispensers on a mezzanine were pushed to the floor below. Vending machines had to be removed for the students’ safety. On another occasion, two chairs were chucked out of the building, injuring a woman below. Bad press and silly excuses ensued. Another time, word spread that a gang of girls was going to beat up a Mexican girl. There was a huge crush of students who preferred to skip the next class to go see the brawl. The hallway was packed, there was pushing and shoving, causing a stampede. I was caught in it and fell to the ground; kids stepped over me elbowing each other in the crush of bodies. Eventually, a student helped me to my feet. Badly shaken, I was taken to the nurse’s office. My blood pressure was dangerously high; I was encouraged to see a doctor, but declined. My husband came and brought me home.
Shortly thereafter, the teachers union (United Federation of Teachers, or UFT) fought the Department of Education, which had recently loosened the already lax disciplinary rulings. They organized a press conference and asked me to speak at it about the worsening security situation. The principal refused me permission to leave even though my supportive assistant principal found a fellow language teacher to take over my classes. As soon as school was out, though, a union rep implored me to rush downtown with him as the press conference was still going on. Questioned by reporters in front of the cameras, I spoke about the stampede. There was a brief segment on the local evening news. The principal was furious, and the next morning screamed at me in the lobby that I was a publicity seeker who just wanted to give the school a bad name. However, the UFT was successful in this case, as the former, less inadequate disciplinary measures were restored, and things went back to their usual level of simmering chaos.
Although it was clear that my generally robust mental state was deteriorating, I did not want to quit. The UFT encouraged me to go into counseling; I didn’t see the point but acquiesced and agreed to see one of their social workers for therapy. Her stance seemed to be, “What is a nice girl like you doing in a place like that?” I started to write about the situation to people in authority. The UFT president Randi Weingarten and the DoE head Joel Klein were among the recipients of my letters detailing the problems we faced. I visited my local city councilman, who listened politely. I did not receive a single response.
Soon thereafter, my beloved husband died after a brief illness. The students knew, so were somewhat subdued when I returned to work. But one afternoon a girl, I forget why, muttered “you fucking bitch.” I finally broke. I screamed at the whole class and insisted that they all get out of the classroom. Furiously. Any physical contact was strictly forbidden between staff and students, so my voice alone did the job. It was also strictly forbidden to send one student out of the classroom, never mind the whole class. The good-hearted teacher next door came to my aid. The administration took pity on me and did not press charges.
In the meantime, the UFT somehow found the “nice girl” a job at Brooklyn Technical High School. There was one going for a French and Italian teacher, as there were not enough classes for another full-time French teacher.
Brooklyn Tech, 2004–2009
Brooklyn Tech was considered one of New York’s “top three” high schools. Students had to test in. My first principal was a big, jolly black man, but he got caught on a minor offense and was sent packing. His misdeed was bringing his daughter to school in New York from their home in New Jersey, which, although against the rules, was hardly unheard of. There was a $20 million restructuring fund in the offing for his replacement. The new principal ended the unruly after-school program that purportedly prepared underprivileged children for the entrance exam. Disruptive behavior subsequently dropped considerably.
The new principal ‘s word was law. Under the last-in-first-out system, my job was never secure. Most students were the children of recently arrived immigrants from Asia, Latin America, and Eastern Europe. A minority were from older Irish and Jewish immigrant families. The many obvious cultural differences were fascinating.
Our assistant principal was an amusing old cynic who loved a hassle-free life. Under him, teaching was a pleasure. It was hard work, as classes were large and students handed in assignments to be graded, but it was rewarding. On Friday afternoons he would announce, “Okay, girls and boys, it’s time to go to the bank,” our signal that we could leave with impunity before the legally stipulated hour. However, some teachers always stayed behind for hours on end to avoid bringing work home.
Despite the disruptive students at first, the classes were manageable. What the youngsters lacked in academic rigor, they made up for in verve. However, as the years passed, micro-management became more burdensome. Supervision became stricter, with multiple class visits and more meetings. Some “experts” up the DoE ladder decided that we had to produce written evidence that our lesson plans conformed to a rigid formula. The new directives did not take into account that foreign-language teaching requires instilling four different skill sets (listening, speaking, reading, and writing) and therefore a different, more flexible methodological approach. Unfortunately, our easy-going assistant principal had his fill of the worsening bureaucratic overload and retired. Instead of an eccentric opera buff with a sense of humor, an obedient apparatchik would enforce the new rules.
In the spring of my 5th year there, he informed me that I had been chosen to replace the Advanced Placement French teacher, as her results were poor. I did the AP training course and prepared for the new challenge that would begin in September. The day before school began, however, he phoned to say that my job was terminated. “There wasn’t enough interest in French” to justify my position, apparently. This was despite vociferous protests from students and parents. I would like to know if, as a member of the UFT’s advisory council, I had asked the principal too many questions. He was so kind as to find me a place at a “boutique” school way down in Brooklyn’s Flatlands.
Victory Collegiate High School, 2009–2010
Victory Collegiate High School seemed promising. It could boast of Bill Gates money, and was one of only two or three new experimental schools co-located in what was once the venerable South Shore High School. It served the local, partly middle-class, partly ghettoized black community. The principal informed me proudly that the students wore uniforms, and no cellphones were allowed. The classes were tiny in comparison to other high schools, and there were no disciplinary problems.
Despite the devastating blow to my career, I set out hopefully on the long commute to Canarsie. The metal detectors should have clued me in. Any pretense of imposing uniforms was eventually abandoned. Cellphones were a constant nuisance. Administrators turned a blind eye to the widespread anti-social behavior.
It would be repetitive to go over the plentiful examples of the abuse teachers suffered at the hands of the students. Suffice it to say, it was Washington Irving all over again, but in miniature. The principal talked a good game, believing that giving “shout-outs” and being a pal to the students were accomplishing great things, but he actually had precious little control over them. What made matters worse, the teaching corps was a young, idealistic group, largely recruited from the non-profit Teach For America, not the leathery veterans who constituted a majority at the two previous schools. I was a weird anomaly to these youngsters. What? I didn’t feel pity for these poor children? I didn’t take it for granted that they would abuse us? The new teachers were fervent believers in the prevailing ideology that the students’ bad behavior was to be expected, and that we should educate them without question according to the hip attitudes reflected in the total absence of good literature or grammar, and a sense of history that emphasized grievance.
One example of the “literature” we were expected to teach was as racist as it was obscene. The main character was an obese, pregnant 14 year-old dropout. The argot in which it was written was probably not all that familiar to many of the students. Appalled, I asked an English teacher why the students had to read this rubbish. She was shocked at the question: we have to teach “literature the kids can relate to.” Why on earth did the school system believe that such a depraved environment as depicted in this book was representative of the very mixed group of families that inhabited the area, many of whom were led by middle-class professionals from the Caribbean? The “language arts” department (the word “English” was too Euro-centric) made one obligatory bow to Shakespeare—a version of “Romeo and Juliet” reduced to a few hundred words. It was common knowledge that the Bard was “overrated.”
My small classes faced a large photograph of Barack Obama displayed proudly in front of the classroom over the title “Notre Président.” The picture resonated as little with the students as the Pledge of Allegiance. Like at Washington Irving, all I managed to do was to get them to stand for it and sing some songs. I did have the rueful satisfaction towards the end of the year, however, of being told after the class trip, “Mary, you won’t believe it! The kids sang French songs all the way to Washington!”
In the classroom, the children did as they pleased. Since the classes were smaller, some students managed to learn a bit of French, but most obdurately ignored me. One memorable 16 year-old fresh from Chicago loved French but was contemptuous of me. She was tall and slender, quite beautiful, and in love, it seemed, with another girl in the class, who was not blessed with similar beauty. Throughout the year they were an item. I finally managed to separate them, insisting that they change seats when it became increasingly difficult to stop them from necking in the classroom. That was when, despite her love of French, the Chicago girl left my class never to return, except once, when we were watching a movie. She came in, sat down and watched with us, breezing out again at the film’s end. This was not unusual behavior. Some students had the run of the hallways, wandering around as they pleased.
As before, students engaged fully in the ancillary aspects of high school life. As before, I tried to encourage them to engage in the learning process. On one memorable occasion, I said to them: “You are not here to play, you are here to develop your intellect.” The puzzled stares this remark elicited spoke volumes. It seemed an utterly new concept to them.
The school had an exceptionally good math teacher, among other excellent ones. In November, students sat for the preliminary Scholastic Aptitude Test that all juniors were required to do in preparation for the real thing in the spring. I had to proctor the first half. As instructed, I walked up and down the aisles keeping an eye on things. It all went smoothly. When the language section was over and the math part began, however, students stopped working. They sat there staring at the desk. I quietly encouraged them to make an effort, but the general response was, “I ain’t doin’ it, miss, it’s too hard.” I could not get them to change their minds; they sat doing nothing for the rest of my shift.
The preliminary test results that came back in the spring were abysmally low—despite the fact that every single response bubble on the math test had been filled in. Either the next proctor forced the kids to randomly fill in the bubbles, or some administrators did so, another example of the rampant deceit the school system indulges.
After the terrible 2010 earthquake in Haiti, a number of Haitians joined the school. These youngsters were remarkable for their good manners and desire to learn, for their outstanding gentility in fact. They provided a most refreshing change, but it didn’t last. They quickly fell into the trap of hostile resistance.
By June, things were really depressing. Not only was the academic year an utter failure, word spread that 10 girls had become pregnant. Since there were only about 90 girls in the school, this represented over 10 percent. The majority of the pregnant girls were freshmen, targeted it was said by a few “baby daddies” who prided themselves on their prowess and evolutionary success. One of them, however, was the beautiful “lesbian” from Chicago. As her jilted partner moped around, cut to the quick, it was impossible not to feel terrible for her.
Once again, I finally and suddenly broke. The threat was from an unlikely source, a big lad who was always subdued. He was in the special education program, and never gave any trouble when I substituted in that class. But one afternoon, for some unknowable reason, this usually gentle giant came up to me and said, “I gonna cut yo’ ass.” That was the final humiliation I would suffer in the New York City public school system.
I left that afternoon never to return. I left much behind: trinkets I’d brought from France, hoping to use them as prizes for the highest achievers; my beautiful edition of Les Fables de Jean de la Fontaine; class records, French magazines, CDs and other educational materials. But I brought away something priceless: an insider’s knowledge of a corrupt system.
One teacher phoned me to say that in her culture “I gonna cut yo’ ass” should not be taken literally, it just meant that he would teach me a lesson. “I don’t care,” I replied. Another called to express her astonishment that I would abandon my students. Why on earth did that matter, I answered, they hadn’t learned anything anyway. The school would hand out passing grades no matter what I did.
* * *
It is not poor teaching or a lack of money that is failing our most vulnerable populations. The real problem is an ethos of rejection that has never been openly admitted by those in authority.
Why should millions of perfectly normal adolescents, not all of them ghettoized, resist being educated? The reason is that they know deep down that due to the color of their skin, less is expected of them. This they deeply resent. How could they not resent being seen as less capable? It makes perfect psychological sense. Being very young, however, they cannot articulate their resentment, or understand the reasons for it, especially since the adults in charge hide the truth. So they take out their rage on the only ones they can: themselves and their teachers.
They also take revenge on a fraudulent system that pretends to educate them. The authorities cover up their own incompetence, and when that fails, blame the parents and teachers, or lack of funding, or “poverty,” “racism,” and so on. The media follow suit. Starting with our lawmakers, the whole country swallows the lie.
Why do precious few adults admit the truth out loud? Because in America the taboo against questioning the current orthodoxy on race is too strong and the price is too high. What is failing our most vulnerable populations is the lack of political will to acknowledge and solve the real problems. The first step is to change the ”anti-discrimination” laws that breed anti-social behavior. Disruptive students must be removed from the classroom, not to punish them but to protect the majority of students who want to learn.
Mary Hudson is a former teacher and the translator of Fable for Another Time and The Indomitable Marie-Antoinette. She has a PhD in French Literature from CUNY Graduate Center, and got her late husband Jack Holland’s last book, A Brief History of Misogyny: The World’s Oldest Prejudice, published posthumously when Viking Penguin abandoned it upon his death. It has recently been reprinted. You can follow her on Twitter @merrycheeked1
The post Public Education’s Dirty Secret appeared first on Quillette.
Foxconn Not Only a Crony Capitalist but an Unreliable One To Boot
Who says that professional sports have nothing to teach businesses? Pro sports team owners have perfected the art of promising the world to local citizens to get taxpayers to pay for their billion dollar stadiums (which in the case of NFL teams are used approximately 30 hours a year). The Miami Marlins in particular have perfected the art of building a good team, leveraging its success to get a new stadium deal, and then immediately dismantling the team and buying cheap replacement players.
In the business world many corporations have taken the Miami Marlins strategy. Tesla took $3/4 of a billion dollars form NY taxpayers to build a factory in Western New York, only to employ a tiny fraction of the promised employees. In fact, one academic studied all the relocation subsidies NY has made in the recent past and found none of the gifted companies fulfilled their employment promises. In Mesa, AZ there is a factory that I call the graveyard of cronyism where not one but two sexy high-profile companies have gotten subsidies to move in (FirstSolar and Apple) only to both bail on their promises after banking the money.
So it should come as zero surprise that the Trump-facilitated crony Foxconn deal in Wisconsin is following the same path.
Foxconn Technology Group, a major supplier to Apple Inc., is backing down on plans to build a liquid-crystal display factory in Wisconsin, a major change to a deal that the state promised billions to secure.
Louis Woo, special assistant to Foxconn Chairman Terry Gou, said high costs in the U.S. would make it difficult for Foxconn to compete with rivals if it manufactured LCD displays in Wisconsin. In the future, around three-quarters of Foxconn’s Wisconsin jobs would be in research, development and design, he said.
They added this:
The company remains committed to its plan to create 13,000 jobs in Wisconsin, the company said in a statement.
Yeah, sure. Anyone want to establish a prop bet on this one? I will take the under.