
Shared posts
09 Oct 19:21

Kids playing in an alley, 1966, Chicago. Photographer unknown.
by lievbengever
Kids playing in an alley, 1966, Chicago. Photographer unknown.
wskent likes this
02 Oct 16:48

Chicago Meter Maid, 1966. Chicago.
by lievbengever
Chicago Meter Maid, 1966. Chicago.
wskent likes this
30 Sep 18:03
Shakespeare with its original pronounciation
by Jason Kottke
wskentGeeky secrets.
Speaking of inexpensive time travel, listen as David and Ben Crystal perform selections from Shakespeare in the original accent, as it would have been heard at the Globe in the early 1600s.
(via @KBAndersen)
Tags: Ben Crystal David Crystal language theater video William Shakespeare
30 Sep 14:16

The Ramsey Lewis Trio stands in the center of Michigan Ave,...
by lievbengever
wskentSo many reasons why this is a good photo.
The Ramsey Lewis Trio stands in the center of Michigan Ave, looking south from the bridge, 1960, Chicago.
The photo would be used for their famous Ramsey Lewis Trio in Chicago album.
06 Sep 18:02


El metro de Pekín cambia viajes en metro por botellas plásticas
by Francisca Codoceo
wskentRecycle and ride the train for free. Smart.
15 botellas plásticas a cambio de un viaje extensible a cualquiera de las 105 estaciones del metro de la capital de China. En otras palabras, gracias a la medida que el metro de Pekín implementó en diciembre del año pasado, los pasajeros ahorran, se fomenta el uso de transporte público, ayuda a cuidar el medioambiente y a reducir el costo de producción del reciclaje. A la fecha, las seis máquinas que se instalaron han recibido más de 30 mil botellas de plástico.
En un principio, éstas estaban instaladas en las estaciones de Jinsong y Shaoyaoju. Otras 40 se instalarán en otras estaciones de la línea 10, y más adelante, el plan seguirá con los paraderos de buses, el aeropuerto, universidades y oficinas. Las botellas son recogidas de manera automática y luego se envían a una planta de reciclaje.
Más información a continuación.
Cheng Huiqiang es uno de los expertos en residuos comerciales de Incom, la empresa que ha desarrollado la iniciativa. Según dijo al medio China.org.cn, se espera que estos recolectores automáticos funcionen como un verdadero incentivo para las personas y que se traduzca, finalmente, en una reducción del costo de recolección de basura en Pekín. Con mil máquinas, se estima que el costo se reducirá un 10%.
Por cada botella, el pasajero recibe una cantidad entre 0,5 y 0,15 dólares. Según los planes de los agentes del metro, este sería solo el primer paso de un proyecto mayor, pues de ser efectivo, podría replicarse en todas las estaciones de metro, paraderos e incluso en otras ciudades. Además, no sólo podría resultar con el reciclaje de botellas plásticas, ya que las máquinas podrían procesar otros tipos de materiales como las latas de aluminio.
Tres millones de toneladas de botellas de plástico son desechadas en China cada año. Según Cheng, esto equivale a decir que si se recoge y se recicla adecuadamente todos estos residuos, el país ahorrará 18 millones de toneladas de petróleo crudo.
Liu Xuesong, diputado gen. gerente de Incom, dijo: “Tenemos la intención de instalar 3, 000 este tipo de máquinas a través de la ciudad. Ellos expanden a otras líneas de metro, escuelas, zonas residenciales, paradas de autobuses y centros comerciales “.
Gentileza de China Daily

30 Jul 17:07
Three Miles of Milwaukee Will Be Open for Car-Free Play This September
by John Greenfield
wskentIf you live here, let's play. If you don't, come visit. This'll be FUN.
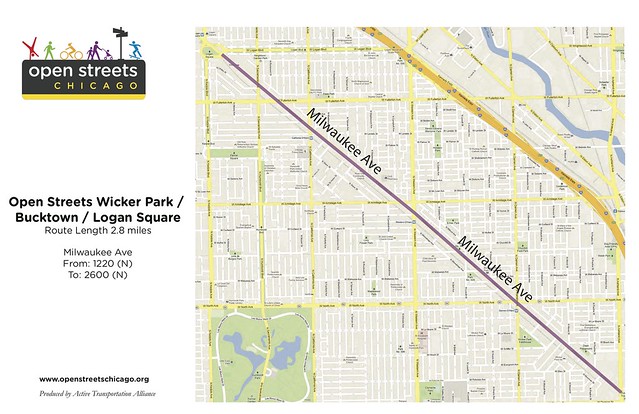
The 2013 Open Streets Wicker Park / Bucktown / Logan Square route.
Although Chicago was one of the first U.S. cities to consider staging a ciclovía, a Latin-American-style event that creates temporary car-free street space in order to encourage healthy recreation, community interaction and commerce, we’re currently way behind peer cities. New York, Los Angeles, Portland, Oregon, and San Francisco are each hosting several ciclovía events this year on routes that are several miles long. Meanwhile Chicago will be hosting one event, called Open Streets, on Sunday, September 15, from 10 a.m. to 3 p.m., on a 2.8-mile stretch of Milwaukee Avenue between Division Street and Kedzie Boulevard in Wicker Park, Bucktown and Logan Square.
The main reason the ciclovía movement hasn’t caught fire in Chicago like it has elsewhere is political will. While those other cities have had mayors who have championed their car-free events and spearhearded planning and funding efforts, Chicago, even under the current pro-sustainable transportation administration, has not. Instead, for years the Active Transportation Alliance has taken responsibility for organizing and raising money for Open Streets, a challenging task.
In 2008 and 2009 Active Trans staged ciclovías along the boulevard system from Little Village to Logan Square. Due to funding problems, the event lay fallow in 2010. In 2011 Open Streets took place as a single event on State Street in the Loop, and last year it expanded to also include a route on Milwaukee from Ashland to Western Avenues. All of these ciclovías were joyful affairs, with thousands of Chicagoans of all stripes coming out to stroll, jog, pedal, play, dance and relax on car-free streets.
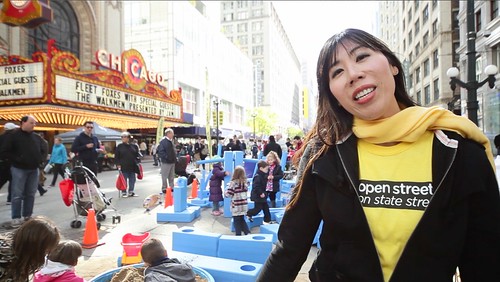
Julia Kim at Open Streets on State in 2011. Photo: Active Trans
This year Active Trans proposed staging Open Streets in several neighborhoods, including routes in the Loop; from Pilsen to Little Village; from Wicker Park to Logan Square; and from Lincoln Park to Lincoln Square. Unfortunately, funding only materialized for the Northwest Side event. However, in a recent conversation about the event, Active Trans’ Open Streets Director Julia Kim argued this year was a breakthrough because Chicago Department of Transportation officials successfully lobbied to waive city fees for traffic management. She promised that this will be Chicago’s most successful ciclovía yet.
John Greenfield: The main issue with Open Streets has been funding and participation from the city. Previously it has been privately funded, with Active Trans raising all the money. You had to pay for the police and traffic aides, for example.
Julia Kim: Yup. Last year it was still privately funded, meaning we raised all the money to bring Open Streets, and we did not get financial support from the city for the street closures.
JG: What kind of support did you get from the city last year?
JK: [CDOT Commissioner] Gabe Klein and [Deputy Commissioner] Scott Kubly championed it and helped us with the logistics. CDOT would like to see it as a citywide event. So it was like, “Let’s make sure that you get the routes that you need.” So it was more of an endorsement.
JG: What’s different this year, with the city’s role?
JK: This year, again, championed by Gabe and Scott, the city is coming through with funding to pay for the street closure, meaning staffing and barricades. So that enables us to actually extend the Milwaukee route all the way to Logan Square.
I’m super-excited about it. The challenges are still there with funding. But it’s great, because with the city coming in to support us with the street closures, along with $40,000 in seed money from Wicker Park Bucktown SSA #33, we’re actually able to do one this year – for a while that wasn’t a sure thing. [An SSA or Special Service Area, is a designated district with an additional property tax which funds enhanced services and special events. Streetsblog’s Steven Vance is a member of the SSA #33 transportation committee.]
So we’d like to see more events, but because of the funding challenges we had this year, we’re doing one. That said, this one is actually double in length – it’s nearly three miles.
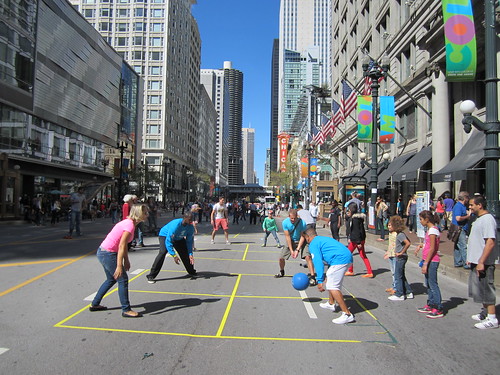
Four square game at Open Streets on State 2011. Photo: John Greenfield
JG: What were the issues with funding this year?
JK: In other cities like Los Angeles and New York, the city takes a leadership role in organizing the event and pays for the street closure. In Chicago, we’re inching our way there. For the first time ever, the city is coming in to support the street closure with dollars, with staffing and city barricades.
That said, that funding didn’t come in until relatively late. So, in terms of finding sponsors, it was almost like we were selling air because you have to have a certain level of certainty, saying “This is the route and these are the days.”
This year with the Chicago Loop Alliance [one of the downtown Chambers of commerce, the main funder of Open Streets on State Street], because of their budget structure and because of a personnel change – they have a new executive director – and their budget cuts from their SSA, they weren’t able to provide the same funding as last year. That put us in a much more challenging position.
JG: So that’s why there’s no Loop event.
JK: Right. The funding that they were able to produce just wasn’t enough. We’re definitely in talks for next year. As you know, in the past Open Streets on State Street was measured as being successful.
JG: What was the attendance for the two events last year?
JK: Roughly 45,000 altogether. About 25,000 downtown, because we added Monroe Street as an extension to the route. Plus it was the second year, so that helped attendance. For Wicker Park, it was an overwhelming success in terms of how many people turned out. And so, working with the police, we roughly estimated that at 20,000 people.
This year, with a longer route, we hope to grow that attendance. Because not only are we getting the Wicker Park / Bucktown corridor, we’re also getting Milwaukee all the way up to Logan Square, which is a nice bike route. We’re in the process of planning programming. We have a few sponsorships that we are close to signing, so I don’t want to talk too much about them, but we’re hoping to get Walgreens back onboard.
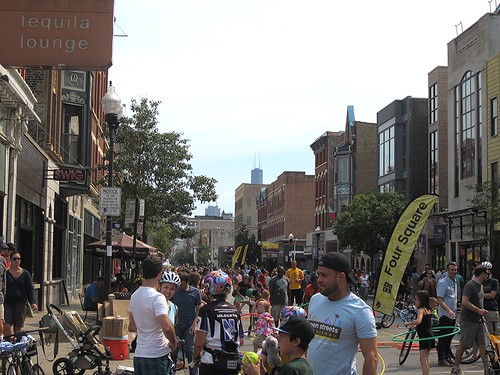
Open Streets Wicker Park / Bucktown in 2012. Photo: John Greenfield
JG: There has been talk for years now about trying to get Open Streets back into low-income neighborhoods. So is that ever going to happen? What’s the strategy?
JK: You know, John, we’d love to see it happen citywide and have multiple routes and do at least three to seven events. I think the dream goal was to see seven happening in different neighborhoods, throughout the year. But it really comes down to funding.
JG: Chicago has been doing many things well in terms of sustainable transportation and public space initiatives lately, so why is the ciclovía the one thing that has not been going smoothly in Chicago?
JK: I think it’s going as well as it can, insofar as the mini steps of getting where we want to go. It really comes down to the mayor’s endorsement and the city making the commitment, saying, hey, we’re going to carve out an investment to roll out Open Streets on a consistent, regular basis.
JG: I guess one way to look at it is the city has been lining up funding for a lot of good projects, and I guess they can’t do everything.
JK: Yeah. And I think it takes time. We’re a step closer this year versus last year.
JG: How so? Arguably it’s a step back, since there’s only one event.
JK: But it’s a step closer because the city’s coming in and actually supporting it. Next year we’d like to see if we can get the commitment from the city and have them say, “OK, we’re going to commit to funding three days of city staffing and street closures, and we can do these dates and routes.” That way when we start making pitches for sponsorship dollars we could say, “These are the Open Streets routes and these are the dates, so here’s what we’re proposing that you fund.”
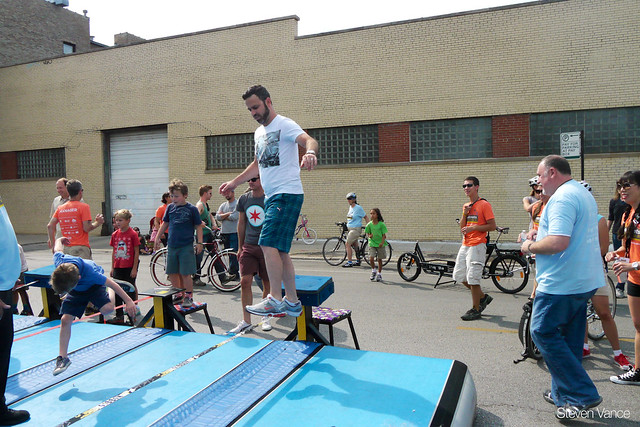
CDOT Commissioner Gabe Klein tries out the slack line at Open Streets in Bucktown. Photo: Steven Vance
JG: Do you know anything about the programming for this year’s event yet?
JK: Yeah, we’re going to bring back what we had last year, which was highly successful. So we’re reaching out to our vendors, including community businesses like CorePower Yoga. So we’ll have yoga, and we’ll have our Imagination Playground with giant building blocks.
What’s different this year than last year is that we’re going to have a hub concept, meaning the programming will be on the side streets, adjacent to the major drag, to make it easier to bike. We anticipate a lot of people on bikes, so this way Milwaukee will be wide open.
JG: Boy, I bet the pedicabbers are going to be all over this.
JK: Yeah, and we want to invite them to show up. [Logan Square’s] Revolution Brewing is onboard. [Owner Josh Deth] has always had a great interaction with the community. They’re going to have a beer garden, but we’ll work with them to make sure there’s a good balance, so that it will be a safe and fun addition.
One thing we learned from last year is that local businesses want to do more to promote themselves, because they do have the opportunity of leveraging all that additional foot traffic. So we’ve secured a sidewalk permit from the city so that merchants along the route will free to promote their businesses on the sidewalk.
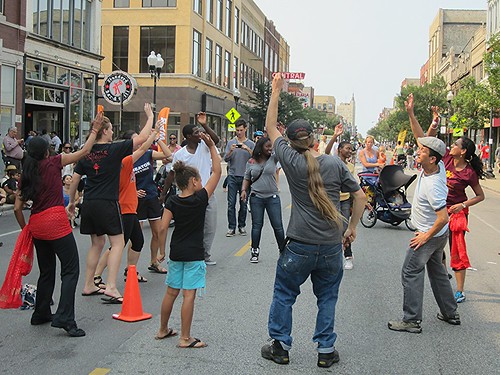
Bollywood dancing at Open Streets in Wicker Park. Photo: John Greenfield
JG: What will some of the other programming be this year? Are you going to have Bollywood dancing again?
JK: Absolutely. Everyone who was in last year, we’re inviting them all back. Playworks [a nonprofit that promotes physical activity in the schools] will be back with four square and other games. People love them.
JG: Will there be a slack line demo?
JK: REI is not in this year as a sponsor, so there will be no slack line or climbing wall. The skate park is a maybe, depending on what we work out with Uprise skate shop and sponsors. Last year that was sponsored by the Illinois Center for Broadcasting in the Loop and Wicker Park Bucktown for the Milwaukee Avenue corridor, but they’re not coming in with the dollars this year. Either way, the skate culture will definitely still be there, because the skaters would not want to miss out on this opportunity.
The route itself is just a perfect combination of mixed uses: residences, independent retailers, and even some big-box stores. You also have Damen Avenue, which is a huge retail Mecca, and there are also a lot of businesses along North Avenue. We’ll also be reaching out the Humboldt Park neighborhood. We’d love the Humboldt Park community to come out – it’s not that far.
You know there are two Divvy bike-share stations on this stretch of Milwaukee. We want to do something fun like a Divvy “slow race.” I think Scott Kubly wanted to do a Divvy skivvy race. I told him, you go first.

30 Jul 16:10

Jake and Elwood Blues (John Belushi and Dan Akroyd) stand in...
by lievbengever
wskentEverything about this is amazing.
Jake and Elwood Blues (John Belushi and Dan Akroyd) stand in front of the Soul Food Cafe, 807 W Maxwell Street, which actually was Nate’s Deli, renamed for the movie. 1980, Chicago
30 Jul 16:09


1588 : Captain Agostino Ramelli’s Book Wheel and more “Diverse and Artifactitious Machines”
by Amanda Uren
wskentSCIENCE!!
30 Jul 15:29


26 Sencillas maneras de hacer grandes lugares
by Natalia Barrientos Barría
wskent“Somos más grandes que nuestros horarios.”
Barrio Lastarria, uno de los sectores más valorados de Stgo. Foto vía Flickr, por Christian Varas (kbcitas)
Desde hace un tiempo que venimos publicando artículos que nos señalan una serie de herramientas o consejos sobre cómo construir mejores lugares. Es por esto que no quisimos dejar pasar algunos de éstos, publicados en el reciente libro, “How to Design our World for Happiness” (Algo así como, “Cómo diseñar nuestro mundo para la felicidad”), editado por Jay Walljasper y un equipo de On the Commons.
A continuación una lista de consejos (muy básicos, pero aún así no siempre cumplidos) publicados en el libro anteriormente mencionado. Pueden descargar el libro completo aquí.
1) Impugnar el mito dominante que todos los problemas tienen soluciones individuales, aisladas o privatizando.
2) Observe cómo muchos de los placeres de la vida existe fuera del mercado, pescar, conversar, escuchar música, jugar a la pelota, disfrutar de la naturaleza y más.
3) Tómese el tiempo para disfrutar de lo que su esquina ofrece del mundo (como el educador brasileño Paulo Freire, una vez declaró: “Somos más grandes que nuestros horarios.”)
4) Pasar un buen rato. La mejor razón para hacer grandes lugares es que va a alegrar la vida de todos.
5) Ofrecer una sonrisa o un saludo a la gente que pase. La comunidad comienza con la conexión, incluso en formas breves y espontáneos.
6) Trata de trasladarte a pie, en bicicleta o tomando el transporte público siempre que puedas. Es bueno para el medio ambiente y también para ti. Usted hace muy pocos amigos al volante de su coche.
7) Trate a los espacios comunes como fueran su responsabilidad (que, de hecho, lo es) . Recoja la basura. Mantenga un ojo en el lugar. Ponga en orden las cosas. Reporte los problemas o intente reparar las cosas por si mismo. Inicie mejoras.
8 ) Haga una cena. Una fiesta del barrio. Forme un coro comunitario, club de slow food, viernes por la noche juego de póquer, festival estacional, o cualquier otra excusa para socializar.
9) Salga de la casa y pase algún tiempo en la terraza, en el patio, en la calle o en cualquier lugar que pueda ser una parte que el río de su vida fluya más allá.
10) Cree o designe una “plaza del pueblo” de su vecindario donde la gente, naturalmente, quieren reunirse en el parque, en la zona de juegos, en el terreno baldío planee un centro comunitario, una cafetería e incluso potencie una esquina.
11) Vestíbulo para los bancos más públicos, fuentes de agua, plazas, parques, aceras, senderos para bicicletas, parques infantiles, y otras infraestructuras comunes crucial.
12) Tome el asunto en sus propias manos y añada un banco para su jardín o transformar un terreno baldío en un patio de recreo.
13) Realice un inventario de los bienes comunes locales. Dé a conocer sus resultados y ofrezca sugerencias para la celebración y la mejora de estos bienes de la comunidad.
14) Organice a sus vecinos para prevenir la delincuencia y para calmar el miedo al crimen, que a menudo desalienta los espíritus de una comunidad incluso más que el crimen mismo.
15) Recuerde que las calles son de todos, no sólo de los automóviles. Conduzca con cuidado y sin presionar para calmar el tráfico y traté de realizar otras mejoras que recuerdan a los automovilistas que no son reyes de la carretera.
16) Compre en negocios independientes locales siempre que sea posible.
17) Forme un cambio de barrio para compartir todo, desde cortadoras de césped a la guardería a los vehículos.
18) El trueque. Negocie su habilidad para hornear pasteles con una persona que va a arreglar su ordenador.
19) Ingrese campañas opuestas con recortes en bienes públicos como transporte, escuelas, bibliotecas, parques, servicios sociales, policía y protección contra incendios, programas de arte y más.
20) Escriba cartas al editor acerca de la importancia de los bienes comunes de la comunidad, publicar en los sitios web locales, poner en programas de radio, difúndalos entre sus amigos.
21) Aprenda de todo el mundo. ¿Qué puede enseñarnos Copenhague sobre las bicicletas? India sobre el bienestar? África sobre la solidaridad de la comunidad? Pueblos indígenas sobre las tierras comunales en sí? ¿Qué ideas brillantes pueden ser tomados de un barrio o un pueblo cercano?
22) Conviértete en un jardinero de la guerrilla, la plantación de flores y hortalizas en terrenos abandonados en su vecindario.
23) Organice un jardín comunitario o mercado agrícola local.
24) Arremángate para fortalecer un arroyo, humedal, bosques o praderas.
25) Forma un grupo de estudio para explorar lo que se puede hacer para mejorar su comunidad.
26) Piensa en ti mismo como un patriota local y comparten su entusiasmo.
¿Se te ocurren otras a ti? Compártelas comentando este post ¡Te esperamos!
21 Jul 20:50

Zootsuits, 1946, Chicago. Gordon Coster
by lievbengever
wskentClass acts.
Zootsuits, 1946, Chicago. Gordon Coster
18 Jul 20:23
City Evolution: Watch Urban Growth in 3D Visualizations
by Steph
wskentlike plants!
[ By Steph in Architecture & Cities & Urbanism. ] Next Page:


[ By Steph in Architecture & Cities & Urbanism. ]
[ WebUrbanist | Archives | Galleries | Privacy | TOS ]


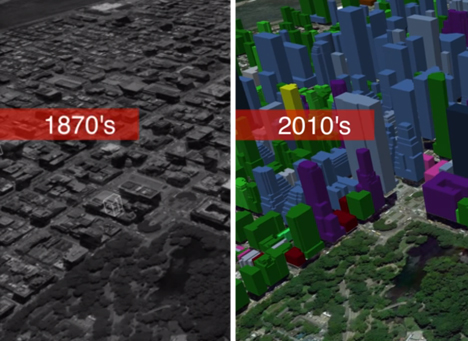
Watch Manhattan multiply and San Francisco soar into the sky in a series of growth animation videos that show the expansion of cities over more than a century. Created by Calgary-based real estate company Cube Cities, the videos utilize developer-reported data of building construction dates to show buildings pop upon top of city maps.
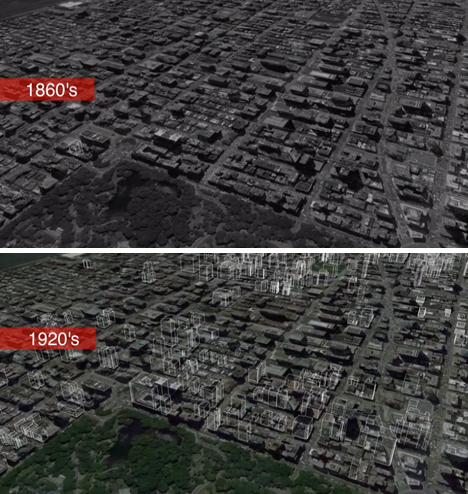
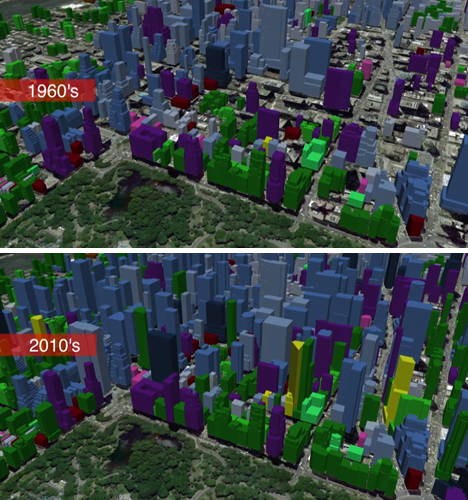
3D mapping technology from Google Earth provides the base of the videos, and animations show construction as it occurs through each decade. The videos highlight the busiest decades for growth, which is most visible in New York City during the 1920s, San Francisco during the ’60s and Toronto during the ’70s.
Next Page:
City Evolution Watch Urban Growth In 3d Visualizations
[ By Steph in Architecture & Cities & Urbanism. ]
[ WebUrbanist | Archives | Galleries | Privacy | TOS ]
    
|
maddox609 and -1 others like this

18 Jul 19:56


Check out Afrika Bambaataa's record collection!
by David Pescovitz
wskentLooks like I need to go to Cornell.

Afrika Bambaataa donated his vinyl to Cornell University Library's Hip Hop Collection. (Professor Bambaataa is a Visiting Scholar there.) But before the wax goes on its way, you can watch it being sorted, organized, and, yes, spun, at Gavin Brown's enterprise gallery in NYC's West Village. There are "Lunch Breaks" shows this week with Crazy Legs, Joe Conzo, Grandwizzard Theodore, and Break Beat Lou, and the collection will remain on view until August 10. Unfortunately, no digging!
"Spend Your Lunch Break with Afrika Bambaataa's Legendary Record Collection" (Paper)
More details on the exhibition at Gavin Brown's enterprise.![]()
|
|
18 Jul 19:05

New City Creamery, 41-47 S Halsted, 1910, Chicago
by lievbengever
New City Creamery, 41-47 S Halsted, 1910, Chicago

15 Jul 16:24
Are viral cat videos actually viral?
by Jason Kottke
wskentThis is great.
Or rather, protozoan? Toxoplasma gondii is a protozoan parasite which is transmitted from rodents to cats through a crafty mechanism...it makes mice attracted to the smell of cat urine. Mouse goes near cat, cat eats mouse, T. gondii has a new host. From cats, the parasite can jump into humans, where it may be responsible for all sorts of nastiness:
Well, the behavioral influence plays out in a number of strange ways. Toxoplasma infection in humans has been associated with everything from slowed reaction times to a fondness toward cat urine -- to more extreme behaviors such as depression and even schizophrenia. And here's the kicker: Two different research groups have independently shown that Toxo-infected individuals are three to four times as likely of being killed in car accidents due to reckless driving.
And maybe makes us want to invent networking technology and share cool links? In this five-minute talk, Kevin Slavin cleverly connects viral media with T. gondii:
That video was so good, I watched the whole thing twice.
Tags: brain Kevin Slavin medicine neuroscience science video
Aaron.winn and -1 others like this
10 Jul 17:41

In Copenhagen, Motoring on Cyclists’ Terms
by Brad Aaron
wskentSwoon.
Today on the Network, Copenhagenize takes a look at a proposal that shakes up the traditional “complete street” concept.
Image via Copenhagenize
As presented in a municipal “idea catalogue,” the plan is to redesign Copenhagen’s Vestergade as a “bicycle street,” where cyclists and pedestrians come first, and motor vehicle traffic is the second-tier mode.
The entire road will be turned into a bi-directional cycle path, with pedestrian paths on either end and flex parking for deliveries and bicycle parking. The street will remain a one direction street for cars, but their speed limit will be reduced to that of a bicycle’s. Something that means bicycles are given the home team advantage. The document reads: “motoring allowed on bicycles’ terms.” Other road sections would be blocked for car traffic altogether, which is a wonderful improvement in roads that already are heavily bike dominated.
“In the world of urban cycling,” writes Kristen Maddox, “there are contra-lanes … and then there are contra-lanes.” Indeed.
Elsewhere today: The Missouri Bicycle and Pedestrian Federation marks the one-year anniversary of Kansas City bike-share. N8than questions how it could be that striking 13 cyclists at one time, as a motorist did in Arkansas this week, is not necessarily considered a crime. And Quickrelease.TV says the UK Department for Transport is hopelessly auto-centric.
10 Jul 16:25


3D printing for all: Inside Chicago library’s new “pop-up maker lab”
by Jacqui Cheng
wskentGo Chicago Go! And make stuff! Lotsa STUFF!
CHICAGO, IL — If you've ever had a hankering to try out a 3D printer, a laser cutter, or a milling machine without dropping thousands of your own hard-earned dollars, the Harold Washington Library in Chicago is the place to be. Starting today, July 8, Harold Washington has become the first major urban library to open a pop-up "maker lab," allowing members of the general public the opportunity to experiment with the cutting-edge technologies. And while there are still a few wrinkles to iron out before the public can use all the machines, the Chicago Public Library (CPL) system is already looking forward to where this project will go next.
"There's more buzz about this on social media than anything we've ever done," CPL's First Deputy Commissioner Andrea Sáenz told Ars.
What exactly is the pop-up maker lab? CPL partnered up with Chicago's Museum of Science and Industry—which is offering its own maker lab to museum visitors—in order to put together the program. Unlike the museum's lab, however, the maker space at Harold Washington is completely free and open to the public. Chicago residents will be prompted to use a library card to gain access, but Sáenz told Ars that out-of-town visitors won't be turned away if they don't have a card of their own.
Read 10 remaining paragraphs | Comments
|
|
Marek likes this
08 Jul 16:29
The real reason Google wants to kill RSS
by Rob Beschizza
wskentLove you Old Reader and Old Reader friends.
Marco Arment:


RSS represents the antithesis of this new world: it’s completely open, decentralized, and owned by nobody, just like the web itself. It allows anyone, large or small, to build something new and disrupt anyone else they’d like because nobody has to fly six salespeople out first to work out a partnership with anyone else’s salespeople.
That world formed the web’s foundations — without that world to build on, Google, Facebook, and Twitter couldn’t exist. But they’ve now grown so large that everything from that web-native world is now a threat to them, and they want to shut it down. “Sunset” it. “Clean it up.” “Retire” it. Get it out of the way so they can get even bigger and build even bigger proprietary barriers to anyone trying to claim their territory.
Well, fuck them, and fuck that.
Lockdown [marco.org]![]()
|
|
03 Jul 14:53
Amazon reviews of Wendy Davis's running shoes
by Cory Doctorow
wskentOh, internet! Love what you do sometimes.
Texas Sen. Wendy Davis did something amazing when she filibustered for 13 hours solid to kill the state's omnibus abortion bill: standing, without help, food, water, or bathroom breaks, for 13 straight hours. In a pair of Mizuno Women's Wave Rider 16 Running Shoes. Fans of Ms Davis have taken to Amazon to show their support in the reviews, a strange form of public commentary with some precedent: "Guaranteed to outrun patriarchy on race day," and "I tried on a pair at the local mall and suddenly Texas Republicans started telling me what to do with my genitals." 


|
|
03 Jul 14:41


“Cycleway California”: Una autopista para bicicletas construida en 1897 en Los Ángeles, EE.UU.
by Constanza Martínez Gaete
wskentCool. Andámamos!

Hace un tiempo les contamos que en 2012 se inauguró en Copenhague la primera autopista para bicicletas y que en Lund, Suecia, se proyecta una infraestructura similar con 30 kilómetros de extensión. Aunque estas estructuras son un real avance para los desplazamientos en ambas ciudades y demuestran cómo se ha desarollado una cultura de movilidad urbana en torno a la bicicleta, estas autopistas no son las primeras en su tipo.
De hecho, en 1897 se inició la construcción de “Cycleway California”, una autopista elevada para bicicletas que uniría Pasadena y el centro de Los Ángeles, en Estados Unidos. En ese tiempo, esta última ciudad tenía aproximadamente 30.000 ciclistas de 500.000 habitantes, es decir, un 6% de toda la población se desplazaba en bicicleta. Esta cifra, alentadora para la fecha, motivó al empresario estadounidense Horace Dobbins a financiar la autopista.
¿Qué pasó con esta autopista?
Una breve historia, después del salto.

Para que la carretera para bicicletas fuera aprobada, Dobbins se ganó el apoyo de un ex gobernador de California y de otras autoridades. La infraestructura tenía un primer tramo de veinte kilómetros en una estructura elevada a través de Pasadena. Como su uso tenía un costo, los ciclistas debían pagar una cantidad para subir a la estructura y otra para recorrerla que no superaba los 100 pesos chilenos actuales.

La historia de esta autopista, que pareciera ser una de las precursoras en este tipo de obras de ingeniería, fue parte de un artículo publicado en 1901 en la revista Good Roads Magazine, en donde su autor destaca que esta estructura estaba destinada a ser una parte integral del tránsito del futuro en Los Ángeles. En relación a esto escribió:
“¡Qué bendición es el nuevo ciclo para estas hermosas ciudades de California! Se cree que en cinco años la actividad industrial se acelerara, por lo que el país disfrutará de una prosperidad, que nunca ha conocido. Está cerca el día en que los ciclistas podrán comprar aire comprimido a un bajo costo para propulsar sus bicicletas a la máxima velocidad en los 20 kilómetros de extensión (de la autopista)…”
Lamentablemente, esta prosperidad para las bicicletas no duró mucho, porque pocos años después comenzó la masificación del autos. Esto generó que la construcción de la autopista se iniciara, pero que a los pocos años fuera abandonada, dando paso a la actual autopista para vehículos Arroyo Seco Parkway que une Los Ángeles con Pasadena.
Horace Dobbins en el tramo que se alcanzó a construir de "Cycleway California".
No obstante, y como ya sabemos, en los últimos años los desplazamientos en bicicleta han visto un considerable resurgimiento. Los programas de préstamos de bicicletas están creciendo con popularidad y de a poco se ha construido una cultura en torno a la bicicleta urbana.
Actualmente, en Estados Unidos, existen pocos lugares en donde la infraestructura está enfocada en los ciclistas, destacando las ciclovías de Nueva York y Portland. Por esto, “Cycleway California” sigue siendo una de las primeras hazañas en el ciclismo urbano de las ciudades estadounidenses al intentar dar paso a los ciclistas en Los Ángeles. De hecho, retomando el artículo de arriba, el periodista fue más lejos y llamó a la autopista para bicicletas como ”una de las instituciones más destacadas en el sur de California”
En Europa, ciudades como Copenhague y Lund están adoptando caminos de alta calidad para bicicletas y el porcentaje de los ciclistas se ha incrementado año a año, puesto que una buena infraestructura para bicicletas ha demostrado que elimina la congestión del aire y vial de las ciudades, mejora su desarrollo y, sin duda, ayuda en la felicidad de sus habitantes.
Vía Motherboard.
03 Jul 14:36


Anton LaVey plays his keyboard
by David Pescovitz
wskentJuly not bizarre enough for ya? HOW BOUT NOW!?
In this terrific video, Church of Satan founder Anton LaVey talks about how his interests in the arcane, magic, and showmanship were inspired by the mentalists at old time carnival midways. He also recalls his experiences as a professional calliope player in the 1940s-1960s and plays a few delightful tunes. (Thanks, Jenny Hart!)
UPDATE: BB pal COOP says, "This footage is from a documentary by Nick Bougas. These keyboards were set up in the kitchen of the Black House. I spent many nights in that kitchen listening to Dr. LaVey play. He had an encyclopedic knowledge of popular music, and could play almost any song that came up in discussion."![]()
|
|
27 Jun 15:52

Complete Strangers Meet Up for Family Portraits
by Jessica Czeck
wskentI find this very entertaining. MAYBE YOU DO TOO?

You know those cheesy group family shots that your parents pull out anytime you introduce them to a new friend? You were probably wearing acid washed Osh Kosh B’Gosh overalls with a few teeth missing- right after that time you got a hold of scissors and cut your own hair, standing behind your mom, hands neatly folded on her shoulder pad. What if rather than uncomfortably posing with the people you’re closest to, your arms rested on the shoulders of a complete stranger? Creating that surreal experience is exactly what NYC based photographer Jamie Diamond did for a series called Constructed Family Portraits. Seeking out strangers in public and via Craigslist, the artist met people in hotel rooms to awkwardly compose the “picture perfect” holiday card that nobody would ever have.
See Also MODIFYING SOCIAL BEHAVIOR WITH WILD BENCHES
According to Diamond’s artist statement:
I am interested in the shifting paradigm of the traditional family structure and in the paradox of the familiar. The portraits are of actual people being themselves in an entirely new context; they intuitively follow the rules of the genre and the group they form for the camera ascribes them an identity. I am constantly questioning the past and present narrative, the still and moving image, and the space between authentic experience and artifice.
As much of a sociology project as a photography experience, Diamond’s results are as awkward as they are hilarious. Check out more photos from this and other series at JamieGDiamond.com.


Via: athenna.com
25 Jun 18:38
What's Curious about Curious City?
by schardt
wskentNEWS!
 Hmmm. What's going on in Chicago? Jennifer Brandel's new concept for topsy-turvying standard news agenda setting in a major public media newsroom is about to spread.
Read Knight's announcement http://kng.ht/14620ac *snip* the project offers an experimental Internet-based model for community-powered content creation online and on-air and empowers the public to suggest, vote on and participate in stories as they are reported *snip*
Brandel is one of the dozen lead producers AIR hired and dispatched to help build new innovation capacity at local public radio and television stations across the US, and carry public media into new corners of the local community. This spring, after a year of R&D, the projects are blossoming and we're seeing a new cohort of producer-entrepreneurs emerge from an exciting field of production (http://www.Localore.net). With the support of Knight, Curious City is, indeed, out front of its sister projects, moving to prototype the model. Others are expected to follow. About 50 public media news directors showed up recently at a webinar to satisfy ... well... their curiosity. You can go deeper into Brandel's thinking by checking it out at http://www.prndi.org/post/finding-funding-webinar-archive And, to get a better look at the ground level experience of our ten production teams, watch our 30-minute documentary @ http://bit.ly/ThisIsLocalore

21 Jun 14:53


c. 1970s : Johnny Cash eating a cake
by Chris Wild
wskentScoundrel!
Josh Sisk likes this