Shared posts

21 Sep 19:53

At the Wheel With Delhi's Lone Woman Bus Driver

by Sunaina Kumar
On The Job is a series of conversations with the people who keep neighborhoods running.

On an oppressively hot August afternoon, a crowd waits to board their bus at the Andrews Ganj stop in Delhi, located on one of the busiest intersections of the capital.

As the cherry-colored bus number 543 pulls up, riders hurriedly squeeze down the aisle. But a few notice the driver and do a double take. Vankadarath Saritha is used to this. She’s invariably polite with the passengers who chat with her, struck by curiosity. “Is it tough to do what you do?” they often ask.

The 31-year-old is the lone woman bus driver in Delhi. She was recruited last year by the Delhi Transport Corporation, the state-owned public transport operator. Delhi is known for its fearsome and treacherous streets. The harassment of women is a pernicious malady in the fourth most dangerous city in the world for women on public transport (behind Bogota, Mexico City, and Lima, according to a Thompson Reuters Foundation survey). In 2012, a young woman was brutally gang raped in a privately operated bus. The incident led to nationwide protests and became an inflection point on the topic of women’s safety in India. One proposal to make Delhi safer and more equitable involved having more women work in public transit.

A few incremental changes have been made. Now, it’s possible to hire a cab in Delhi driven by a woman. It is also possible to board a bus and find a woman as bus conductor. DTC has 245 women conductors and runs women-only “Ladies Special” services on 26 routes. The Delhi Metro, the city’s rail service, has women drivers and station controllers. “We’ve found if there are more women in public transport, the system slowly starts to respond and adapt,” says Shrinivas Rao of Azad Foundation, an NGO that runs a female-only cab service in the city.

But cultural shifts take time. Driving a bus on Delhi’s mean streets is seen as a man’s job—DTC employs more than 11,000 male drivers for its fleet of nearly 5,000 buses. When it put out advertisements for the women recruitment drive, seven came forward. Saritha was the only one to qualify.

For more than a year now, she’s been driving a bus that covers a route of more than 75 miles a day. She starts her day at 6 a.m. and winds up by the afternoon. Her record has been so stellar (she’s noted for her punctuality, good behavior, and accident-free record in this accident-prone city) that it has inspired the authorities to renew the campaign.

But many doubt that more women will turn out this year. “I doubt many women will come for the job this year as well,” says Amit Kumar, the conductor on Bus 543. “How many women can handle this? Look at the traffic and how abusive the public is in Delhi. I admire her for what she does.”

Gajanand Raj, the driver who takes over the bus after her shift, echoes the sentiment. “Women run away in fear from this job,” he says with a slight smirk. It is enough to get Saritha roiled. “Come here,” she says to him authoritatively. “What do you mean by that? Most of the women were disqualified last year because they could not meet the height criterion. They weren’t scared and they didn’t run away,” she says. Saritha underplays her job constantly, despite receiving a huge amount of media attention since she started. “Everything is tough until you don’t do it. Why is this not a woman’s job? I say it is. We are equal to anything,” she says.  

She comes from Telengana, a state in the south of India reeling under an agrarian crisis. The youngest of five sisters, she shouldered the economic burden of the family when her father fell ill. She started by breaking stereotypes at a young age, driving an auto rickshaw in her village as a 16-year-old before moving to the city of Hyderabad. She eventually made her way to Delhi, where she drove a taxi for a few years. Saritha has mastered the art of navigating Dehli. She speaks the lingo and can maneuver her way through its tricky dealings.

One of the rules of survival she’s learned on the job is to blend in. She was constantly harassed by male passengers as a teenage rickshaw driver. So she cut her hair short, removed the traditional nose ring worn by women in her community, and started dressing in pants and shirts.

“When I was really young, my father liked to dress me as a boy, as he had really wished for a son. Now, I am in a job where I have to always look like that. People sometimes call me bhaiya (Hindi term for elder brother),” she says, smiling, as we sit in a public park outside the bus depot. When we finish our conversation, she straps on her helmet and rides away on her bike. At home, she has a pile of washing to do. She’ll then make her daily phone call to family back home, cook a meal for herself, watch television, and go to bed early before starting all over again the next morning. It’s an unvarying schedule, but she’s content with it.  

The following day, Urmila Pant—a retired teacher visiting relatives—is the last passenger on Bus 543. It’s her first time on board. She notices Saritha and says approvingly, “She drives with such confidence!” When Pant gets off at her stop, she says to an elderly man nearby, “Look, a woman is driving that bus!” He cocks his eyebrows and asks, “Really?” with a wide smile.
19 Sep 21:35

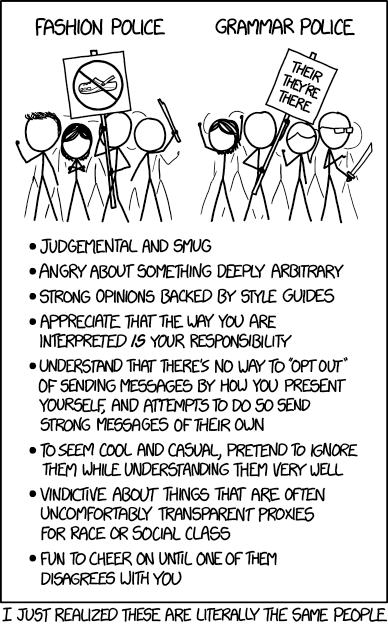
Fashion Police and Grammar Police

* Mad about jorts
15 Sep 05:41

New science is driving the country with the world’s best math students to rethink high-stakes tests

by Jenny Anderson
It's all about the effort, really.

In 2015, the Organisation for Economic Co-operation and Development (OECD) gave 15-year-old students in every country the same math and science test. Singapore’s teens places first. The country is so good at teaching math that its methods are now being adopted everywhere from Canada and the US to Israel and the UK.

But a video recently released by the country’s Ministry of Education hardly extols the virtues of their coveted first place rank. In fact, the three-minute video—based on a true story—about a young girl struggling with science, and her teacher’s efforts to help her, will probably make you cry.

The message? All that matters is trying your best.

The video, and changes such as how primary school kids are graded on a key exam, shows the country is trying to move beyond just mastery of high-stakes tests, to also focusing on student well-being.

“There’s a great recognition at the policy level that…we need to do better on these more important skill sets without compromising the foundations,” says Manu Kapur, a professor of psychological studies at the Education University of Hong Kong, and former head of curriculum, teaching, and learning at the National Institute of Education of Singapore.

Kapur says change is being driven, partly, by emerging evidence about the shortcomings of tests, namely that they are stressful while not always producing deep learning. Witness Shirley, age 15, in the video, whose pain at failing the test not once, but twice, is palpable. No doubt Shirley is thinking of her parents when her score goes from a 10% to a 40% and she looks despairing.

But her teacher marks her second paper with a “Well done!” in spite of the failing grade. When Shirley asks why, the teacher explains it is not just about the mark, but about trying your hardest, and making progress.

Kapur’s research, and others’, show tests measure kids ability to apply what they know, but not to generate new ideas. They measure performance in a vacuum, meaning kids are not allowed to draw on critical real-life resources like computers and the internet, and feedback from peers and other people. Also, the questions do not require persistence; they basically measure a kid’s ability to provide rapid-fire responses. In other words, these tests do not encourage the skills needed to succeed in the 21st century, like creativity, inventiveness, communication, and collaboration.

But adapting these findings into policy have been slow. Kapur says there is a belief in Singapore that small evolutions, not revolutions, are the right approach. The country recently changed how it grades its primary school leaving exam, moving from a points- based system to a “band system” which groups students into different levels of achievement. The goal is to discourage parents and students from working too hard to edge up their scores by a few ticks (the exam results partially determine which school the child continues onto).

“These are tiny steps, but they are taking them,” he says.

The biggest challenge will be overcoming the ethos of achievement is so embedded in the culture of a country. Notably, parents continue to drive children hard and teachers, regardless of what they think about the impact of high-stakes tests, have to prepare kids for them. It’s what they’ve been doing for years.

“This is just an ad,” wrote one respondent to the video after it was posted on Facebook. “In reality, based on my own experiences, teachers like to put down students more than encourage them,” the person wrote, according to the BBC.

“Try convincing the parents,” wrote another.

Kapur and other Singaporean policymakers recognize these challenges. “There is nothing wrong with parents trying to do the best for their children,” Kapur says. “It’s what they value as being good. That has to change.”

That’s a lesson which policymakers, educators, and parents especially all over the world could learn.

14 Sep 20:05

Making the best out of a boring task

by sharhalakis

by @uaiHebert

14 Sep 19:36

Women at the White House have started using a simple, clever trick to get heard

by Cassie Werber
Obama briefed at the White House

The challenges of a job at the White House are tough and manifold, but at least one of them—the challenge of getting heard—has historically been tougher for women.

For one thing, there are fewer of them at the table: all presidents so far have been men, and among their top aides man have to date heavily outnumbered women. But another factor that weighs on how much women’s ideas get heard and credited isn’t confined to politics. Across sectors, and both in and outside work, women get interrupted more often than men—by people of both genders.

The interruption disparity, backed up by decades of research, is now so recognized there’s a word for it: manterrupting.

But at the White House, one former staffer explained to the Washington Post, women started using a simple rhetorical technique to stop interruptions and reinforce points made by other women. When a woman made a good point, another woman would repeat it, and give credit to the originator. This made the idea harder to ignore, or to steal. The women called the technique “amplification.”

“We just started doing it, and made a purpose of doing it,” one of president Barack Obama’s former aides told the Post. “It was an everyday thing.” She said that Obama noticed and began calling on women more often.

The women, perhaps unconsciously, had noticed two things. First, that repetition is one of the simplest ways of reinforcing any point—which can be seen through history across oratory and poetry. But secondly, that simply hammering a point home by repeating it oneself has limitations, especially in a competitive environment where everyone is clamoring to be heard. Some researchers have hypothesized that women are interrupted more because their conversational style tends to be collaborative, where men tend to be more competitive.

The trick may have come about organically, but it’s by no means a given than women should support each others’ ideas that way. The presence of only a few women in a room historically gave rise to a different response, noted Facebook COO Sheryl Sandberg in her book Lean In:

In the days of tokenism, women looked around the room and instead of bonding against an unfair system, they often viewed one another as competition…women wound up being ignored, undermined, and in some cases even sabotaged by other women.

It’s a safe bet that many Obama staffers, and those who come after them, will have read books like Lean In and taken the lessons away. The ideas of cooperation they promote are already making their way into the wider workplace.

14 Sep 19:29

Most American adults don’t really need a primary-care doctor

by Jay Parkinson
For many American adults, having a primary-care doctor just isn't realistic.

Americans know that we’re supposed to have a primary-care doctor. It’s a task as associated with adult responsibility as paying the car insurance and flossing regularly. And yet, when confronted with a form asking us for the name of our primary-care physician at the dentist or the optometrist, many of us leave the space blank.

That may be for the best. Once, maintaining a relationship with a primary-care doctor made sense. But given the nature of our current health-care system as well as changes in the American lifestyle, today, it’s unrealistic for many adults to have one.

First of all, the commonly held belief that we all need a yearly physical is false. An annual physical is not currently recommended for the healthy adults by the governing health bodies in the US, Canada, or the UK.

That’s good news, because the US has a significant supply and demand problem when it comes to general practitioners. America’s physician workforce is composed of roughly 33% primary-care doctors and 67% specialists. Other high-performing health care systems, like Canada or Australia, have more balanced ratios.

In countries where the vast majority of doctors are generalists, it makes sense to expect everyone to have a PCP. They are plentiful, accessible, and effective. But there are good reasons why so many young doctors choose to specialize here in America. Specialists are more respected by the public and in the medical community. And the lifestyle of a specialist is far better, involving less punishing hours while making millions of dollars more over their careers. And so, with a dearth of general physicians, we wind up with situations like Boston’s 45-day wait to see a PCP.

 Gone are the days of independent doctors who felt personally responsible for their patients’ well-being at all hours of the day.  Not only is the supply of primary-care doctors diminishing, the nature of their job is changing. Local hospitals are increasingly acquiring private primary-care practices in order to generate lucrative specialist visits, via PCP referrals, within their walls. When PCPs are no longer their own boss, the loyalty and passion they once dedicated to their business tends to fade. Gone are the days of independent doctors who felt personally responsible for their patients’ well-being at all hours of the day. Now PCPs are largely shift workers, part of a large team of physicians overseeing patients and generating referrals. There are some benefits to this system for the doctors themselves. But ultimately, the transition means that patients no longer have a primary-care doctor. They have a primary-care doctor group, and may wind up seeing a new doctor every time they visit.

There are other obstacles involved in building doctor-patient relationships today. A visit with a primary-care doctor typically lasts 10-15 minutes because, in order to financially stay afloat as a PCP, you’ve got to churn through patients. There’s not a whole lot doctors can achieve in that amount of time, unless the patient’s health problem is quite simple. When the issues are more complicated, doctors typically handle some items on your list and then make you come back for another visit, and another co-pay, to tackle the rest. Meanwhile, the average time that patients have to take out of their day for a doctor visit is conservatively estimated to be 121 minutes.

All relationships, both personal and professional, are built over time. Does it qualify as a relationship if you’ve seen a doctor three times over three years?

But there’s an even larger issue: Our society is becoming more and more mobile. People are constantly moving to new neighborhoods and new cities; they change jobs every two to three years. They frequently change health insurance companies, and therefore doctor networks, as they or their employer search for a solution to rising insurance premiums. Not only does a primary-care doctor need to take Aetna, they need to be in your specific plan’s network within Aetna. And doctors drop and pick up new networks on a monthly basis as they prune low-paying insurance companies from those they accept.

Compounding all these socioeconomic and logistical issues is the fact that it is primarily children and the elderly who need consistent relationships with generalists. Children get sick and hurt all the time. They also have a very set schedule for pediatrician visits to keep vaccinations and check-ins on other developmental milestones up to date. A pediatrician who knows both the child and the parents can more efficiently diagnose and manage frequent issues.

But people in their 20s and 30s face fewer health problems than kids and the elderly, except for the occasional injury or acute illness. People in their 40s and 50s are also frequently lucky enough to stay generally healthy. It is only as we get into our 60s and beyond that we need an old-fashioned, close relationship with an internist again.

Kids need a consistent pediatrician. The elderly need a consistent internist. The chronically ill, no matter their age, need a consistent team and place to receive care. But for the rest of us—around 75% of the population—the old-fashioned “doctor-patient relationship” is unrealistic and largely unnecessary in our society. Rather than spend time and energy trying to pin down a primary-care doctor, it could well make more sense to simply stick with an urgent-care clinic when you come down with the flu.

Americans need a better solution. We need a system that’s as mobile as we are and that stays constant even as we change cities, jobs, local hospital networks, and insurance companies.

This means that we are most in need of access to our own health data and histories. No matter where you get medical care in America, your records should be a part of your personal profile that you own and control access to. Companies like Apple are already, albeit slowly, trying to implement this concept.

When primary-care doctors are no longer our first point of contact, we also need help understanding exactly how to navigate a system composed of a hodgepodge of health-care services and specialists. Given the cost of medical care, a mistake in how to best spend your money can be financially catastrophic.

Insurance companies have already tried to offer patients medical guidance by providing nurse phone lines, and video visits with doctors have also recently attempted to increase access to health care. But both of these strategies are reserved for very simple issues. For more complex problems, we need an online, integrated service made up of doctors and nurses who can help Americans make sense of a system of specialists and coordinate treatments and care. Such a project would be an ambitious undertaking–but it could go a long way toward fixing the problems with our current health-care system.

It’s a wonderful thing to have a trusted relationship with a primary-care doctor. But as our society changes, we must adapt. It’s time to admit that our system isn’t set up to allow a PCP for everyone, and demand something better for American patients.

We welcome your comments at ideas@qz.com.

14 Sep 05:09

Scientists have found a way to predict whether babies will develop asthma or allergies

by Katherine Ellen Foley
Bundles of joy—and microbes.

For a while now, it’s been clear to scientists that the collection of bacteria that dwells in our digestive tract plays a part in the way we break down food, respond to infections, and even our moods. But these associations have, so far, been just links, and not predictors.

Now, though, scientists have found that a particular pattern characterized by a lack of bacterial diversity in a baby’s gut microbiome can help predict whether or not she develops asthma or allergies later in life. Researchers led by a team from the University of California San Francisco (UCSF) found that infants with less bacteria and more fungi (a smaller component of the overall gut flora) made them three times more likely to develop allergies and asthma than their peers. Their work was published (paywall) in Nature Medicine on Sept. 12.

We have a reciprocal relationship with the tiny organisms that live in our guts. Lots of things that we do (or that happen to us) throughout our lives—like being born vaginally, having dogs (paywall), and eating a high-fiber diets—can increase the number of types of these benign microscopic organisms, and that’s widely considered a good thing: Having more diverse microbiomes has been associated with lower risks for conditions like obesity, auto-immune disease, allergies, and asthma. Researchers think that if they can spot these particular gut microbial populations early on, they can develop treatments, like diet or lifestyle changes, to alter these populations before chronic conditions become a problem.

In 2003, researchers from the Henry Ford Health Center in Detroit, Michigan took soiled diapers from 130 one-month old infants living in the area and froze them. Ten years later, when technology had sufficiently advanced, the Michigan team sent the samples to researchers at UCSF, who collected detailed sequences of the microbial genetic information. The UCSF researchers also looked at the collection of other molecules generated by these microbes.

Meanwhile, when the babies reached two and four years old, researchers tested them to see if they had risk markers for asthma and severe allergies. They found that 11 of the 130 babies they sampled were missing certain types of gut bacteria and had higher concentrations of fungi. This combination led to fewer immune cells that stop allergic reactions, and more chemical markers that have been associated with asthma.

Susan Lynch, a gastroenterologist at UCSF and lead author of the paper, said in a press release that this fraction of babies with less-diverse bacteria and a larger fungal population is similar to the proportion of the adults with severe allergies or asthma. Although the scientists aren’t sure exactly how best to diversify the gut microbiomes of babies, their work suggests that there are some steps parents can try to decrease the risk of these conditions, like owning a pet. “Having a dog track the external environment into the home may be just one way to improve the breadth of microbes babies are exposed to in very early life,” she said.

14 Sep 04:52

One Solution to Keeping India's Girls in School: Cheap Maxi Pads

by Shaifali Agrawal

In many stores across India, shopkeepers wrap maxi pads in black polythene. If they don’t have that, the products go in a small carton or brown paper bag. Absent those, “we try hiding it while walking down the road because of how people would react," says Khushboo Navani, a 23-year-old woman who lives in Bikaner. "People give you weird looks," she adds.

Menstruation is still considered a taboo in India. Lack of accessible and affordable menstrual products, coupled with the shame and silence surrounding them, contributes to millions of girls in India missing school after puberty, according to research conducted for UNICEF in 2015. The survey estimated that 1.9 million girls leave school during their periods each month.

In December 2015, India became one of the few countries to issue menstrual hygiene management guidelines under its Clean India Campaign. Since then, several hundred sanitary napkin vending machines have been installed across the country—in schools, colleges, jails, police stations, bus stands, railway stations, hospitals, and other public places.

Some 70 machines have been installed in the city of Ajmer; 30 more are in Chandigarh, and there are several in Nagpur, Mumbai, Amritsar, Assam, Dehradun, Lucknow, Punjab, and Nagaland, among others. They are funded and installed by the government and local municipal corporations, NGOs, and philanthropists, educational institutes, and private corporations. Installation costs vary from about Rs. 20,000 (about $299 USD) to Rs 45,000 ($673 USD), depending on location and the company. The machines dispense packets containing three pads, which go for Rs 10 ($0.15 USD). From a cost perspective, they’re self-sustaining, because the money collected can then be used to restock the supply.

“Installation of sanitary napkin dispensers is a very basic demand,” says Devika Mittal, a Ph.D. student from Delhi, who successfully appealed to the National Commission for Women to conduct sanitation audits in schools, colleges, bus terminals, and railway stations in 2014, cataloging the availability and cleanliness of toilets. Her letter to the government helped spur pad dispensers in institutions in several cities and districts of Maharashtra, including Nagpur, Mumbai, Chandrapur, Aurangabad, Gadchiroli, and Thane.

Mittal believes that the machines help dispel the stigma that women internalize. "Once you have the machines, you start recognizing menstruation as normal," she says.

Deane de Menezes, a 23-year-old researcher in Mumbai, dealt with the stigma by hiding her pads in a book when she passed through her office to change one in the bathroom. “There are guys sitting around, and sometimes I feel so embarrassed," she says.

The stigma isn’t just a problem in the workplace. An article on UNICEF India website states that "adolescent girls find it extremely difficult to even discuss the issue with their parents or elders in the family." And accordingly, a 2014 study conducted by by Dasra, USAID, and the Kaiwah Trust found 71 percent of Indian girls had no knowledge of menstruation before their first period.

The stigma results in many women devising alternatives to store-bought menstrual products. Recent research conducted by Neilsen for UNICEF India found that only 28 percent of girls and women interviewed used sanitary pads. Others opted for homemade napkins or cloth, and other surveys have found that women also use potentially dangerous alternatives such as ash, newspapers, leaves, or sawdust. Of the women who used homemade alternatives to pads, 80 percent cited cost as the main deterrent.

"Not everyone can afford a Whisper or a Stayfree," says Menezes, who started the Red is the New Green campaign, which spreads menstrual awareness and helps institutions install vending machines for pads. But if consumers opt for a well-known brand they recognize—even if they have to stretch to pay for it—they might try to make the package last for the duration of their period, and not replace their pads as often as is recommended, she adds.

Vending machines at public places, especially at educational institutes, can help girls stay in school by offering a clean, private environment they might not have at home. Across India, tens of millions of adolescent girls live in homes without toilet facilities. Squatting in the open poses the danger of sexual harassment. "School would be the best place for them to change and be clean," says Menezes.

India's planning commission has implemented a scheme for promoting menstrual hygiene among teen girls as part of its Five-Year Plan, which spans 2012-2017. A similar goal guides the #OneMillionPads campaign by Saathi Pads, a startup trying to connect biodegradable, banana-fiber menstrual pads to women throughout rural India. The co-founder Kristin Kagetsu explained her vision to Forbes: “The aim is to help with keeping women in work, or at school.”

12 Sep 18:55

Yes! The Berkeley soda tax is doing what it is supposed to

by Marion

Jennifer Falbe and other investigators from Kristin Madson’s group at UC Berkeley have just produced an analysis of the effects of the Berkeley soda tax on consumption patterns.

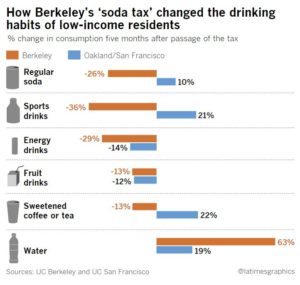
They surveyed people in low-income communities before and after the tax went into effect.  The result: an overall 21% decline in reported soda consumption in low-income Berkeley neighborhoods versus a 4% increase in equivalent neighborhoods in Oakland and San Francisco.

The Los Angeles Times breaks out these figures: 

In Oakland and San Francisco, which have not yet passed a tax, sales of regular sodas went up by 10%.

Other findings, as reported by Healthy Food America:

  • During one of the hottest summers on record, Berkeley residents reported drinking 63 percent more bottled water, while comparison cities saw increases of just 19 percent.
  • Only 2 percent of those surveyed reported crossing city lines to avoid the tax.
  • The biggest drops came in consumption of soda (26%) and sports drinks (36%).

Agricultural economist Parke Wilde at Tufts views this study as empirical evidence for the benefits of taxes.  He writes on his US Food Policy blog that it’s time for his ag econ colleagues to take the benefits of taxes seriously:

There is a long tradition in my profession of doubting the potential impact of such taxes…Oklahoma State University economist Jayson Lusk, who also is president of the Agricultural and Applied Economics Association (AAEA), has blogged several times about soda taxes, agreeing with most of the Tamar Haspel column  in the Washington Post, and concluding stridently: “I’m sorry, but if my choice is between nothing and a policy that is paternalistic, regressive, will create economic distortions and deadweight loss, and is unlikely to have any significant effects on public health, I choose nothing” (emphasis added).

Wilde points out that Lusk has now modified those comments in a blog post.

All that said, I’m more than willing to accept the finding that the Berkeley city soda tax caused soda consumption to fall. The much more difficult question is: are Berkeley residents better off?

Yes, they are.

The Berkeley study is good news and a cheery start to the week.  Have a good one.

Addition

Politico adds up the “piles of cash” being spent on the soda tax votes in San Francisco, Oakland, and Alameda and analyzes the soda industry’s framing of the tax as a “grocery tax.”

12 Sep 18:55

Do poor people need more cheese products?

by Marion

The USDA intends to buy $20 million worth of cheese products and will give them to federal nutrition programs and food banks.

Why?

To raise the price of milk and help milk producers.

Milk producers think this is way too little.  They asked USDA to buy $150 million in cheese products.  This would take 900 million pounds of milk off the U.S. market, reduce supply, and increase prices.

Is life tough for dairy farmers?  So they say.

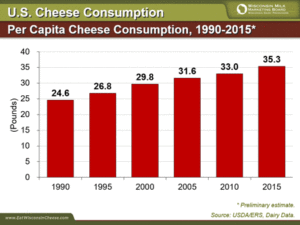
As for cheese, we already eat a lot of it, more every year.

Is this the best way to support dairy farmers?

Just asking…


Dairy fat and risk of cardiovascular disease in 3 cohorts of US adults

Mu Chen, Yanping Li, Qi Sun, An Pan, JoAnn E Manson, Kathryn M Rexrode, Walter C Willett, Eric B Rimm, and Frank B Hu

Am J Clin Nutr first published on 24 August 2016 doi:10.3945/ajcn.116.134460

http://ajcn.nutrition.org/content/early/2016/08/23/ajcn.116.134460.abstract


High intake of regular-fat cheese compared with reduced-fat cheese does not affect LDL cholesterol or risk markers of the metabolic syndrome: a randomized controlled trial

Farinaz Raziani, Tine Tholstrup, Marlene D Kristensen, Matilde L Svanegaard, Christian Ritz, Arne Astrup, and Anne Raben

Am J Clin Nutr first published on 24 August 2016 doi:10.3945/ajcn.116.134932

http://ajcn.nutrition.org/content/early/2016/08/23/ajcn.116.134932.abstract

12 Sep 18:54

Clever food industry ploy: look-alike snacks

by Marion

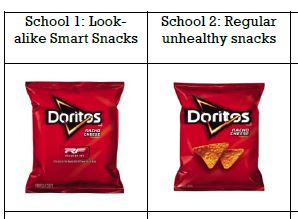
Jennifer Harris and colleagues at the Rudd Center have a study out in Obesity on how food companies are making products to meet the USDA’s nutrition standards for snack foods—but look just like the original products that don’t.

These, the press release says, are confusing to parents and children.

A fact sheet provides the evidence.

Students believed that look-alike Smart Snacks and the less-nutritious versions of the brands sold in stores were similar in healthfulness and expected them to taste the same.

No wonder.

This, of course, is the result of “nutritionism,” the defining of the healthfulness of a food by its content of specific nutrients—vitamins, salt, sugar, saturated fat.

The “healthier” versions raise the question: Is a slightly better-for-you product a good choice?

Not necessarily, alas.

This is why food-based standards make more sense.  Snack foods have a place in kids diets, but ideally a small one.

12 Sep 18:54

Sugar industry funding of research, 1967 style (with many lessons for today)

by Marion

I wrote a commentary for a study published this morning in JAMA Internal Medicine: “Food industry funding of nutrition research: The relevance of history for current debates.”

The study, by UCSF investigators Cristin Kearns, Laura Schmidt and Stanton Glantz, is based on their archival research.  They found documentary evidence of shocking manipulation by the sugar industry of a Harvard review of studies on dietary factors and heart disease published in the New England Journal of Medicine in 1967.

Kearns et al. discovered that the sugar industry trade association paid investigators at Harvard an impressive amount of money ($48,000 in today’s dollars) to produce research demonstrating that saturated fat—not sugar—raises the risk of heart disease.

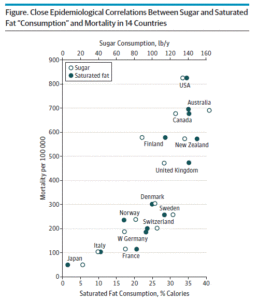
In my commentary, I reproduced a figure from the sugar-funded 1967 reviews.  This summarizes the epidemiology showing that both sugar and saturated fat intake were then indistinguishably associated with increased mortality in 14 countries.

Nevertheless, the reviews exonerated sugars and blamed saturated fat.

Yes, I know that association does not necessarily mean causation, but I’m guessing that the epidemiology still shows that both sugars and saturated fats are associated with increased heart disease risk.

My interpretation: We would all be healthier eating less of sugary foods and fatty meats.

Here are the relevant documents for your reading pleasure:

The Sugar Association issued a response to today’s article by Kearns et al.:

We acknowledge that the Sugar Research Foundation should have exercised greater transparency in all of its research activities…Generally speaking, it is not only unfortunate but a disservice that industry-funded research is branded as tainted…We question this author’s continued attempts to reframe historical occurrences to conveniently align with the currently trending anti-sugar narrative, particularly when the last several decades of research have concluded that sugar does not have a unique role in heart disease.  Most concerning is the growing use of headline-baiting articles to trump quality scientific research—we’re disappointed to see a journal of JAMA’s stature being drawn into this trend.

I will post press accounts as they appear (I’m quoted in most of these):

09 Sep 04:19

The Fight to Shush India's Booming Festival Season

by Chryselle D'Silva Dias

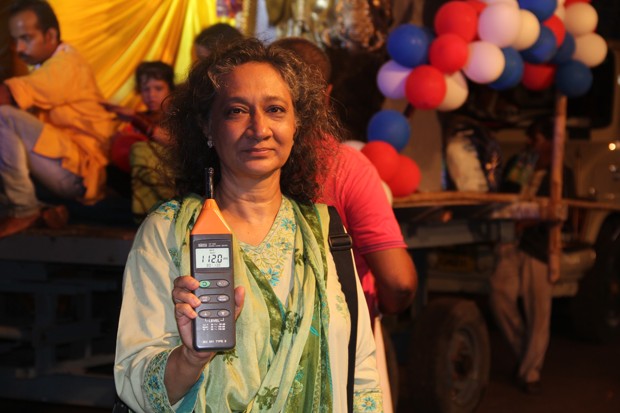
Sumaira Abdulali measures decibel levels around Mumbai year-round, carrying her meter to rallies and festivals. Her insistence on noise control measures has prompted a government officer to call her the Minister of Noise.  

Some months are louder than others. In September, India’s festival season begins in earnest. Throughout Ganesh Chaturti, idols of Lord Ganesh, the Remover of Obstacles, are installed in homes and neighborhood mandals (temporary booths with large installations of the idol) across India. For 10 days, the elephant-headed god is worshipped with offerings of food, milk, and flowers before being taken in a procession to be immersed in a body of water. This season of celebration continues until Holi, the festival of spring and color, in March.

It’s almost six months of celebrations, decorations, and firecrackers. There’s a lot of fun. There’s also a lot of noise.

Abdulali’s Awaaz Foundation is especially busy now, as her Gods Against Noise campaign is aimed at curbing noise during the festive season. Abdulali has been a crusader against noise pollution in Mumbai since 1995. She was instrumental in loudspeakers being banned in Mumbai between the hours of 10 p.m. and 6 a.m. and also in the creation of “silence zones” of 100 meters around schools, hospitals, and religious institutions, among other places.

The Gods Against Noise campaign is a watchdog, especially on guard during the loud festival season. Sumaira Abdulali carries a decibel meter with her. (Sumaira Abdulali/Awaaz Foundation)

The noise at festivals like Ganesh Chaturti or Diwali routinely crosses 100 decibels, nearly double the permissable maximum of 55 dB—the sound of normal conversation—in residential areas. Multiple loudspeakers blaring amplified Bollywood hits or devotional songs are commonplace around the idols of Ganesh. Firecrackers after prayers or during processions up the noise level, potentially disorienting and upsetting children, the elderly, and pets. Mumbai has around 1,300 official mandals that have received permission from the state government and several more that haven’t gotten permission or didn’t apply.

In 2005, the Supreme Court of India banned the use of loudspeakers after 10 p.m. This guideline, however, is relaxed for fifteen days of the year including specific festivals and holidays; Abdulali says that the “silence zones” are often disregarded during this time, too, even though local courts have recently reiterated the rules.

“Our fight against noise is a health issue,” says Abdulali. “There’s a lot of awareness about blindness, for example, but not much about hearing loss and how it affects us.” Prolonged exposure to noise, she says, is linked to both short-term and long-term problems, ranging from impaired sleep to cardiovascular disease.


Related Story

Why City Noise Is a Serious Health Hazard

An audiologist explains why it's so much more than a mere annoyance.


Abdulali is a big believer in the power of data. She collects information about decibel levels and offenders through social media. “People can use any noise-measuring app to record decibel levels and then send us the data to our Facebook page, where we will collate it on a Citizen’s Noise Map,” she says.

Though Abdulali says she’s rarely felt unsafe during her work on noise pollution, she’s received threats and intimidation tactics in response to other activism around illegal sand mining. That inspired her to form MITRA (Movement Against Intimidation, Threat, and Revenge Against Activists), a network of NGOs to protect people involved in grassroots activism. With noise pollution, though, spectators “are often curious about what I am doing and are interested in knowing more,” she says. “This has been consistent over the years: people are willing to listen to you.”

People have apparently been listening to Abdulali’s pleas to turn down the noise. Abdulali’s data indicates that noise levels have indeed dropped in the last six years, and at one festival, she recorded a 117 dB, down from a previous high of more than 125 dB. Social media is also playing an important role, as people share articles about noise pollution’s negative effects and use hashtags such as #HornFlu. Around Diwali, many campaigns promote the festivity as one of light, not sound.

Abdulali’s efforts have also resulted in the government of Maharashtra banning the use of the “Horn OK Please” signage on the rear of trucks and buses across the state, on the grounds that it encourages unnecessary honking. She also received unexpected support from the Mumbai police, who helped organize a No-Honking Day in August.

Encouraging people to celebrate more quietly is an uphill task, but progress is heartening. “It’s becoming apparent that noise is a serious health hazard,” Abdulali says. And she hopes that Mumbai is on the road to recovery.

09 Sep 04:14

“Dear Mark. I am writing this to inform you that I shall not comply”

by Sainth
07 Sep 20:48

Parents’ judginess of other parents is making their kids less able to deal with life

by Jenny Anderson
No parents in sight.

Crime rates have been dropping steadily for 20 years in most American cities. But you wouldn’t know it to look at the way Americans raise their kids.

Parents have been arrested for letting their children walk to the park alone or leaving a toddler in a car for a few minutes unattended. In 2015, police picked up two kids, aged 6 and 10, who were walking home alone. When the children’s father explained that they were allowed to do so, the police offer called Child Protective Services, and the parents had to put in place a “safety plan” detailing the children’s 24-hour supervision. It’s not only the US: In Britain, a recent study showed one in five children had been reported to social services before they turned five, many unnecessarily.

Many of us in our 40s spent our early years benignly neglected, roaming neighborhoods; today, leaving a child under the age of 12 alone is deemed negligent, or worse, criminal. So why, if cities are becoming safer, are parents becoming more worried?

Several factors have doubtless contributed. They include increasing litigiousness (a child falls in a playground and suddenly all playground equipment in the country has to be refitted); the rise of 24/7, online media, which makes every local horror story a national or global one; and events seared on every parent’s memory, like the disappearance in 1979 of Etan Patz, a child in Brooklyn who had practiced walking to the bus stop with his mother before doing it alone and being abducted.

But researchers recently found evidence that something else might be fueling this culture of hyper-vigilance: parents’ need to moralistically judge other parents for their parenting skills.

The moral instinct

Parents have done this since the dawn of time. Perhaps a child was not polite enough, or too unabashedly joyful in public. Perhaps he didn’t tuck his shirt in properly; her rambunctiousness was the result of a poor upbringing. Any parent is familiar with that surge of disapproval and annoyance at other parents who fail to keep their kids in check. It’s just that now, this judgment seems to have a new object: parents who put their kids at (perceived) risk.

To test that hypothesis, the researchers—Ashley Thomas, Kyle Stanford, and Barbara Sarnecka, all from the University of California, Irvine—engaged more than 1,300 people in a variety of experiments.

Each participant read a brief story in which a child spends a short period of time unsupervised. Each story had five variations, in which most of the details remained the same (for example, Jenny, aged six, is left alone for 25 minutes in a park a mile from her house) and only the reason why the child was left alone were changed. There was one unintentional reason—the parent was hit by a car—and four intentional ones: the parent went to work, to volunteer for a charity, to relax, or to meet a lover.

Then, the participant had to rate the level of risk the child faced, on a scale of 1 (no risk) to 10 (very high risk). The researchers’ hypothesis was that, although the child objectively faced the same risk in each of the five scenarios, participants would view children whose parents left them alone on purpose as being in greater danger.

The results bore that out. In each of the six experiments, the average was around 7 and the most common response was 10.

More than that: Even when people were asked to rate the morality of a mother who got hit by a car while returning a grocery cart—thus leaving the child alone for just a moment—participants rated the incident a 3 out of 10, where a 1 meant she did nothing wrong and a 10 meant she was fully responsible.

“People don’t only think that leaving children alone is dangerous and therefore immoral,” the authors wrote. “They also think it is immoral and therefore dangerous.”

“They were willing to assign a moral judgement to something out of their control,” Thomas says. “I don’t have children myself, and I guess I was surprised that people are SO judgmental about other people’s parenting,” she told NPR.

Why it matters

Driving is, objectively, far riskier to a child than letting him or her walk home alone. The risk of a child being abducted by a stranger and killed or not coming home is about 0.00007%, or one in 1.4 million annually, according to Daniel Gardner, author of The Science of Fear. Car accidents are among the leading causes of death in children. Yet no-one is arguing that parents should be arrested for driving their kids everywhere.

So if parents deem safe things risky merely to justify their moralizing, isn’t the inevitable result is that we will prohibit kids from doing safe things?

Ample evidence exists that children have way less freedom than they used to. To take one striking example: In the 1970s Roger Hart, a psychologist, spent two years making maps of where kids in a rural New England town were allowed to go by themselves—the “geography of children,” he called it. He did it again 40 years later.

In the 1970s, “he found that 4- and 5-year-olds were allowed to travel throughout their neighborhoods alone, and 10-year-olds had free run of the town,” Thomas wrote in her study. Forty years later, the crime rate had not changed, but most kids were not allowed—or did not venture—beyond their own backyards.

Over-parenting robs children of agency, some argue, preventing them from developing critical problem-solving skills. Peter Gray, a psychologist and professor at Boston University, believes less freedom has meant less free time for kids to play, which is hurting them.

“Where do children learn to control their own lives? When adults aren’t around to do it for you,” he told me earlier this year. “If you don’t have the opportunity to experience life on your own, to deal with the stressors of life, to learn in this context of play where you are free to fail, the world is a scary place,” he added.

It doesn’t have to be this way

Though the urge to judge parents may be universal, the situation in other countries suggests that the urge to judge them for risk-taking is not.

Germans probably love their kids as much as Americans, but in Berlin, playgrounds are an American litigator’s dream come true. Structures Americans or Brits might see as dangerous, Germans see as critical to building selbstständigkeit, or self-sufficiency.

In Japan, on the first day of kindergarten, kids walk or take public transport to school wearing special yellow hats. The hats are so that everyone knows who they are and can help them get to school, said Barbara Sarneka, another of the authors in the study. “Here, people would say that the yellow hats were like targets painted on their backs.”

Japan also has a TV show, Hajimete no otsukai (“My first errand”), about kids aged 2-6, who are secretly recorded as they go out to buy groceries alone for the first time. Not surprisingly, the the thrill of the kids in their new-found independence is adorable, and heart-warming.

In Denmark it is common for children to start walking or taking the bus to school alone at around age six, says Iben Sandahl, co-author of the book The Danish Way of Parenting. (Its subtitle: “What the happiest people in the world know about raising confident, capable kids.“) “It would definitely NOT be strange to se children playing alone in the park or at a playground without any parents around,” she wrote in an email. “It is more rare that parents join.”

Clearly Cophenhagen is safer than say, New York City. But Denmark is also shaped by the fact that parents value teaching kids autonomy. When parents are arrested for leaving their nine-year-old in a park to go to work at McDonald’s, autonomy is not the value we appear to be extolling.

Nonetheless, the US’s trend towards ever-greater caution does seem to be spreading elsewhere. Last year the Policy Study Institute, a UK think-tank, published a report (pdf), “Children’s Independent Mobility: an international comparison and recommendations for action.” It was a continuation of work begun in the 1970s, which examined how kids’ levels of independent mobility—“the freedom that children have to get about and play in their local neighbourhood unaccompanied by adults”—were changing.

The reason for the report, the authors said, was “the evidence…stretching back over 40 years, that independent mobility is declining with significant consequences for the health and physical, social and mental development of children.” Though there were wide variations from one country to another—Finnish kids had the most independent mobility—they found kids everywhere to be facing greater restrictions on their freedom.

The report’s authors recommended a number of policy changes, from more stringent road safety laws so that kids can walk and bike more freely, to better urban planning to create safe public spaces for kids.

“It is striking,” they wrote, “that the concept of independent mobility is not either a focus of many interventions or a major concern of policy-makers.” Instead of judging parents for encouraging their kids’ mobility, society should be finding ways to improve it for them.

07 Sep 20:43

The lasting impact of white teachers who mispronounce minority student names

by Clare McLaughlin
It's the little things.

Taking the attendance at the beginning of class may seem a routine if not mundane task to many educators. But to students, their name can be a powerful link to their identity. Pronouncing students names correctly – during attendance, a classroom activity, or any other time of the school day—should always be a priority for any classroom teacher.

Names holds ancestral and historical significance for many minority, immigrant, and English learning students. Names bring stories, which students are often forced to adapt to an “Americanized” context.

That transition, however, is often painful and forces many students to take on a name that is not their own.

Yee Wan was only 17 years old when she moved to the United States from Mainland China. After enrolling in the bilingual program at her school, she was faced with the overwhelming and unfair decision over whether she would keep her native name or change it to something more “Americanized.” Why? So that educators would not struggle over the pronunciation. Wan later realized she had no choice but to take up the name her ESL teacher thought suited her. Her new name would be Winnie.

 Names bring stories, which students are often forced to adapt to an “Americanized” context. Years later, Wan sits as the current president of the National Association for Bilingual Education (NABE) and her personal experiences became the impetus for a campaign launched this year to spotlight the importance of student names. A collaboration between the Santa Clara County Office of Education (SCCOE) and NABE, My Name, My Identity is calling attention to the potential negative effects of a mispronounced name and the ways schools and communities can defuse the problem.

“Mispronouncing a student’s name truly negates his or her identity, which, in turn, can hinder academic progress,” says Wan, who also serves as director of multilingual education services at SCCOE.

“A tiny act of bigotry”

Overlooking or downplaying the significance of getting a name right, explains Rita Kohli, assistant professor of education at the University of California at Riverside, is one of those “microagressions” that can emerge in a classroom and seriously undermine learning.

“Names have incredible significance to families, with so much thought, meaning and culture woven into them,” Kohli says. “When the child enter school and teachers—consciously or not—mispronounce, disregard or change the name, they are in a sense disregarding the family and culture of the students as well.”

“A tiny act of bigotry,” is how former teacher and education blogger Jennifer Gonzalez succinctly put it in 2014. In a post titled “How We Pronounce Students’ Names and Why It Matters,” Gonzalez wrote, “Whether you intend to or not, what you’re communicating is this: Your name is different. Foreign. Weird. It’s not worth my time to get it right.”

 “Students often felt shame, embarrassment and that their name was a burden.” The effects can be long-lasting. In 2012, Kohli and Daniel Solorzano examined the issue in a study called “Teachers, Please Learn Our Names!: Racial Microagressions and the K-12 Classrooms.” They found that the failure to pronounce a name correctly impacts the world view and social emotional well-being of students, which, of course, is linked to learning.

“Students often felt shame, embarrassment and that their name was a burden,” Kohli says. “They often began to shy away from their language, culture and families.”

Kohli points out that most educators are not doing so out of disrespect, but tend to be confined by a monocultural viewpoint that makes it “more challenging to center cultures outside of their own.” Consequently, certain names sound unfamiliar and fall far outside their comfort zone.

Showing respect, however, doesn’t necessarily require that an educator nails the pronounciation on the first attempt. “We can’t say every sound or name in the world, but it is how we respond that matters,” says Kohli.

Learn from the mistake

At Iroqouis High School in Jefferson County, Kentucky, where Mollie Robertson teaches math, English Language Learners will soon comprise almost one-third of the student population. For Robertson, every educator has an obligation to to promote equity and respect in the classroom.

“All students should have the opportunity to learn in a safe environment,” Robertson says. “To fully accept and respect a student, you must at a minimum know how to pronounce their name.”

Robertson adds that it’s okay to make an error, “but it is not okay to ignore the mistake or not learn from it.”

The My Name, My Identity campaign urges educators to honor their students by promising to learn how to pronounce their names correctly.

That’s where My Name My Identity comes in. On the campaign’s web site, teachers can access various resources on how to honor their students names. The campaign looks beyond the classroom to ask all community members to make a pledge honoring their neighbors’ and co-workers’ identities. Students and their families are also invited to share the significance behind their name on the My Name, My Identity Facebook page, or by tweeting @mynamemyid.

While the focal point of the campaign is students’ names, My Name, My Identity is about building a positive, inclusive school culture. With the teaching force still overwhelmingly white, the ability of educators with diverse classrooms to respect their students’ identity is critical, says Kohli.

“All teachers need to reflect upon and interrogate their biases and any deficit thinking they may have. See the cultural wealth of students and families, and approach teaching and learning through the lens and culture of students and their communities.”

This post was originally published on NEAToday. We welcome your comments at ideas@qz.com.

02 Sep 18:42

Your Money: ‘What if You Weren’t Afraid?’ and 4 More Money Questions From Readers

by RON LIEBER
Not surprisingly, parents and their values influenced how readers said they made decisions about saving, spending and giving.
27 Aug 18:39

You Could Skip Your Colonoscopy If You’re Willing To Collect Your Poop

by Katherine Hobson

Most Americans hear “colorectal cancer screening” and think “colonoscopy” — the unpleasant cleanse, the snakelike scope, the wobbly ride home. It’s a process that’s undeniably inconvenient, yet one we’re told is unquestionably necessary.

That’s a shame. Because although colonoscopy certainly has its advantages, direct evidence that it’s the best way to prevent deaths from colorectal cancer is not one of them. And the drawbacks of colonoscopy — including the time commitment, not-so-fun preparation, expense and small chance of harm — are probably keeping some people from participating in colorectal cancer screening.

According to public health experts, that’s a bad thing. The United States Preventive Services Task Force says the net benefit for screening adults age 50-75 is “substantial,” adding that colorectal cancer is the second-leading cause of cancer death in the country. But as of 2012, just 65 percent of eligible adults were being screened as recommended, and almost 28 percent had never been screened.

Among those who are screened, colonoscopy is by far the most popular method in the U.S. But there is a menu of options beyond colonoscopies — and they’re not necessarily any better or worse, according to the USPSTF’s recently finalized updated recommendations for screening among average-risk adults. The group said that while some tests are backed by more evidence than others, it found no head-to-head studies suggesting any strategy — including colonoscopy — is better than another. “Choose the one that fits your preferences and lifestyle,” said Douglas Owens, a physician and member of the task force.

Included on the list are two cheap, at-home poop tests intended to be done annually: the guaiac-based fecal occult blood test (gFOBT) and a more sensitive test called the fecal immunochemical test, or FIT. Both look for tiny amounts of blood in the stool that might be shed by cancer or polyps. You get one from your doctor, take a poop sample at home, and then return the sample to the doctor. Only if you get a positive result do you need to have a colonoscopy. (These are different from a new stool-based DNA test, which while on the USPSTF’s list is much more expensive and has been studied less.)

Of the two, Richard Wender, a physician and chief cancer control officer of the American Cancer Society, said the FIT is preferable, both because it’s more accurate and because it requires only one poop sample and no changes in diet. It costs about $25 or less and when done every year, the USPSTF’s models estimate, it will avert 20-23 deaths from colorectal cancer per 1,000 people screened. (Wender doesn’t recommend the OTC tests that are available.)

That’s comparable to the two “scope” tests on the USPSTF’s list, flexible sigmoidoscopy and colonoscopy, which have the advantage of both detecting and removing precancerous polyps in one procedure. (Flexible sigmoidoscopy, which looks at the lower part of the large intestine, has been shown by randomized trials to prevent deaths from colorectal cancer but isn’t reimbursed as well as colonoscopy and is on the decline in the U.S.)

Colonoscopy is the most popular test in the U.S. In addition to its polyp-removing ability, if you have a negative test, you don’t have to come back for another 10 years. There is indirect evidence it reduces colorectal cancer deaths, in the form of a large study following people who did and didn’t get the test over time. And it seems logical that if sigmoidoscopy cuts colorectal cancer deaths, the more extensive colonoscopy must provide a similar benefit. But that’s not yet been proved by randomized controlled trials. Based on the available evidence and its modeling, the USPSTF estimates it reduces deaths from colorectal cancer by 22-24 per 1,000 people screened.

But that lack of trial data is why the Canadian Task Force on Preventive Health Care earlier this year recommended against using colonoscopy as a first-line screening method. “They were very clear: We’re going to stick to the evidence, and right now we don’t have evidence for colonoscopy,” said Aasma Shaukat, section chief of gastroenterology in the Minneapolis VA Health Care System.

Colonoscopy also has plenty of downsides. It’s expensive, running upward of $1,000. (The test is covered without cost sharing as preventive care under the Affordable Care Act.) Most people prefer to have sedation during the procedure, which means time off from work and finding a ride home. There’s variation in the quality of the test, depending on who’s doing it. There’s a small but real risk of harm, such as a perforation.

So why do so many people prefer it to the poop test? For many, because they’ve been told it’s the best test to get. A 2012 study found primary care physicians overwhelmingly said they thought it was the best colorectal screening option. Katie Couric’s on-air colonoscopy in March 2000 boosted awareness and increased colonoscopy rates. There’s also a “more is better” attitude when it comes to medicine among many people, said Shaukat. And colonoscopies are well-reimbursed for the physicians who perform them. Hospitals have focused on marketing colonoscopies rather than alternative tests.

No one is arguing colonoscopy is a bad test. It just hasn’t been shown to be better than an annual FIT, said James Allison, a clinical professor of medicine emeritus at the University of California-San Francisco. He said the public health message is slowly changing to reflect that. The 80% by 2018 campaign from the National Colorectal Cancer Roundtable, for example, which aims to increase the rate of screening, emphasizes a suite of options. “People are very motivated to get screened when they hear colorectal cancer is the second-leading cause of cancer-related death and if they know there are tests that are affordable and can be done at home,” said Wender.

So if you want a colonoscopy after talking with your physician and digging into all its pros and cons — fantastic. But if you prefer something less invasive but more frequent, you can test your poop every year without feeling like you’re opting for, um, No. 2.

27 Aug 18:28

We Use A Whole Bunch Of Energy Every Summer (And A Lot Of It Goes To Waste)

by Maggie Koerth-Baker

The time of swimming pools, sweat and sangria is almost at an end — and with it will end the year’s peak electricity use. Although the data on exactly how much electricity Americans consumed in July and August isn’t yet available, it’s all but guaranteed to be the peak. It always is. You can see it in the data from 2015, and you can see it in the past 15 years’ worth of data, too.

mkb-electricity-5

That pattern — summer peak, fall lull, smaller winter bump, spring respite — is the energy data equivalent of peeping on your neighbor’s bubble bath. It exposes how humans in the U.S. make themselves comfortable. The biggest seasonal fluctuations in energy happen in homes. What you’re seeing in these charts is, largely, the cool blast of millions of air conditioners as they quell marital disputes, soothe sleeping babies and save lives that might otherwise be lost to heatstroke.

As you enjoy the last of those cool artificial breezes before fall sets in, I suggest taking a moment to get a little more familiar with electricity generation — since it’s already on such familiar terms with you. One of my favorite energy charts for laypeople is produced by Lawrence Livermore National Laboratory — it shows you exactly where our energy comes from, what we use it for and how much goes to waste. And herein hangs a tale.

Energy_2015_United-States

If you look at this chart, you can follow how energy goes from source on the left to use on the right. The electricity you’re now enjoying is the biggest single use of energy in the country (that orange box at the top). We burn more energy to make electricity than we do to drive cars (the pink box at the bottom).

But you’ll also see that we never get to use most of that energy. Thirty-eight quadrillion British thermal units of energy — mostly from burning coal and natural gas — went into electricity production in 2015. Almost 13 quadrillion Btu of useful energy came buzzing out across our power lines. The remaining 25 quadrillion Btu? It was just lost — mostly in the form of heat that rises and shimmers off the motors and machinery of the nation’s electric power plants.

Now, you might think that’s a big opportunity to make this system more energy efficient. Capture some of that lost energy, and we wouldn’t have to burn so much fossil fuel up front. (A big deal, since electricity generation is also the U.S.’s No. 1 source of carbon emissions.) But there’s a catch. And the catch is physics. Well, physics and the long life spans of expensive bits of infrastructure.

Most power plants built from the 1950s through the 1980s are about 35 percent efficient, said A.J. Simon, an energy systems scientist at the Lawrence Livermore National Laboratory. That category includes most of our coal-powered energy generation. Low efficiency is baked into the being of those plants. Just as a car engine burns gas more efficiently on the highway than at slower street speeds, it takes less coal to turn water into steam (which makes the turbines go) at higher temperatures and pressures than at lower ones.

And the old power plants are made of old materials that don’t allow them to be hot enough or pressurized enough to reach peak efficiency. Many new power plants — mostly powered by natural gas — have been built in the past 10 years, and they do have higher efficiencies — up to 60 percent on their best days. There’s also a new generation of “ultra-supercritical” coal plant, made with more heat-durable materials. The efficiency of those plants tops out at about 42 percent, Simon said. The first of these in the U.S. started operating in 2012, and it was hotly contested by environmental advocates.

Why? Because it’s still coal, and philosophy matters here as much as engineering. Do we reduce fossil fuel use by building as much renewable generation as is technologically feasible and rely on old, less-efficient fossil fuel plants for backup? Or do we invest in more efficient fossil fuel plants even if that choice prolongs our dependence? Everybody enjoys a cold drink in a chill room on a summer day, but the answers to our energy-money conundrums are a lot harder to agree on.

26 Aug 23:13

Is the McMansion era over?

by Lloyd Alter
It appears that they have turned out to be a bad investment.
20 Aug 06:03

Hong Kong's First Bunny Cafe Comes With a Note of Caution

by Linda Poon

To indulge in the latest critter craze over a cup of coffee, skip the cat cafes and head down the rabbit hole to Hong Kong’s first-ever bunny cafe. Taking a cue from Tokyo, which hosts a menagerie of critter cafes—from owls to rabbits to snakes—29-year-old Teddy Chui opened Rabbitland Cafe this spring in the popular shopping district of Causeway Bay.

The shop, which serves lunch options of sandwiches and fries, houses 12 rabbits, many of which had been abandoned by their owners. Customers who reserve spots in advance can pet and feed the furry companions in their open cages, but there are strict rules against picking them up or pulling on their ears.

Rabbitland has so far proven to be a hit with diverse patrons, including parents visiting with their young children and groups of Hong Kong Millennials. In one the world’s densest cities, apartments are barely big enough to fit an entire family, let alone extra furry companions. Plus, with names like Sesame, Mung Bean, and Cotton Candy, who can resist?

A photo posted by Hayson 希慎 (@haysonlai) on

As cute as they are, though, Chui told Agence France Presse (AFP) that the animals are also very high maintenance. The Hong Kong Rabbit Society, an animal welfare organization, says rabbits are the third most neglected animals in Hong Kong, with an estimated 200 rabbits abandoned each year. For as little as $400 HKD (about $50 in U.S. currency) a critter, rabbits seem to make good gifts, especially during the holidays—until they chew up your furniture and household wires.

“Rabbits are not that interactive,” Shirley Tong, chairperson of HKRS, told the Hong Kong Economic Journal. “They see you as friends, but not as owner. That’s why they seldom obey orders.”

Part of Chui’s goal is to help kids and their parents who can afford the space to understand what it takes to raise a bunny. “A lot of parents bring their kids here if they want to buy a rabbit, so they know it’s not all about playing with them—it’s a lot of work and responsibility,” he told AFP.

But for the many who don’t have the luxury of space, and who have second thoughts about committing up to 12 years (their average lifespan) to a cuddly bundle of mayhem, a rabbit cafe may be the next best option.

A photo posted by @m.onka on

2 Days HK Family Day Rabbit Cafe ...

A photo posted by Sonio Tam (@soniotam) on

FLUFF ... Look at that perfect bunny tail! #fluff #bunny #rabbit #yelphk #petstagram

A photo posted by @wombellingalong on

15 Aug 18:42

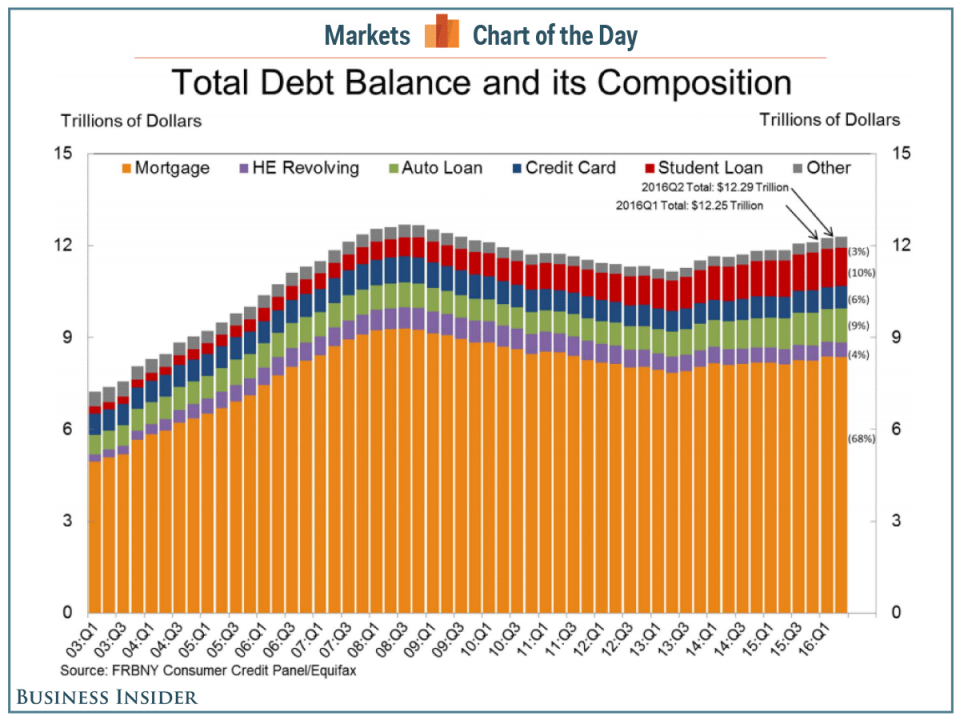
American Total Debt Balance and Its Composition

by Barry Ritholtz

Interesting chart of consumer debt — its worth noting that two of the biggest categories — mortgage and auto borrowing — are backed by a hard asset. Student loans are the largest unsecured debt.


click to embiggen graphic

Source: Business Insider

The post American Total Debt Balance and Its Composition appeared first on The Big Picture.

13 Aug 05:01

What I learned as a hired consultant to autodidact physicists

by tbrownaw
12 Aug 22:30

Economic View: Why American Schools Are Even More Unequal Than We Thought

by SUSAN DYNARSKI
Economic disadvantage is often gauged by student eligibility for subsidized lunch, but this standard measure substantially understates the achievement gap.
11 Aug 04:47

The world needs to stop being scared of women who run too fast

by Silvia Camporesi
India-Caster-Semenya

The Court of Arbitration for Sport’s suspension of regulations on hyperandrogenism— a medical condition that causes an excessive amount of testosterone in the body—cleared the track for Indian sprinter Dutee Chand and other female athletes, including South Africa’s Caster Semenya, to compete at the Rio Olympics this year. Semenya is the favourite to win gold in the 800-metre final on Aug. 21, and perhaps even break the world record.

In anticipation of her victory, the controversy around her supposed “unfair advantage” in competition has already started. South African sport scientist Ross Tucker—who disagreed with the court ruling—also suggested that a good performance by Semenya or Chand, who challenged the International Association of Athletics Federations (IAAF) after they introduced the regulations, provides the IAAF with a reason to go back to the court and say “here you go—here’s your evidence”. Indeed, Semenya’s participation at Rio has been referred to as a “ticking timebomb.”

But even if testosterone did confer an athletic advantage, this advantage would not be unfair. This is because setting a limit on hyperandrogenism and singling it out from other biological variations that may confer an advantage is—at best—an inconsistent policy. There are plenty of other variations—biological and genetic alike—that are not regulated by the IAAF and, even though advantageous for athletic performance, are not considered unfair for competition.

More than 200 genetic variations have been identified that provide an advantage in elite sport. They affect a variety of functions including blood flow to muscles, muscle structure, oxygen transport, lactate turnover, and energy production. Endurance athletes, in particular, have been shown to have mitochondrial variations that increase aerobic capacity and endurance. An increasing number of performance-enhancing polymorphisms (genetic variations found at an increased frequency only in elite athletes and that make them who they are) are identified by sports geneticists.

In fact, the IOC medical commission commissioned a recent volume to summarise the most up-to-date evidence on the genetic and molecular basis of sports and human physical performance.

Quite ironic, as on the one hand athletes with naturally occurring, endogenous genetic or biological variations are celebrated as a source of inborn excellence (and talent identification and development programmes are aimed at finding such naturally occurring biological variations that provide an advantage in competition); and on the other hand athletes with other naturally occurring, endogenous genetic or biological variations such as hyperandrogenism are disqualified from competition on the grounds of an unfair advantage.

Why pick on hyperandrogenism?

So then why is hyperandrogenism singled out as a biological variation that makes competition unfair? It is singled out because it challenges our deeply entrenched social beliefs about women in sport in a way that other variations do not.

And what we see when we look at these women’s bodies is used as a visual trigger for testing. The “infamous” Ferriman and Gallwey Hirsutism scoring sheet developed in 1961 was included in the appendices of the IAAF regulations to “visually score athletes” who may then be targeted for testing (these documents have since been taken off the IAAF website following the CAS ruling but can be accessed here).

Last year, the court of arbitration for sport requested that the IAAF demonstrate a “correlation” between levels of testosterone in female athletes and competitive advantage. The panel explicitly stated that the IAAF assumption (that increased testosterone confers an advantage) “may well be proved valid” but sufficient evidence had not yet been provided to show the correlation. Currently, the “onus of proof remains” on the IAAF.

India-Dutee-Chand

Go Dutee Chand. Go and break that glass ceiling and that world record.

But the court’s decision should have instead been that there is no level playing field in sport. Olympic athletes are way out at the tail ends of the Gaussian curve of normal species functioning because of all kinds of genetic and biological variations that, together with character traits such as mental toughness, make them who they are: elite athletes. That’s why they’re there, competing, and we’re here, writing and reading about them.

Under IAAF regulations, women such as Semenya and Chand would have been forced to take androgen suppressive therapy—in the absence of a medical condition—something that Chand refused to do, saying “I am who I am.” Thousands of women are affected by hyperandrogenism, which does not pose an immediate threat to health, as medical evidence shows. Androgen suppressive therapy is, therefore, unnecessary and could create health problems instead. The call for suppression therapy is medical imperialism and a direct consequence of the male hegemony that dominates sports. Combined with the myth of a level playing field in elite sport, they reinforce each other in the search for a mythical master molecule that neatly divides the two sexes.

The fact remains that female athletes who do not conform to the norms imposed by society, and who significantly outperform their female peers, are challenged under the guise of biological or genetic abnormalities that bestow an unfair advantage.

Sport is political. Sport reflects our society. We see this all the time, with the doping scandal and the inability of the IOC to punish the state that had been sponsoring doping. This decision about hyperandrogenism is about women in sports and women outside sports. Semenya’s case would never have happened if she had not run so damn fast.

Our society is still afraid of women who run too fast, who speak too loud, who are too good, who can be president. This is what this is about. Let’s not be bamboozled by discussions of fairness in sport. There is no level playing field in sport. These Olympics will be a test and a reflection of the state – and the health – of our society. Are we ready? Semenya is. Chand is. Go Caster. Go Dutee. Go and break that glass ceiling and that world record.

The ConversationThis article was originally published on The Conversation. Read the original article. We welcome your comments at ideas@qz.com.

02 Aug 22:40

How Nighttime Darkness Illuminates the Rural Poor

by Tanvi Misra

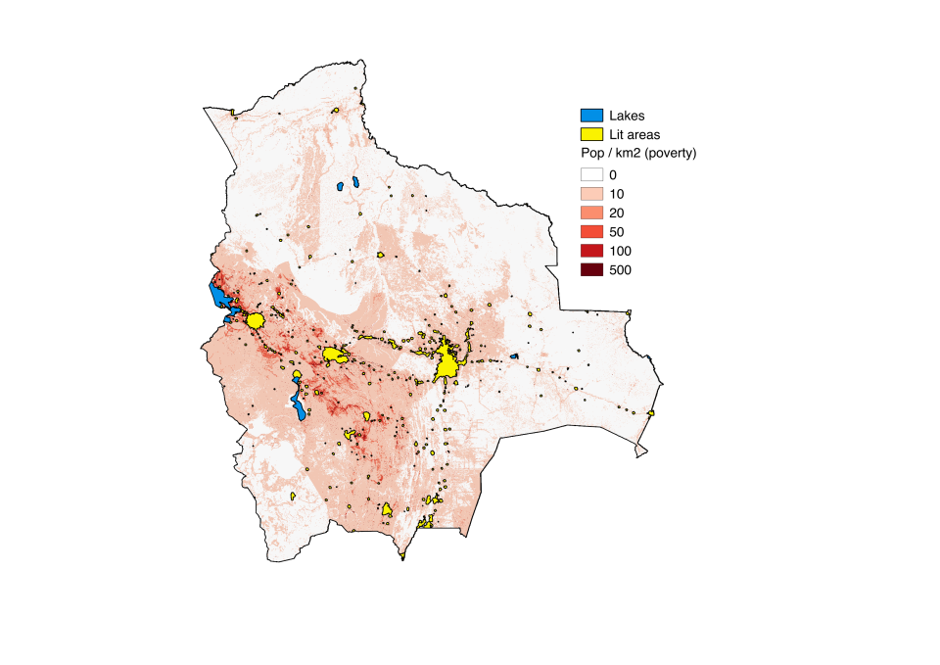
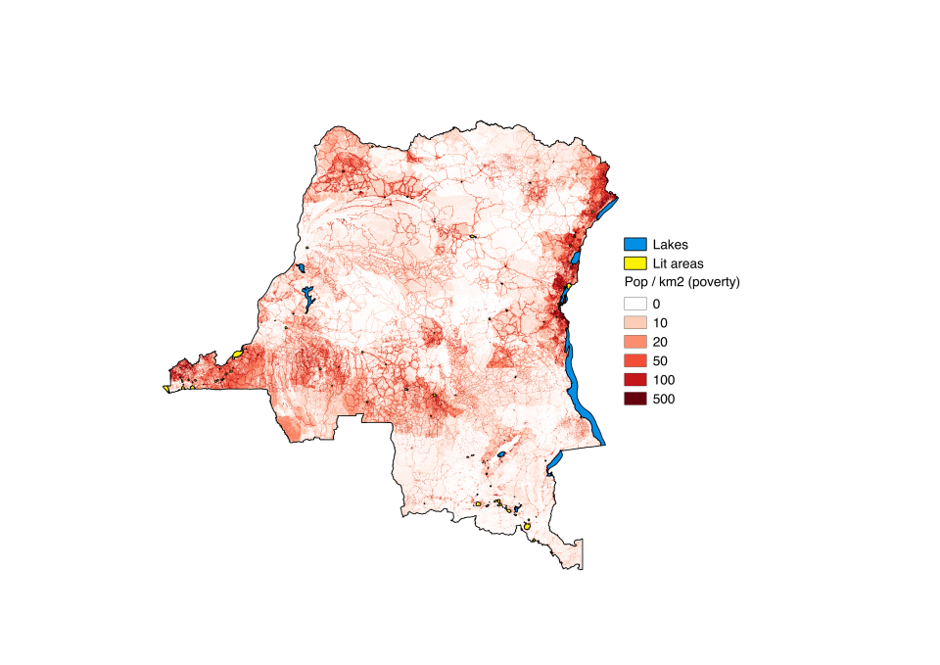
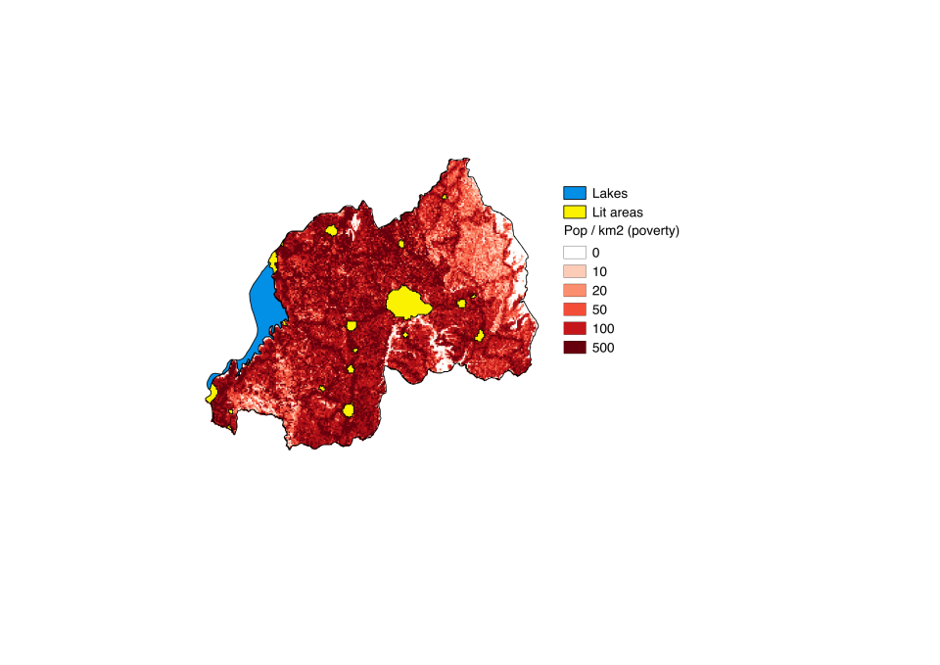
Hovering above the earth are orbiting cameras, clicking pictures of the planet’s surface. Each image contain layers and layers of information. Economists have recently started mining these images for clues that can help create a quicker, more extensive, up-to-date database of global poverty that can supplement door-to-door surveys.

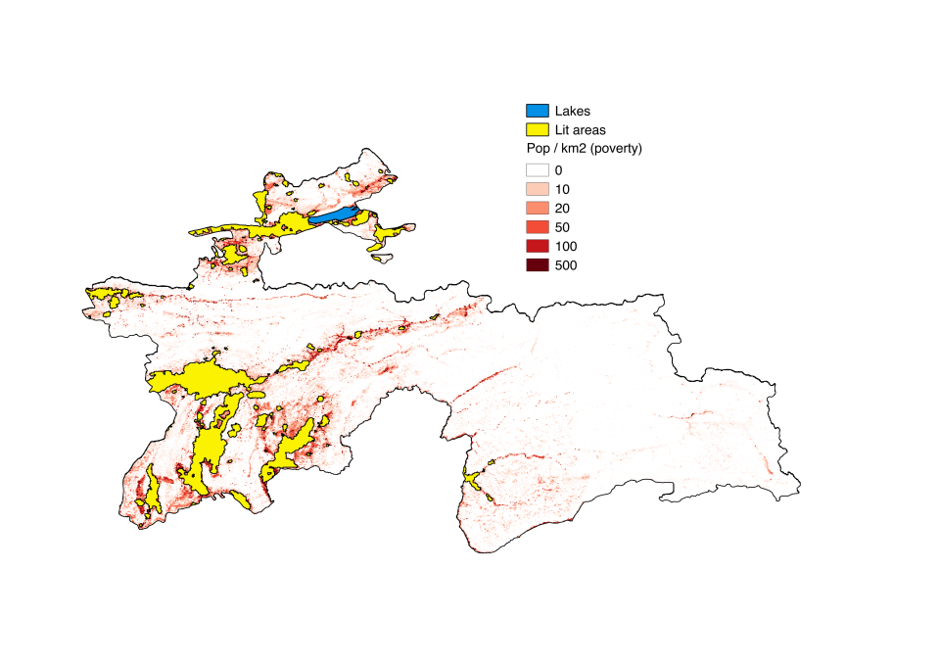
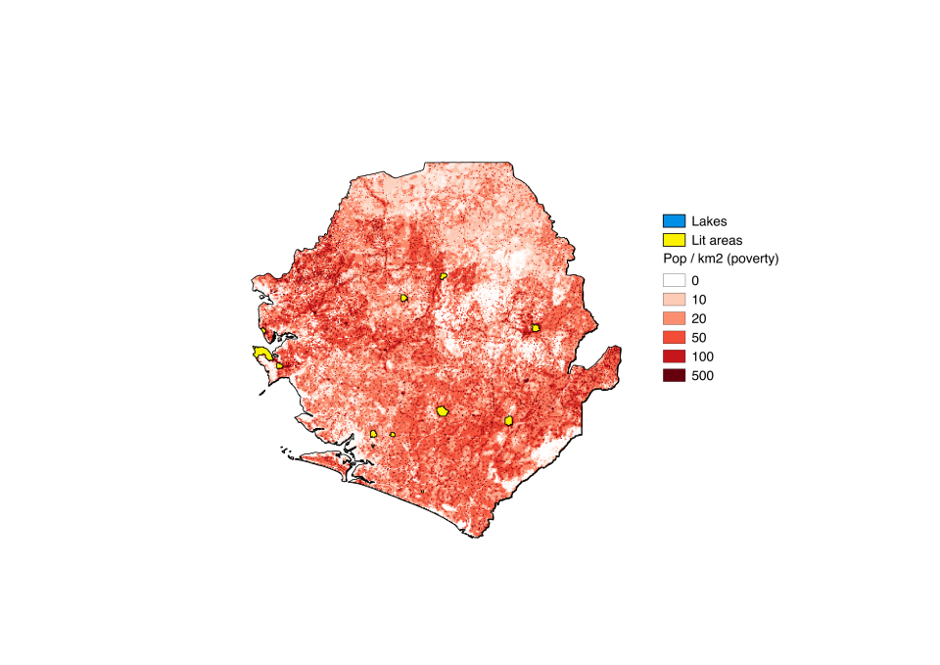
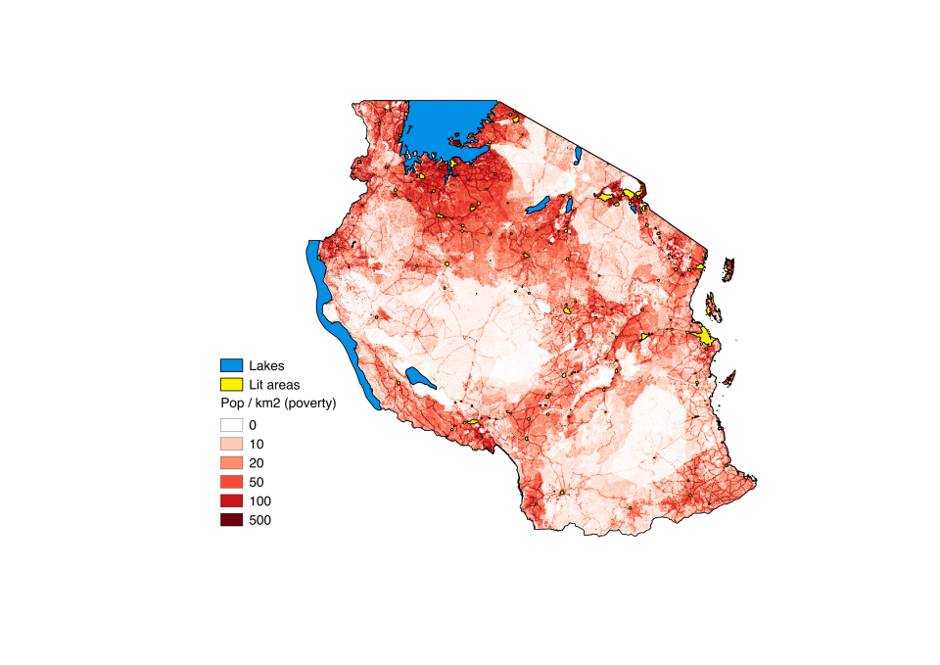
In a new paper, researchers Samuel Wills, Brock Smith, and Thomas McGregor at Oxford University in London present a fresh twist to this technology-driven approach: they illuminate rural poverty by isolating areas where people live in darkness at night.

It makes sense: light is a basic human need, and people tend to use it more as they become richer. The amount of light emitted from a certain region can be an indicator of the level of economic growth and infrastructure investment there. Plus, light generated through electricity is easy, fast, and relatively cheap to detect via satellite imagery.

But in the realm of poverty, everything is not illuminated; Areas of nighttime darkness hold a lot of hidden information. “Looking for poverty in light is like looking for lost keys under a street lamp,” Wills tells CityLab. “It’s better to focus on darkness.”

In order to do that, Wills and his colleagues combined two high-resolution datasets: one that documented the light emitted from the planet between 1992 and 2013, and the other the global population distribution between the years 2000 and 2013. They found that, by and large, people who resided in unlit areas around the world were extremely poor.

Of course, nighttime darkness is not a perfect economic measure by any means. The researchers write:  

People living in darkness is an admittedly crude proxy for poverty. It only captures rural poverty and tells us nothing about urban poverty rates. It only considers one component of a household’s consumption bundle, light, and ignores the many other unmet needs that characterise poverty. It will also pick up different levels of poverty around the world, as the provision of light depends on how effectively central governments provide electricity grids.

Even so, in countries with large swathes of un-urbanized land, it turns out nighttime darkness can identify rural poverty levels to a high degree of accuracy. In the Democratic Republic of Congo, Tanzania, Colombia, the Dominican Republic, and Tajikistan, for example, this method correctly detected more than 80 percent of households above or below the poverty line, compared to 600,000 household surveys. The overall accuracy rate for the countries analyzed was as high as 83 percent.

McGregor, who co-authored the paper, created the maps below, which show the lit (in yellow) and unlit areas (in red) in some of these countries. The deeper the red, the higher the number of people per square kilometer (0.4 square mile) living in darkness, and by extension, likely in extreme poverty.

Bolivia (84 percent accuracy)

Rural poverty map of Bolivia, based on 2010 data. (Courtesy of Wills, McGregor, and Smith)

Democratic Republic of Congo (90 percent accuracy)

Rural poverty map of Democratic Republic of Congo, based on 2010 data. (Courtesy of Wills, McGregor, and Smith)

Rwanda (77 percent accuracy)

Rural poverty map of Rwanda, based on 2010 data. (Courtesy of Wills, McGregor, and Smith)

Tajikistan (86 percent accuracy)

Rural poverty map of Tajikistan, based on 2010 data. (Courtesy of Wills, McGregor, and Smith)

Sierra Leone (84 percent accuracy)

Rural poverty map of Sierra Leone, based on 2010 data. (Courtesy of Wills, McGregor, and Smith)

Tanzania (74 percent accuracy)

Rural poverty map of Tanzania, based on 2010 data. (Courtesy of Wills, McGregor, and Smith)

These maps offer a new way for development agencies and relief groups to target their anti-poverty efforts. They also help gauge the rural-urban divide in consumption of resources such as oil. Via the paper:

We find that high oil prices and new discoveries stimulate economic activity (proxied by lights) in countries with oil relative to those without. However, this new activity is restricted to towns and cities. Both types of oil boom have no effect on the rural poor. There is no evidence that oil booms cause unlit rural areas to become illuminated, or people to leave unlit areas for towns and cities.

02 Aug 22:38

Home Truths: With East Bay home prices reaching an all-time high, how are buyers coping?

by Red Oak Realty
Souza’s clients found their perfect home in Berkeley

After much hunting and heartache in a hot market, some recent Red Oak Realty clients found their perfect home in Berkeley. Photo: MLS

By Paul Hagey

New Red Oak logo Dec. 2015 Use this one for sponsored posts!Home Truths, a quarterly report on the state of the Berkeley real estate market, is brought to you by Red Oak Realty.

Alameda renters Alex and Debbie Allen,* 32 and 30 respectively, had scraped and saved for five years and were now ready to buy their first home, preferably in Oakland. They started their hunt last year.

They were looking for a single-family home in a walkable neighborhood. Hoping for a 3-bedroom, 2-bath home, their budget hovered in the $600,000s, with financing.

The Allens quickly learned that wouldn’t take them far. The median East Bay home price reached an all-time high in the second quarter: $832,000, according to MLS data analyzed by Red Oak Realty. (The previous second quarter high was in 2015.)(...)

Read the rest of Home Truths: With East Bay home prices reaching an all-time high, how are buyers coping? (975 words)


By Red Oak Realty. | Permalink | 11 comments |
Post tags: Bay Area real estate, Berkeley real estate, East Bay real estate, Home Truths, Red Oak Realty

02 Aug 22:17

Which Households Have Negative Wealth?

by Guest Author

Which Households Have Negative Wealth?
Olivier Armantier, Luis Armona, Giacomo De Giorgi, and Wilbert van der Klaauw
Liberty Street Economics, August 01, 2016


Which Households Have Negative Wealth?At some point in its life a household’s total debt may exceed its total assets, in which case it has “negative wealth.” Even if this status is temporary, it may affect the household’s ability to save for durable goods, restrict access to further credit, and may require living in a state of limited consumption. Detailed analysis of the holdings of negative-wealth households, however, is a topic that has received little attention. In particular, relatively little is known about the characteristics of such households or about what drives negative wealth. A better understanding of these factors could also prove valuable in explaining and forecasting the persistence of wealth inequality. In this post, we take advantage of a special module of the Survey of Consumer Expectations to shed light on this issue.

The Survey of Consumer Expectations (SCE), which was introduced in 2013 and uses a monthly rotating survey panel of roughly 1,300 respondents, focuses on collecting subjective expectations about the economy and the respondents’ behavior. As part of the SCE, a special module on household finance is fielded once a year. This module collects detailed data on the composition of respondents’ financial assets and debt, as well as their expectations about how these might change in the future. The special household finance survey has been conducted twice, in August 2014 and in August 2015. The micro-data from the 2014 module has just been released on the SCE website. The analysis conducted in this post is based on the August 2015 module.

The special module asks respondents about their finances on a multitude of dimensions. This information is used to construct a measure of the total assets and total debt that a head of household and his or her partner may have. Our measures of assets and liabilities closely mirror the measure of wealth derived in the Survey of Consumer Finances (SCF), a nationally representative triennial survey that asks respondents for detailed financial data. Notably, our measure of wealth excludes any human capital—such as education, as well as Social Security and defined-benefit-pension wealth.

With respect to assets, we ask respondents how much money is in their defined contribution plan(s)—including 401(k), 403(b), 457 or thrift savings plans—and Individual Retirement Arrangement accounts, which cover the most common channels through which Americans save for retirement. We also ask the respondents about their total savings and investments, such as money in their checking accounts, stocks, and other financial instruments they may possess. Homeowners are asked to self-appraise the current value of their home. Finally, we ask for self-appraised valuations of any additional land, businesses, vehicles, or other assets the respondent’s household may own. The measure of total assets is then the sum of financial wealth, retirement wealth, home value, and other assets.

With respect to debt, we ask respondents about their home mortgages and home equity lines of credit, as well as nonhousing personal debt in categories such as credit card, student loans, and auto loans, among others. The sum of all these debts constitutes our measure of total debt. We classify households as having negative wealth if their total debt exceeds their total assets, according to our measurements.

We estimate that 15.1 percent of the households in the U.S. population have net wealth less than or equal to zero, while 14.0 percent have strictly negative wealth. Because of differences in measurement—such as in determining who is included as a household member—estimates vary across surveys and also vary somewhat over time. For example, the share of households with non-positive wealth was estimated to be 18.1 percent in the 2011 panel of the Survey of Income and Program Participation, 12.9 percent in the 2013 Survey of Consumer Finances, and 19.4 percent in the 2013 Panel Study of Income Dynamics. Our 2015 SCE estimate of the share of households with negative wealth falls within the range observed.

What are the characteristics of households with negative wealth? We find that the heads of such households are younger than their counterparts in households with non-negative wealth—an average age of 43 compared to 51. They are also slightly less likely to have a college or postgraduate degree—43 percent and 12 percent, compared with 45 percent and 15 percent, respectively. Moreover, we find the association between having negative wealth and the head of household’s age to be stronger for those with a college degree and especially so for those with postgraduate degrees. These results are consistent with standard life-cycle models of consumption and savings, which predict that agents smooth the marginal utility of consumption by incurring debt—for instance, student loan or credit card—when young and then steadily increasing savings until retirement. In particular, those models predict that young and educated households might have negative wealth as their incomes will likely grow with age so that they will be repaying what they have borrowed when young.

Consistent with intuition, households with negative wealth have much lower average annual incomes than households with non-negative wealth, $39,077 versus $86,309, respectively. Negative-wealth households are also much less likely to be homeowners, 19 percent, compared with 75 percent for those with non-negative wealth; or self-employed, 2 percent versus 8 percent. Heads of household with negative wealth are also more likely to be female, 69 percent versus 45 percent for households with non-negative wealth; single, 57 percent versus 33 percent; or from a minority group—defined here as African American or Hispanic—24 percent versus 17 percent. In addition, single parenthood, 20 percent versus 8 percent, and especially single motherhood, 24 percent versus 6 percent, are strongly associated with negative household wealth—a finding that is consistent with a known higher poverty rate for such households. Finally, negative-wealth households are more likely to include a household member who experienced a deterioration in health over the past twelve months, 18 percent versus 11 percent for non-negative wealth households. All of these differences are statistically significant and most remain so when we use a multivariate regression analysis relating negative-wealth holdings to all demographic variables simultaneously.

Having examined the characteristics of households with negative wealth, we now compare the average and median levels of assets and debt across four groups of households. The chart below displays, in the leftmost column, the average and median asset and debt levels for households with non-negative wealth. The next three columns display the same statistics separately for each tercile of negative-wealth households, for example, the second column illustrates the data for those with the least negative wealth and the final column reflects households with the most negative wealth. The very low median levels of assets for all negative-wealth households are readily apparent, as are the large average and median debt amounts among households with larger negative wealth.

LSE_2016_Chart_Which Households Have Negative Wealth?

Next, we focus on debt composition for each of the four household wealth groups. To do so, in the chart below we look at each respondent’s debt composition, that is, what percentage of that person’s total debt comes from different sources. We consider seven categories of debt: housing loans (mortgages), credit card debt, auto loans, student loans, medical bills, legal bills, and other personal loans.

LSE_2016_Chart_Which Households Have Negative Wealth?

The chart above reveals a substantial amount of heterogeneity between negative-wealth respondents. Among those households with a negative wealth of less than $12,400 in magnitude, their debt is dominated by credit cards, which on average account for more than 30 percent of their total debt. This relative exposure to credit card debt is 60 percent larger than that of households with non-negative wealth. What distinguishes households in the middle third of the distribution of households with negative wealth, -$12,500 to -$46,300, is mostly student loans, which constitute 40 percent of their total debt, compared with less than 10 percent for households with non-negative wealth. Finally, households with the most negative wealth are characterized by their relatively large shares of student debt, 47 percent, and mortgage debt, 22 percent. The latter is approximately twice as large as the share of mortgage debt of the other negative-wealth terciles. Yet, notably, non-negative wealth households have more debt in home loans on average than any of the negative-wealth groups. The large share of mortgage debt among the bottom tercile of negative-wealth households can be attributed to a substantial proportion of households with negative home equity. Overall some 7 percent of home-owning households in our survey report being underwater on their mortgage, with the rate being 4 percent for home-owning households with non-negative wealth and 36 percent for homeowners with negative wealth.

Turning now to asset composition, we can see in the chart below that there are stark differences between those who have negative wealth and non-negative wealth. Most noticeable is the relatively small share of housing assets among those with negative wealth. Housing assets constitute only around 13 percent of total assets on average for households with negative wealth, while they account for more than 40 percent of the assets of households with non-negative wealth. In place of this, it seems the primary asset held by households with negative wealth is their vehicle(s), 40-55 percent of their total assets, while vehicles account for less than 15 percent of the assets of households with non-negative wealth.

This result is due in part to the relative lack of home ownership among negative-wealth households: only 20 percent of negative-wealth households own their residence, while 75 percent of non-negative wealth households own their home. Within negative-wealth households, there are some differences in asset composition depending on the magnitude of negative wealth. The slightly higher share of assets in housing in the bottom tercile of negative wealth again is consistent with a higher rate of households with negative equity in this group.

LSE_2016_Chart_Which Households Have Negative Wealth?

The overall patterns we see in our data are broadly consistent with a life-cycle model of saving in the presence of multiple sources of uncertainty, where people generally borrow when young and repay and save when older. Those with negative wealth include students, who use debt to finance their human capital investment and for whom negative wealth is expected to be a temporary, rather than permanent status. Negative-wealth households also include households hit by negative shocks, such as in home value and health, as well as female-headed single-parent households.

Finally, there has been much discussion about the growth in wealth inequality over the past three decades. Given the importance of student debt in explaining negative household wealth, as seen above, it is likely that the steady growth in student debt and borrowing, combined with the very slow rate of student loan repayment we have documented elsewhere, has materially contributed and will continue to contribute to negative household wealth and wealth inequality. On the other hand, the continued recovery in the housing market observed over the past few years may help households with negative home equity come out of their negative wealth position.

Disclaimer
The views expressed in this post are those of the authors and do not necessarily reflect the position of the Federal Reserve Bank of New York or the Federal Reserve System. Any errors or omissions are the responsibility of the authors.


Armantier_olivierOlivier Armantier is an assistant vice president in the Federal Reserve Bank of New York’s Research and Statistics Group.

Luis Armona is a former senior research analyst in the Bank’s Research and Statistics Group.

De_georgi_giacomoGiacomo De Giorgi is a senior economist in the Bank’s Research and Statistics Group.

Vanderklaauw_wilbertWilbert van der Klaauw is a senior vice president in the Bank’s Research and Statistics Group.


How to cite this blog post

The post Which Households Have Negative Wealth? appeared first on The Big Picture.

26 Jul 06:03

Strategies: What You Think You Know About Money, but Don’t, Can Hurt You

by JEFF SOMMER
Americans are overconfident about their knowledge of money matters, a new study suggests, which could expose them to exploitation by industry pros.
22 Jul 21:56

India’s Dalits strike back at centuries of oppression by letting dead cows rot on the streets

by Harish C Menon
India-Gujarat-Cow-Dalits

India’s growing band of cow-protection vigilantes and their political bosses may have learnt a lesson in the past few days: Bullying can boomerang.

Politics over the cow, deemed holy by many Hindus, has roiled India for years. In recent times, it has turned nasty, with Indians lynching or humiliating fellow Indians on mere suspicion of having killed cows or eaten beef.

In the latest instance, four young men skinning a dead cow, along with another aged person, were mercilessly thrashed by a group of cow-protection vigilantes in Gujarat’s Una on July 11. Stripped and tethered to a car, the four were paraded publicly in Una even as they were walloped for almost five hours. One woman, too, was assaulted. And all the while, despite being approached, the police failed to act.

The victims were members of the Chamaar caste, part of India’s Dalit community, that has traditionally disposed of animal carcasses by using their skin, bones, and other body parts for commercial purposes.

The savagery has caused such anguish that some 17 distraught Dalits have attempted suicide in the western Indian state in protest against the incident.

Others have pelted stones, resorted to sit-ins, and blocked traffic on Gujarat’s highways. “There was also an attack on two state buses in Amreli by a mob of 2,000 men. Nearly 90% of bus trips scheduled in Jamnagar, Rajkot, Junagadh and Amreli divisions were cancelled, affecting the movement of three lakh passengers… In all, 500 protesters were arrested from different parts of Saurashtra..,” The Indian Express reported.

The blowback is evident not just in Gujarat, prime minister Narendra Modi’s home state, but also in other parts of the country, including the Indian parliament.

While protests by aggrieved communities aren’t new to India, this time, Gujarat’s Dalits have decided to show their anger in a rather simple, but disruptive, manner: They have refused to scavenge.

India’s caste system divides the Hindu society into four major levels—Brahmin, Kshatriya, Vaishya, and Shudra, where the Brahmins top the pyramid and Shudras form the unenviable bottom. For centuries, Dalits were forced to abide by clear-cut notions of hierarchy and associated professions.

As sociologist Andre Beteille described the root of the current agitation, “Some people (the Dalits) had to do all the dirty work, so that others could continue with their notions of ritual purity.”

Not anymore, though. At least not in Gujarat, where Dalits who traditionally collected animal carcasses to dispose of them have simply refused to do it anymore. So, since July 11, hundreds of dead bovines have been left rotting across the state, especially in the seven districts of its Saurashtra region, leaving citizens and officials aghast.

If Dalits—untouchables, till the practice was banned 1950—in other parts of the country choose to adopt this method, India may have a severe civic crisis at hand. For, even today, the most revolting of its civil sanitary tasks such as manual scavenging and sewer management are mostly carried out by them.

Defiance is their weapon

“We do all the society’s dirty work. And then we get beaten up for it,” said Hasmukh Karsanbhai Charviah. “So, we have now decided not to take up this job anymore. Why should we?”

By “we,” Charviah is referring to the around 25 carcass-scavenging families of Mota Samadhiyala, his village near Una in central Gujarat’s Surendranagar district. The decision to quit was taken following the June 11 assault on the youths in Una for alleged cow-slaughter. Those attacked were Hasmukh’s cousin Balubhai, along with his son, nephews, and wife.

“They knew we are Chamaars and skinning dead cattle is our job. Yet they assaulted us,” Hasmukh said, narrating the incident. He recalled that some of the vehicles in which the gang arrived sported stickers of the Shiv Sena, a right-wing political outfit allied with Modi’s Bharatiya Janata Party.

The move to strike work has now spread to other parts of Gujarat.

Estimates of how many carcasses are lying unattended are difficult to come by, but the following could be an indication of the scale of the crisis: In Surendranagar’s Limbdi Mahajan Panjrapole, one of Gujarat’s 230 odd cattle infirmaries, there were some 36 putrefying dead animals waiting to be removed by July 21.

“They (officials) have promised to come back in the morning tomorrow (July 22). Let’s see what happens,” said Narendrabhai Shah, trustee of the Limbdi infirmary.

Officials, including the Surendranagar deputy collector, tried to negotiate with the protesters. Persons who attended the negotiations said that when the authorities offered Rs200 per dead cow, the Dalit interlocutors made a cheeky counter-offer: Rs500 for each official who removed one dead cow.

‘Your mom, you cremate her’

Some protesters have chosen to escalate the issue. They have brought carcasses in mini-trucks and tractors and dumped them before government offices. Tweets endorsing such escalation exclaimed: “Your mother, you perform the funeral rites.”

The hint at cow-protection vigilantes, who refer to the animal as their mata or mother, was unmistakable. Across India, such groups—overtly or covertly backed by right-wing political parties—have stalked cattle traders, villagers, and truck-drivers, sometimes even killing them.

In March, two young Muslims, one of them merely a boy of 15, were allegedly hanged by one such group in the northern Indian state of Jharkhand. In neighbouring Uttar Pradesh’s Dadri area, one elderly person was lynched in 2015 on suspicion of having eaten beef.

Though these incidents ostensibly are law and order issues that fall under the state government’s purview as per India’s federal laws, there has been an unmistakable rise in right-wing polemic and resultant violence ever since Modi took charge in New Delhi.

His public indifference to the tumult in his home state hasn’t surprised anyone who had witnessed his pristine silence in the wake of the Dadri lynching. A compulsive tweeter of anodyne season’s greetings and birthday messages—even mistimed ones—Modi has maintained radio silence over Una’s Dalits.

This, even as the groundswell has prompted local and national-level politicians to visit the Una victims.

“He spoke so much about our Gujarat to showcase his achievements. But now, it’s been 10 days since we Dalits have been publicly mistreated and the man we sent to New Delhi hasn’t uttered a word for us,” said Manjibhai Kalabhai of the Navsarjan Trust, a Dalit rights organisation based in Ahmedabad, Gujarat’s capital.

Modi’s BJP is in fire-fighting mode, though. With its long-standing hold on Gujarat seemingly unravelling and an all-important election coming up in Uttar Pradesh, the state with India’s largest population of Dalits, the BJP may be ruing its indulgence in cow politics.

Someone tell the party: You fed the cows, now prepare for the inevitable: dung. Loads of it.