Rolandt
Shared posts
Instapaper Liked: "My PTSD can be a weight. But in this pandemic, it feels like a superpower."
A poster for The Cars performing at the Roxy on August 17, and the Santa Monica Civic Auditorium on August 24 in the Tower Records parking lot, Los Angeles, 1979. pic.twitter.com/XGIxmXkMC2
|
mkalus
shared this story
from |
A poster for The Cars performing at the Roxy on August 17, and the Santa Monica Civic Auditorium on August 24 in the Tower Records parking lot, Los Angeles, 1979. pic.twitter.com/XGIxmXkMC2


40 likes, 13 retweets
Beach Flow on a Friday Afternoon
This is what Beach Avenue looked like at 3 pm on Friday afternoon – May 1:

Here’s the video: Beach Flow May 1
The vehicles and the bikes pass by each other on either side of the cones, about the in same number. They both pass by in informal pelatons – clustering in groups that go about the same speed. Each member feels comfortable, the speed seems right, there’s enough space. That’s flow.
Building in the times of COVID-19
As an engineer, maker, builder, you want to build something during the crisis to help the community.
But what can you build as a software engineer that can help the society during this period of crisis? The answer to the question is not easy, As we have not seen something this devastating in our lifetimes.
In such situations, it's always good to begin with something one knows well. As a software engineer, I can build systems, create APIs and make maps. I will start there, because I am confident of building really good things in those areas. Over time, one will also realize there are other areas that need help, for which one may already possess skills or can be learnt easily. Such areas could be anything from fundraising for the community to cooking.
At that point, you will realize what it means to be a duct tape engineer - an engineer who will apply his skills to fix things when there is no one else to do. Also as they say, best process to build anything is to make it work first, then make it efficient and at last make it the best. Duct tape engineers make it work.
Of course, you may think, you don't have expertise in that field or your time is not properly utilized in the new role. These calls are very important to make. You need to consider if your participation is in fact, helpful and doesn't hurt the cause. Personally for me medical electronics is one such field I won't touch. I am okay with #quantifiedselfing myself but won't touch anything that will be used by others.

Building in the times of COVID-19
Software engineering and data analysis is my field, and I am fairly confident about my skills in that field. Hence my first step was archiving COVID-19 India related data for future use and research. Build APIs for the data, so other researchers can use it.
I have been highly curious about ventilators and reading a lot about their functionalities. But it’s not something that I aspire to build. I aspire to build something that can make it easy to collect and disperse data during disasters such as the Kerala floods or the COVID-19 pandemic.
There are some opportunities for people to get help to build things that they want to. One example of this is IBM’s Call for Code. Call for Code is a global campaign started by David Clark Cause along with IBM. The challenge encourages developers to use their skills to build new technologies or products to drive positive and long-lasting changes across the world. The main focus is, of course, code. This year the focus is on COVID-19 and climate change, disasters that we are currently going through. I hope you find an idea to work on these pressing issues.
It could be a grand project like solving education or work for a post COVD-19 world, or it could be a small but useful project where you can build a chat-bot to dissipate grocery store information. Nothing is too small, and nothing is out of reach.
If you are not a software engineer, don't worry, you can still participate, as a designer, as a user or as a community manager1. Also, learning to code is also not that difficult. It is much easier when you are in a team. So find that team.
At last check these resource materials on COVID-19, that I like :)
- DataMeet COVID-19 India data
- CallForCode COVID-19 resources
- Covid19india.org
- OurWorldInData
- Hackaday COVID-19 posts
- WHO
- Coronavirus Disease Research Community - COVID-19 at Zenodo
- COVID-RHR Hub - Family Planning & Reproductive Health Community-Contributed COVID-19 Resources
- All projects, software or not, need great managers. Any good manager is a community manager. ↩
Taking Credit When Things Go Well
Some communities right now are seeing a surge in participation.
You might be tempted to take credit for that.
You’re working hard after all, isn’t this just your hard work paying off?
However, if you take credit for a surge, you’re also going to take the blame for things when they go back to normal (or below normal).
The reality is you can influence participation, but probably not by as much as you imagine. Many surges or declines are caused by factors beyond your control (releasing new products, time of the year, the success of your organisation’s marketing efforts etc..).
It’s far better to not be measured by the quantity of participation, but the outcome of that participation.
'Expert Twitter' Only Goes So Far. Bring Back Blogs
Speaking as a long-time blogger (not just this newsletter, but also my long-running Half an Hour blog, my Let's Make Some Art photoblog, my more recent Leftish political blog, and of course my articles) I can say that blogs never left, and we don't need to 'bring back blogs'. What left were the readers as by the millions they chose to favour the quick snarky come-back over more detailed discussion. What will bring readers back to blogs? Good question.
Web: [Direct Link] [This Post]another 30 days of biking
Rolandt`
30 days of biking is a movement to promote biking by encouraging people to bike every day in the month of April. Here’s my ride log for the month.

In this time of COVID-19, my riding habits have been disrupted. Usually, the great majority of my mileage comes from commuting to downtown 5 or 6 days a week. April 2019 I logged 78 rides for a total distance of 544 km. This past month I did only 47 rides for a total of 632 km. I’ve been making up the loss of commuting by doing two or three longer rides a week.
I’m fortunate that my current work schedule is flexible enough that I can occasionally ride during normal working hours. This lets me avoid the crowding on places like the MGT. Most of my weekday rides have been out to Port Credit.

I do take the Lakeshore trail out to Norris Ave, but it is not too crowded during working hours. The rest of the way is along Lakeshore, although I take two bypasses: from 3rd Ave to 30th along Birmingham and Elder, and a second section in Mississauga from Haig Blvd to Stavebank along Atwater/Mineola. There is a nice little loop of 3.3 km at the end that I can add if I feel like it.
On my Port Credit ride this afternoon, I saw these officers riding up Ellis Ave. Since the city has closed High Park, they were riding the park perimeter. I asked how many laps they were going to do, and they said “a lot”.

On weekends, I’ve been riding to Tommy Thompson Park. To avoid crowds I ride across town from High Park on either Bloor/Danforth and down Jones and back up Logan, or I cut across on Gerrard once I reach the downtown area. Traffic has been light, and I get to avoid the Queen’s Quay section of the Martin Goodman Trail.

Even with these 40-50 km rides, I’m not going to be able to match my total annual mileage from past years since I won’t be doing any longer rides with TBN. Still, it’s nice to be able to get out and about while maintaining proper social distancing.

On why I love libraries so much (an ode to librarians, libraries, and library science)
I love books, I love reading, and I absolutely, completely, entirely adore libraries. I would have become a librarian had this been much more of an option for me at the time I was choosing careers.

There are few things that lift my spirits as much as seeing photographs of libraries across the globe. Probably just as much as actually being in one, or reading a book. Over on the Twitterz, I requested that my followers send me photos of libraries they might possibly have in their archives.
People: if you have stored photos of libraries can you help a brother out? Tweet then at me!
— Dr Raul Pacheco-Vega (@raulpacheco) April 22, 2020
I am a polymath because my parents always instilled in my a love for reading and knowledge. We always said that the family’s guild was going to be “education”.
And it definitely is.
My late auntie was a teacher. My Dad is a lawyer who taught in law school. My brothers and I all tutored learners since we were very young. I was 11 when I started teaching literacy programs in gang-riddled territories. How my parents gave me permission is beyond me.
My parents and auntie were always avid readers so their personal libraries have always been huge. When I was 12 I learned Dewey and Library of Congress classification schemes. I know how to calculate Cutter numbers. I’ve had a library card since I was 6 years old.
I classified my parents library and set up a home loan system. At 13. I have always loved reading and learning. Anybody who has been to my house and/or my CIDE office knows how much I love books (and reading them). I dreamed of becoming a librarian, studying library science.

I quite clearly remember my parents’ face when I said I wanted to be a librarian:
“Will there be enough jobs in the world of libraries and will there be enough libraries to give you a job?”
I became a chemical engineer instead. But my love of libraries has never even remotely faded. Because I’m a professor now (and I’m single and childless with no pets) I can now buy books with abandon. Sometimes book publishers send me free books. I give them away to libraries. Many books of mine have ended in the CIDE library collection. I also support public libraries and regularly donate books to the several ones I frequent here in Mexico.
Because I study comparative public policy using ethnographic methods (and I get invited to give talks and workshops across the globe), I get to visit hundreds of libraries.

Being inside a library is a huge balm for my soul. I love teaching, I love educating, I love learning. And I love books and libraries. Because we are all house-bound, I needed an emotional pick me up by looking at libraries across the globe (many of which I’ve visited already). Thanks to my Twitter followers for feeding my soul.
May I be able (when this is all over) to come back to my hometown (Vancouver) and give away physical copies of my books as a token of gratitude for all your help. Thanks, librarians across the globe. I’m sure you miss your collections & your readers too. Sending love.
Ten BART observations
(inspired by Buster Benson’s goal of using BART time for writing)
1. Cheaters. The guys who hover while the train pulls on to the platform and then casually shoulder their way past the queue of people to push to one of the remaining open seats.
2. Addicts. The quick visual scan to confirm that 4 out of 5 commuters surveyed prefer their handheld computing device over anything else.
3. Preparers. The carried coats that were worn on the way in this morning when the summer fog was dense.
4. Ventriloquists. The conductor routinely announcing the transfer point at 19th Street Station, and the woman standing holding on to the strap mouthing the words along with him.
5. Eavesdroppers. Listening to the conversation happening right next to you and hearing the words but not really putting them together into a coherent set of sentences.
6. Pushers. The shuffle when the car is full and a passenger buried in the middle needs to push their way through and starts to panic, mildly, when they fear they won’t make it out before the doors close on them.
7. Addicts, part 2. The palpable sigh of relief when cell coverage is stronger coming out of the tunnel and iMessages start flowing and pulls refresh again.
8. Avoiders. Not making eye contact. Ever.
9. Fans. The three guys who are flushed red from the afternoon sun and the post-game drinks, and hoarse from rooting for their MVP pitcher.
10. Toe tappers. The anticipation of yours being the next stop.
Ten BART observations was originally published in stating the obvious on Medium, where people are continuing the conversation by highlighting and responding to this story.
How Many Dead + Who’s Social Distancing
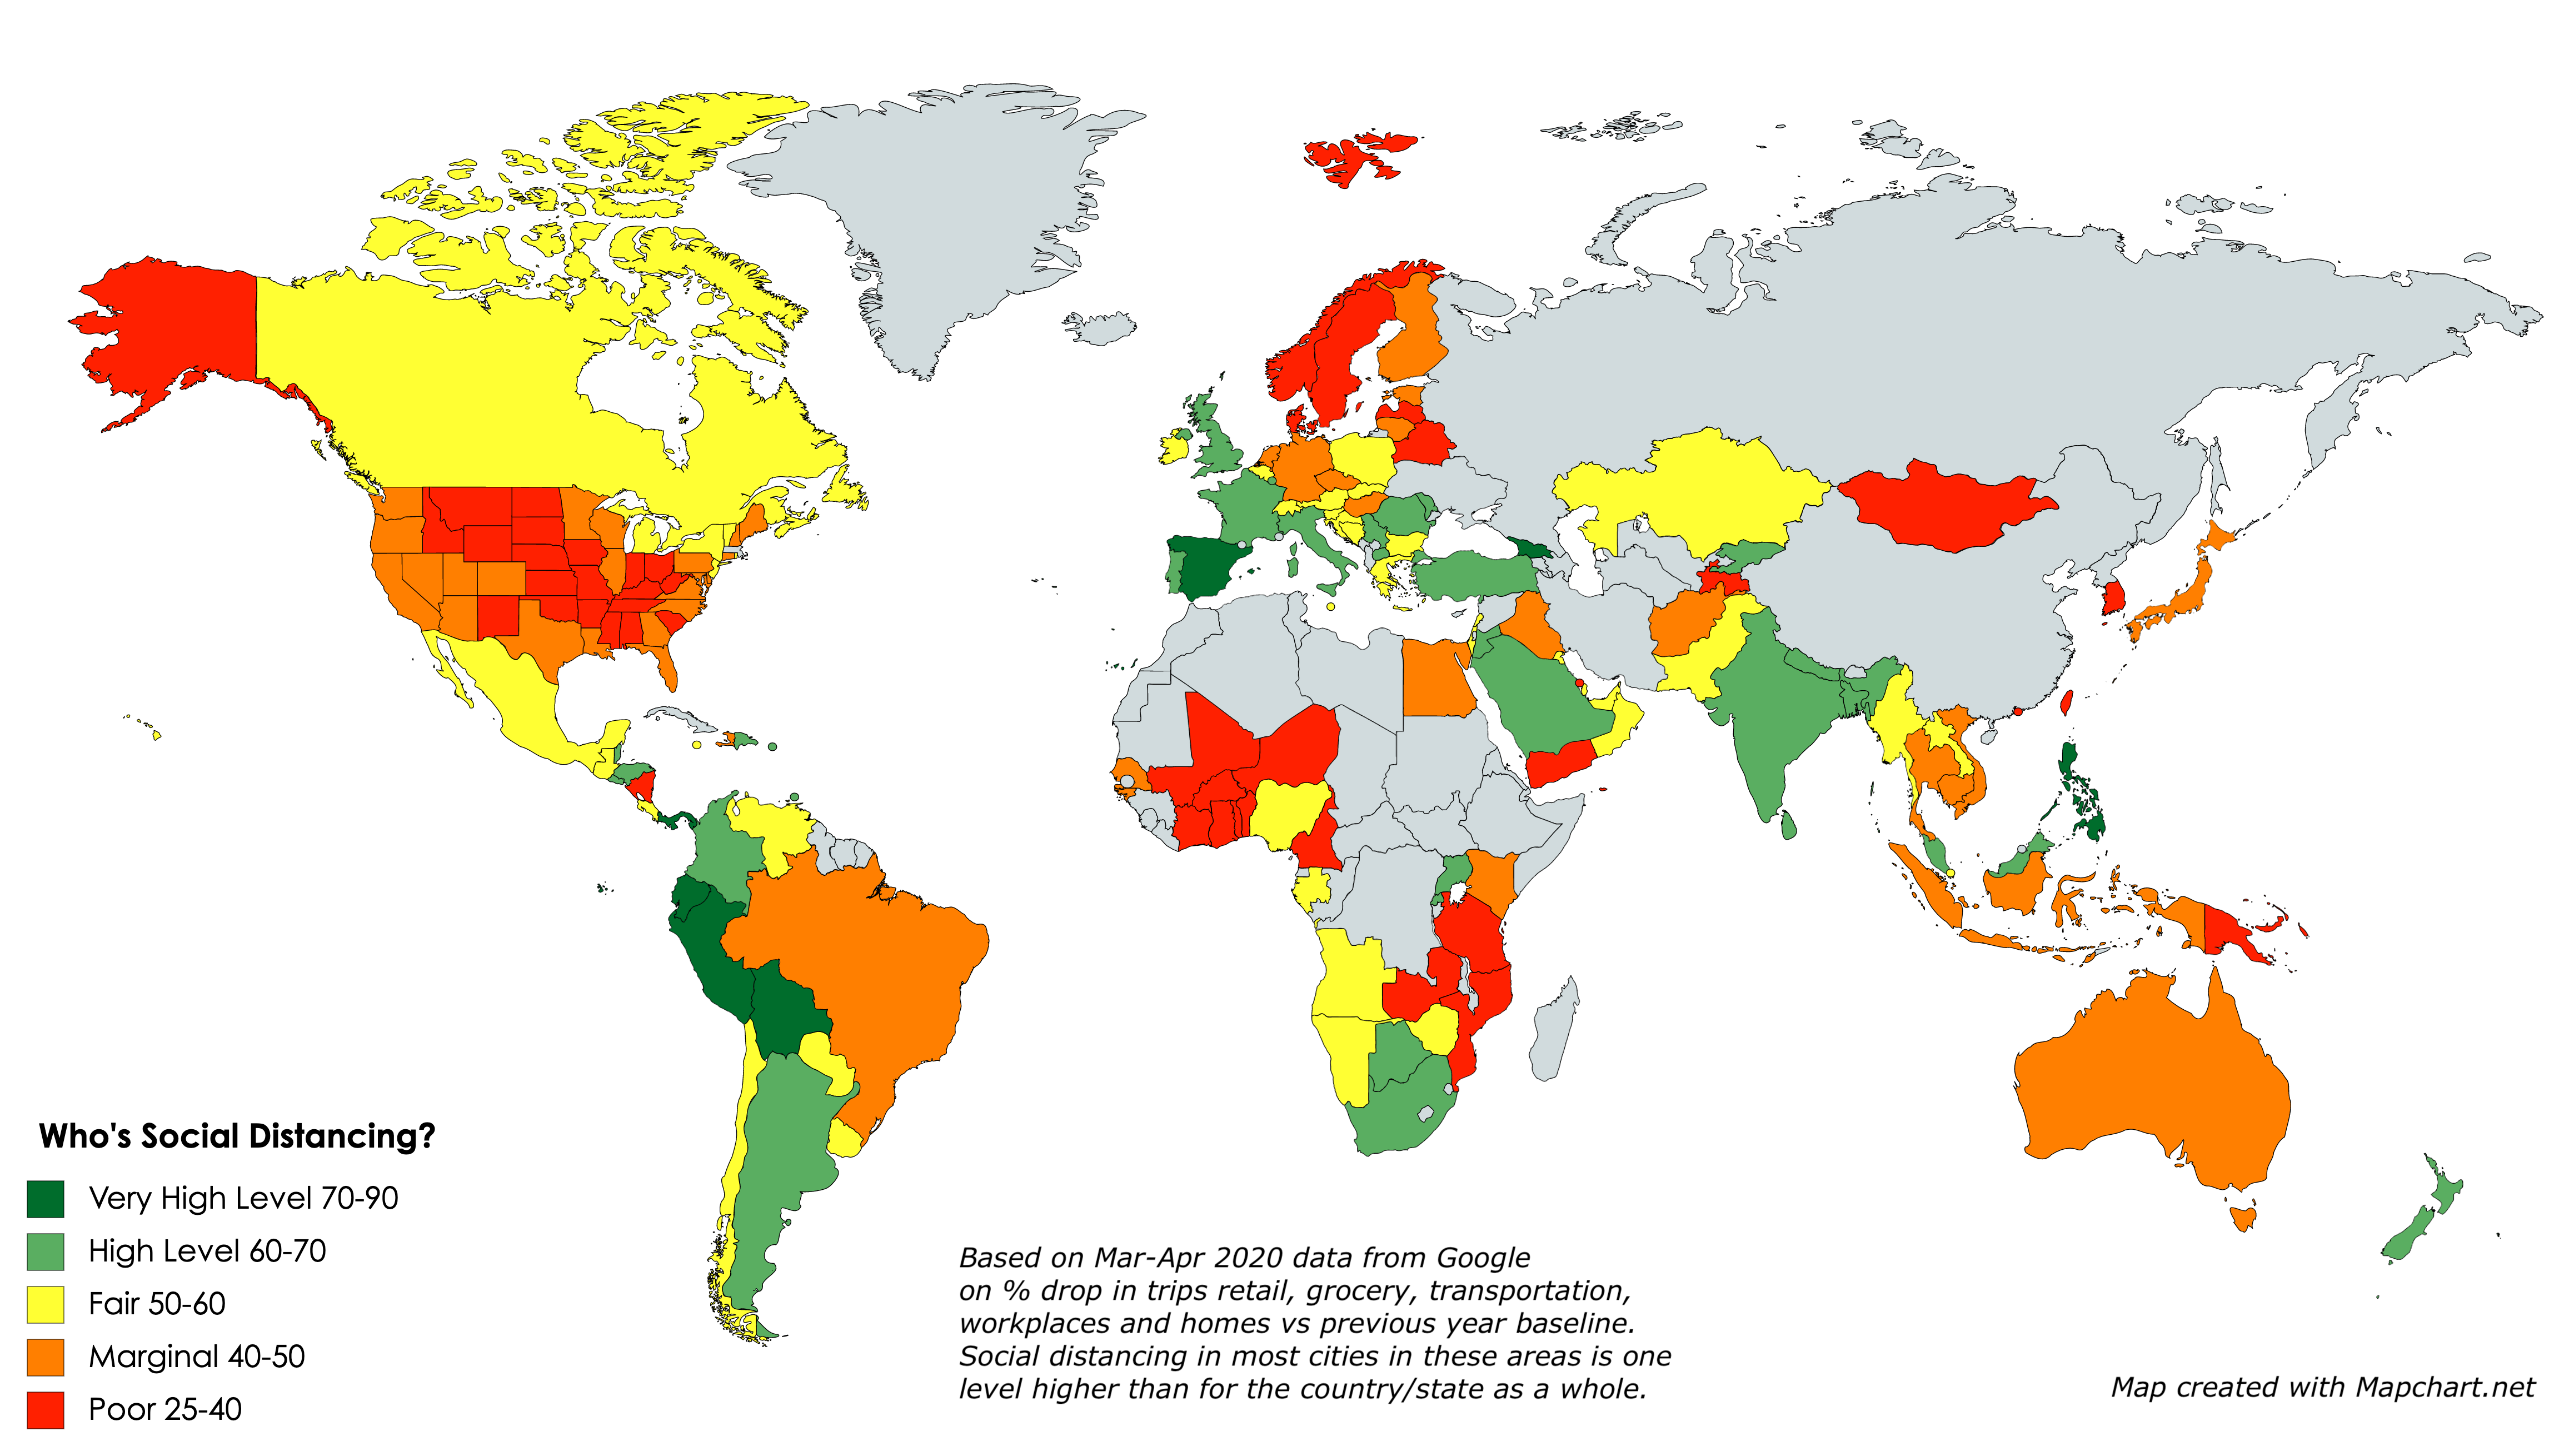
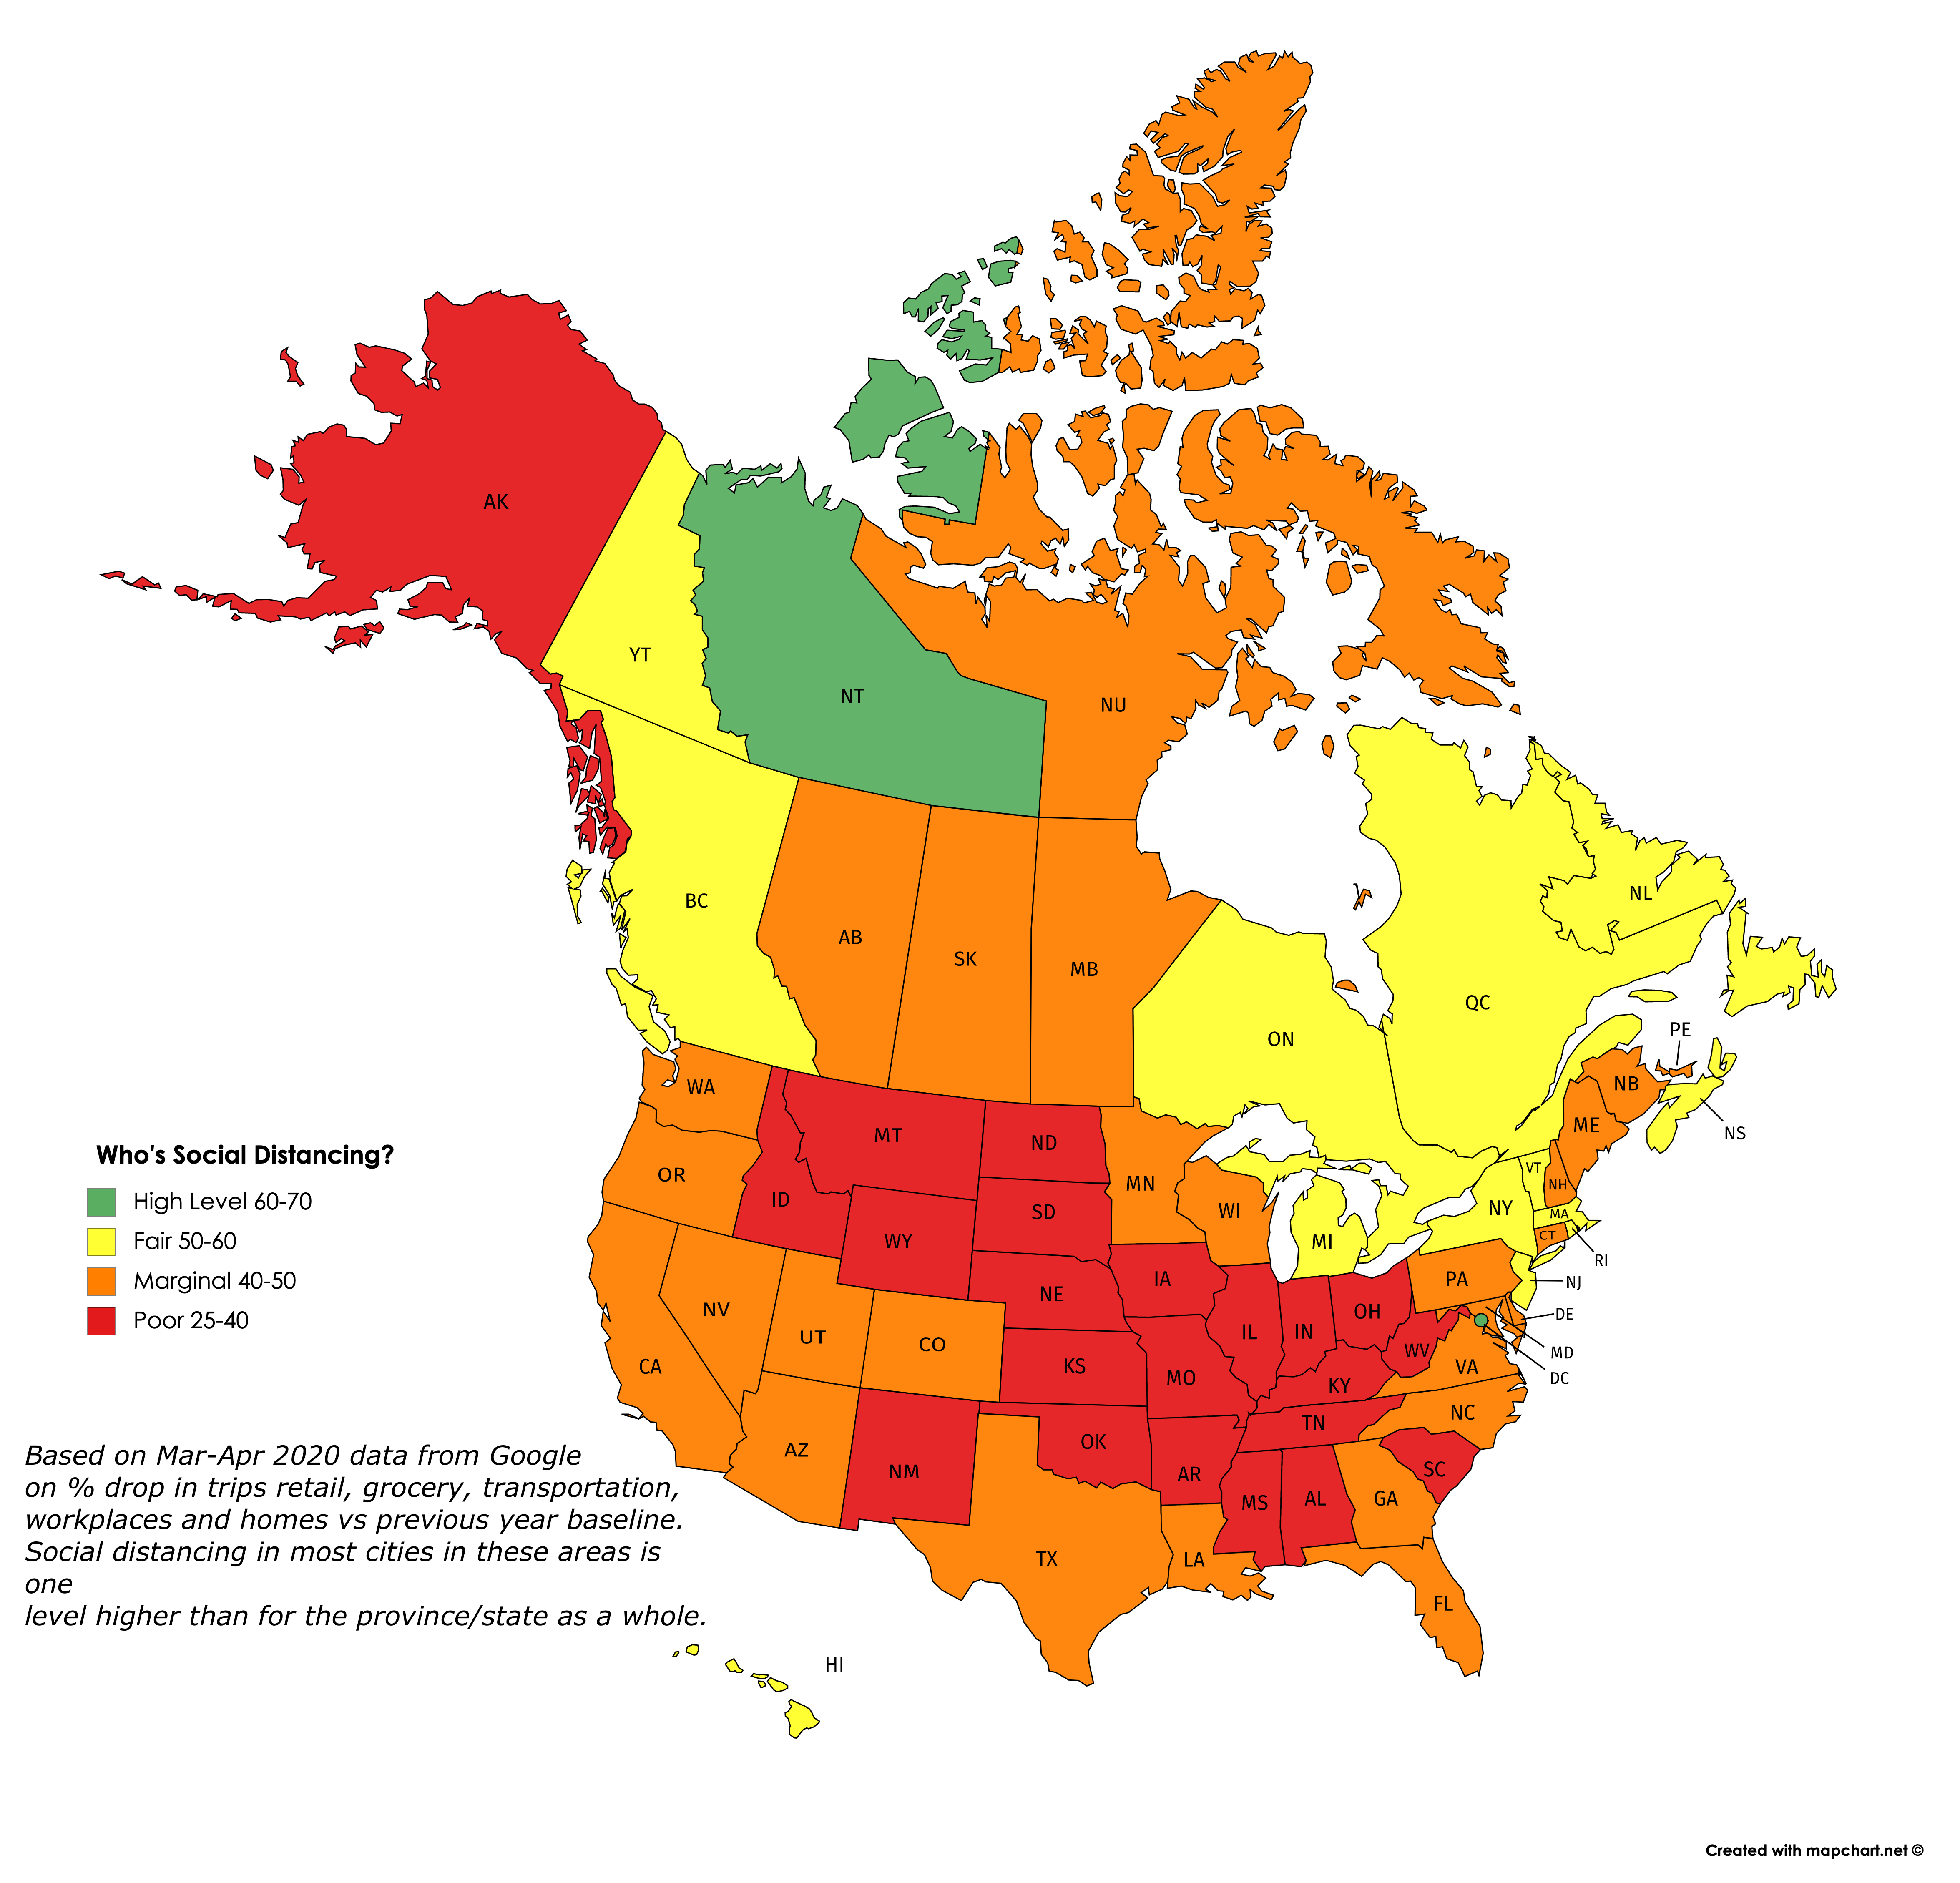
Maps created by me using the mapchart.net application. Click on images to view/download a larger version.
Google has just released a mass of downloadable data on how sharply visits to retail, grocery, transportation, workplaces and homes have dropped off in March and April, versus the baseline average for the same time periods in past years. I thought I would map it to show which countries, states and provinces are seemingly doing the most social distancing right now.
So this is what I did: I averaged the drops in these five categories over the past seven days, giving a lower weight to home visits than the other four categories. (Google also shows data for visits to parks, but I chose to exclude them.) I converted the averages into an index that shows roughly how large a % drop there has been in social activities in the last week of April, compared to a typical last week of April, the difference being due presumably to CoVid-19 restrictions.
What the maps tell me is not who’s conscientious and who’s not about social distancing, but rather how hard each area has been hit by the pandemic and how much they are therefore as a result willing to endure and sustain social distancing. So no blaming or shaming here: The fact that the Andean countries in South America have shut down so completely suggests (as the excess deaths data confirms) that everyone in these countries is aware of how many are dying all around them and hence how dangerous it is not to social distance. Likewise the low rates of compliance in the “red states” of the US reflects that they have not (at least yet) been hit in any highly visible way by the pandemic. The hardest-hit countries and states are, for the most part, continuing to do the most social distancing. And generally, they are the most densely-populated and mobile populaces. Each exception — such as California, Scandinavia, South Korea, Japan, Taiwan, Hong Kong, Australia and New Zealand — has a unique and important story to tell us.
Also worth noting is that cities tend to be one full category (10 points) higher in terms of their social distancing score than the rest of the country/state/province in which they’re located, probably for the same reasons. And for some tourist destinations, the drop in activity may be due as much or more to a decrease in visitors as it is to social distancing.
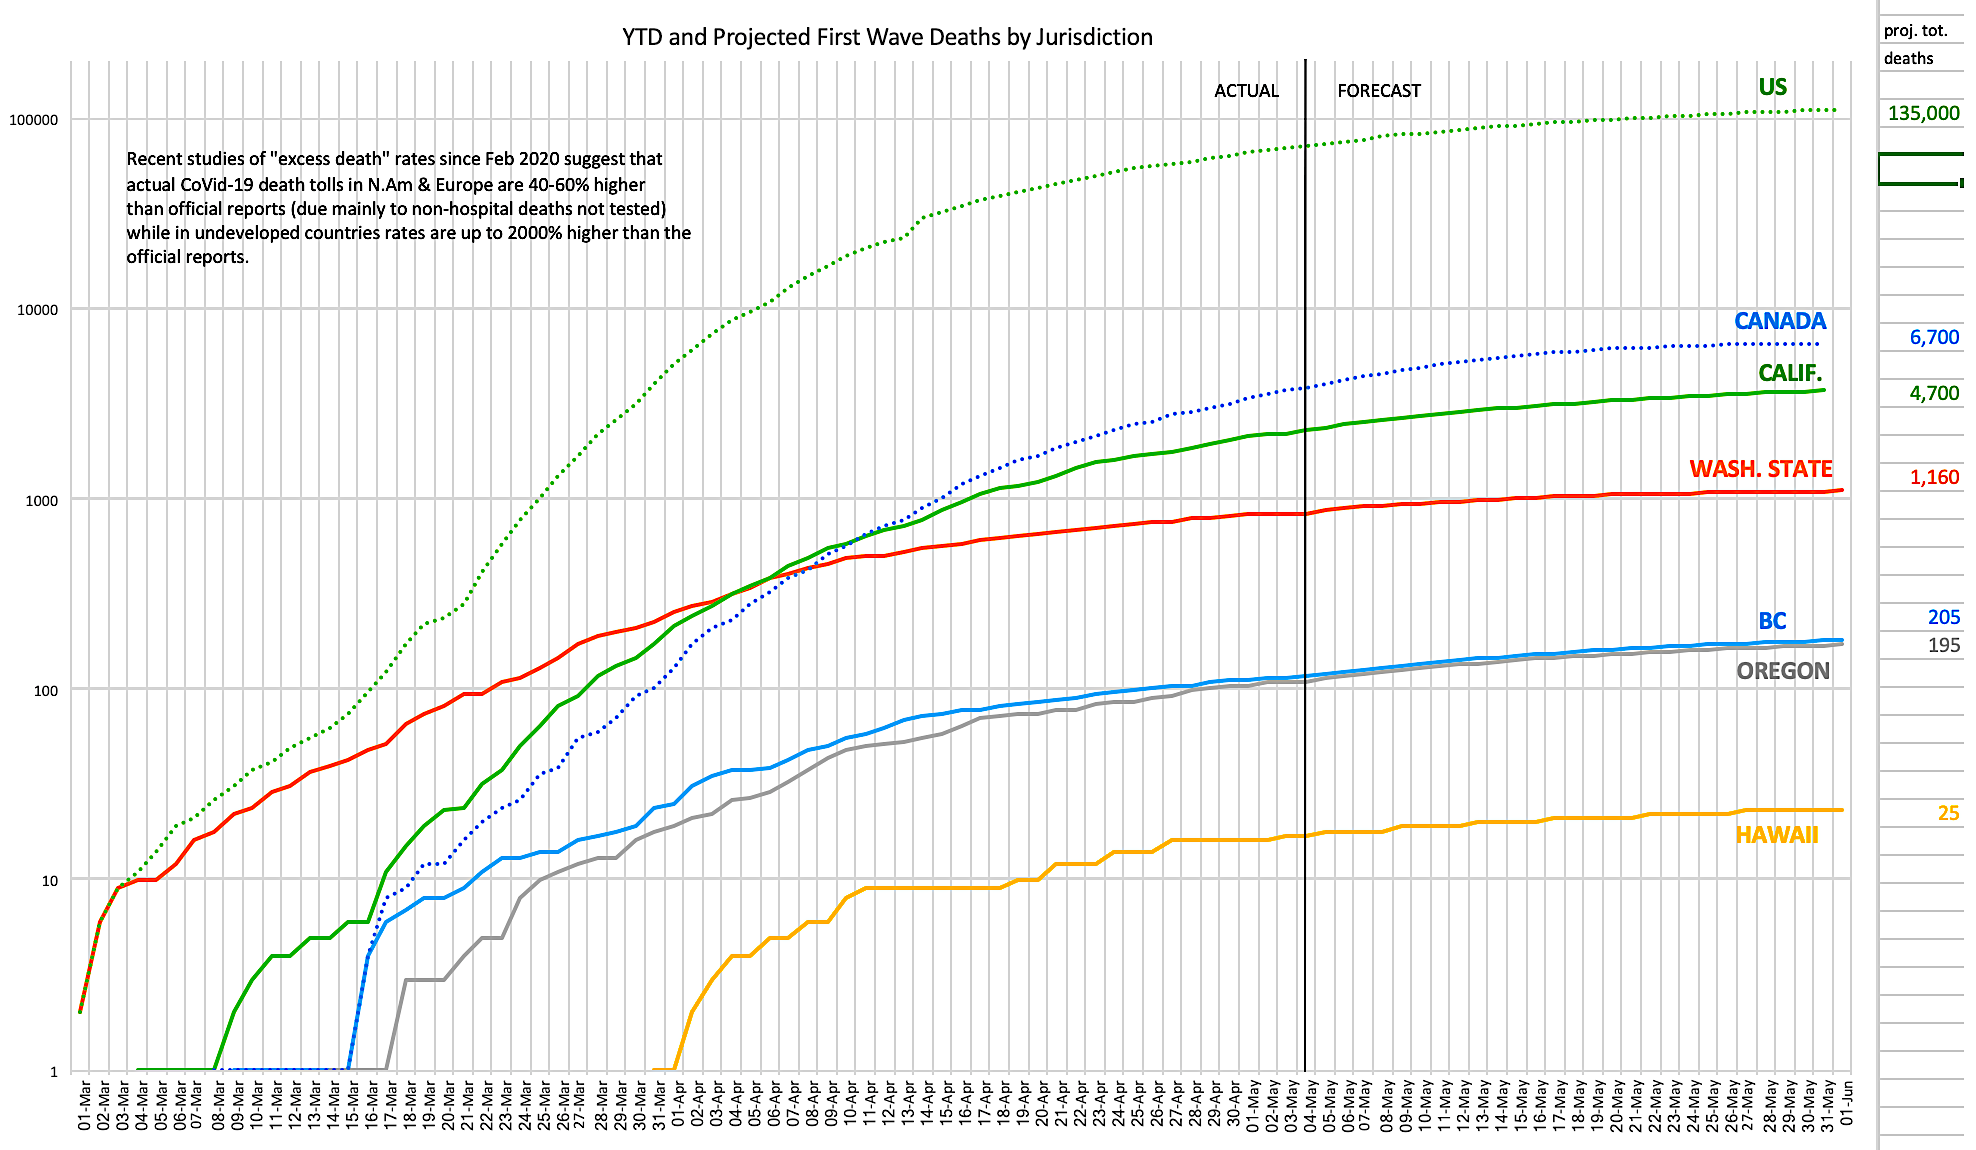
The chart above (click on it to view/download a larger version) [EDIT: Updated with new UW projections May 4th] shows daily reported and projected first wave CoVid-19 deaths for North America and West Coast states and provinces as at April 30, 2020. Data is from a variety of sources including the nCov Dashboard, Johns Hopkins, virusncov, wikipedia and local health departments and media reports. Projects are per the UW/IHME model downloadable data, adjusted when the forecasts for the past three days have been off by more than 30%.
The problems with these data are manifold:
- There’s often a long time lag between date of death and reporting the death in the daily reports — an average of 4 days in countries with well-developed reporting, and much longer in struggling nations.
- Some regimes are politically motivated to suppress data and find other explanations for deaths.
- The research on “excess deaths” (number of March/April 2020 deaths versus the average in the same months in recent years) in many jurisdictions suggests that, principally due to lack of testing capacity and the exclusion of many/most deaths outside of hospitals (even if the coroner’s report lists CoVid-19 as a probable cause), actual death rates attributable directly or indirectly to CoVid-19 are likely between 40-60% higher than reported in developed nations, and as much as 1500% higher than reported in struggling nations (in parts of Ecuador and Indonesia, for example, “excess deaths” are about 15 times the official CoVid-19 death totals, likely for the above reasons).
- It is impossible to ascertain how many “excess deaths” are attributable to very sick non-CoVid-19 patients’ inability or willingness to go to overburdened hospitals and therefore dying needlessly or prematurely of other causes at home.
- It is also impossible to ascertain how many accidental deaths have been prevented due to workplace shutdowns and less driving during the pandemic.
But taking all the above unknowns together, a best guess might be that instead of 250,000 deaths to date (the current official total), the actual toll is likely closer to a million deaths to date, and that (if the models pan out) the final real death toll will be between two and three million — and that’s just the first wave. Some European models suggest that over the next 2-3 years, as additional waves hit, some of which may occur simultaneously with the “normal” influenza annual peaks and hence create further hospital capacity crises, the total number of deaths from CoVid-19 could be several times larger again, before an effective vaccine is available.
It is also possible that contracting the virus does not confer immunity from reinfection or reactivation (reactivations are serious infectious flare-ups of the disease in people who had the disease but recovered and were no longer testing positive, until perhaps months or years later falling ill from it again or at least testing positive for it again). That would mean that the antibodies produced on initial infection might not be sufficient to protect the person from getting the disease again.
And that’s to say nothing of the risk of mutations, like the one that killed tens of millions of mostly young healthy people in the latter part of 1918, after the initial spring strain had killed only a few million mostly old people and the virus was considered under control.
It seems increasingly likely that the 0.2% first wave mortality rate I cited in my last article is closer to the true rate than the 1-3% mortality rate initially feared. [EDIT: May 14th: Now it appears the mortality rate is closer to 1.0%; see follow-up here.] If the actual first wave death total is, say 2.5 million, then that means 1.2 billion people (2.5 million/0.2%) will have been infected, or about 1/6 of the global population. Even if that 1/6 of the population does develop immunity from reinfection and reactivation (which is far from a sure bet), then the remaining 5/6 of the population will remain vulnerable to additional waves until and unless an effective, affordable, universally accessible vaccine is developed. This is far below “herd immunity” levels.
The actions that governments, health authorities and citizens would be best to do now were listed in my previous CoVid-19 posts.
EDIT May 2: We still don’t know how CoVid-19 kills us. (Great read about more of the uncertainties and mysteries of this virus; thanks to Tree Bressen for the link.) One of the ironies of this disease is that it’s been so hard to recognize because of the wide variety of symptoms that many (perhaps as much as 40% even in Europe and North America if the “excess deaths” studies pan out) of the people who have and will die from this disease had no idea they had it, and probably never will. That means that probably 100,000 Americans (not 66,000 as currently reported) and 5,000 Canadians (not 3,400 as currently reported) and a million people worldwide (not 250,000 as currently reported) have probably already died from the disease — and the only reason hospitals haven’t been overwhelmed as was feared if numbers got this large is that half of them never even tried to make it to the hospital (their symptoms didn’t match, or weren’t severe enough, or were masked by other pre-existing conditions). Something for the modellers, and the epidemiologists, to think about.
Client CPU and GPU Performance for Jitsi and BBB Videoconferencing
While I wouldn’t use Zoom for private video conferencing, I do use it for public conferences (on a burner notebook…) and noticed that their Linux client program is very resource optimized. Even when showing a dozen videos and piping the local video camera stream into the cloud, CPU processor load on my Thinkpad X230 notebook from 2013 is around 30-40% over all cores with Ubuntu 18.04. Compare to that to the 100% load across all CPUs when using Jitsi or BBB in Chromium when 8 videos are shown and one video stream sent to the centralized server. This made me wonder a bit if the load on newer notebooks is lower.
I get the same 100% CPU load from BBB and Jitsi in Chrome on my Thinkpad X250 notebook from 2015 that has a 5th generation Intel “i5-5300U CPU @ 2.30GHz” and I use it with Ubuntu 16.04 and the built-in GPU for video conferencing. Perhaps this has something to do with the higher screen resolution of 1920 x 1080 pixels compared to the X230.
On my Dell Latitude 5580 I also run Ubuntu 16.04 and the screen resolution is also 1920 x 1080 pixel. It is a bit newer and has a 7th generation Intel “i5-7300U CPU @ 2.6 GHz” inside and also uses the Intel GPU for graphics. On this machine, the CPU load with 8 videos is 65-70% on all cores. This means there is still enough headroom to run other applications quickly. How interesting.
So far, I had the impression that there there were only small performance increases across processor generations. I can’t really say if the better performance stems from the newer CPU, from the better GPU or from better Linux drivers for the newer CPUs/GPUs cores. But whatever it is, it makes a significant difference!

brucesterling: *I’ve got mine. “Take away the elements in...
*I’ve got mine.
“Take away the elements in order of apparent non-importance”
Someone sent me a pdf of the card set.
COVID-19 Futures, Explained With Playable Simulations
This guide (published May 1st, 2020. click this footnote!→1) is meant to give you hope and fear. To beat COVID-19 in a way that also protects our mental & financial health, we need optimism to create plans, and pessimism to create backup plans. As Gladys Bronwyn Stern once said, "The optimist invents the airplane and the pessimist the parachute."
So, buckle in: we're about to experience some turbulence.
This is a phantastic resource. Take you time to read and understand what is going on in the world. It will help you understand the plan to get out of this mess and why you don't need to trust Apple and Google.
[Thanks, Olav]
So I went outside and we’re all wearing masks now
I went out in public this morning for the first time in about four weeks, and tons of people are wearing masks. (We’re fine but our household has been isolating all that time: first after an encounter and, just as that stint ended, the toddler had an unexplained fever.)
- We don’t have any masks (yet) so I ad-hocked a winter buff. Not ideal, it made my glasses steam up. Breath is hot!
- It was immediately shocking to see people who were not wearing masks (a minority only). Specifically I noticed in myself a feeling of anger at their selfishness, or anger as if they were deliberately attacking me, or perhaps I felt that they were freeloading on the carefulness of others – and whether valid or not, that anger is a feeling to keep an eye on, because I imagine a lot of people are feeling the same, and society-wide feelings of anger can quickly become invisible, unquestionable, and manipulated by those in power.
- I can’t see us going back to not wearing masks.
- Young people in particular seemed less likely to be wearing masks (by “young” I mean the under 30s, OK boomer…) and those same people were also more likely to be casual with their social distancing. The generational discrimination of this disease is so stark: if you’re young, you’re much less likely to get seriously ill, you’re less likely to know someone who has gotten seriously ill, and your parents are probably younger than the 70+ danger zone. Covid must be so abstract for them, primarily an economic problem, but day to day they feel immune and immortal.
- Another group less likely to wear masks: street cleaners and delivery drivers. Lack of masks supplied by work? Or is it choice… does continuous exposure to the risk just produce a sense of resignation? Or do they feel (fairly) that, as essential workers, their permission to remain unmasked is what society is “buying” with social distancing?
- Another group less likely to wear masks: runners and cyclists. Come on guys (it was all guys), it’s mid morning, it’s busy out.
Two other things:
It’s hard to see and show emotions in a mask. A thumbs up or a yell of thanks is easy enough, but how do you walk down the street and look friendly and approachable? Or at least, 1.8m approachable.
Avoiding people is weird. You step out into the street, or wait for them to move along, but in terms of proxemics it’s very unusual to take such care to keep another person at a far-social-almost-public distance. 6ft/1.8m is outside the comfortable conversation distance of 1.6m. So I’ve a hunch that what happens is that you take the evasive action, and then afterwards you feel a flush of the emotion that would usually precede it – a vague sense that the person needs to be avoided, classic post-rationalising confabulation. Then I catch myself treating the other person in a way that is consistent with that emotion, like it would be somehow hypocritical to first steer clear of them but then give a friendly hello.
But maybe these two points are connected? A mask means the smile isn’t seen and actually it’s harder to make too: the mask holds my face in place, just a touch. And maybe a smile not made is also a smile not felt?
Masks
Keith Johnstone‘s Impro is a book of theatre techniques based around improvisation and when I read it in 2008 I found it life changing. This summary on Ribbonfarm is a decent taster.
The first three chapters are called Status, Spontaneity, and Narrative Skills and they’re great but also they make sense.
The third chapter is called Masks and Trance and reading it is an unsettling experience, in the Lovecraftian sense of there being infinitely more to the world that we know or, for that matter, could handle.
The reason why one automatically talks and writes of Masks with a capital ‘M’ is that one really feels that the genuine Mask actor is inhabited by a spirit. Nonsense perhaps, but that’s what the experience is like, and has always been like.
And:
A Mask is a device for driving the personality out of the body and allowing the spirit to take possession of it.
It all sounds unbelievable until you try a Mask, and allow yourself to let go just a little.
How to do it:
… make your mouth fit the Mask and hold it so that the mouth and the Mask make one face.
Here are some of my favourite quotes.
I have a vague and hand-wavey rationalisation of the Mask… we’re social animals, and when we change the way we’re seen and interacted with, that reflects back into the psyche, blah blah blah.
But the fact remains that wearing a Mask is a terrifyingly powerful experience - seriously TRY IT - and actually a pretty good shorthand to talking about what’s going on is to simply say that, yes, these inanimate objects carry their own personalities, and, yes, when you wear one, that personality possesses and changes you.
So like I said, I went outside today, and it turns out a ton of us are wearing masks now.
And I wonder, what personality does a mask/Mask have when it’s
- a tight, shaped mask and it fits round your cheeks, hardening the face,
- or a homemade-from-a-t-shirt mask that makes your breath short and hot, and smiles are there but hidden,
- or a medical mask that advertises status and authority to all around, unearned,
and how do those spirits possess the wearer? And what happens to a community when, almost overnight, these personalities come into the mix?
And what about the Twitter mask, and the Facebook mask, and the email mask, these other masks we wear online which hide our faces and possess us with their spirits? How might we notice them, and how might we describe them, and what do they do, and who do we become?
This is good news, the .org register will not b...
This is good news, the .org register will not be sold to a for-profit entity, putting a monopoly in their hands. A half year ago I wrote about the odd and also suspicious sale about to happen. It seems the California Attorney-General had some bearing on ICANN’s decision. What stands out is that there’s still not much clarity about why Internet Society thought this would be a good idea, or how to explain away the whiff of collusion (former ISOC board members were involved in the company aiming to buy the register). What also stands out is that ICANN took a mighty long time to respond to the issue, but days after a prosecutor adds their opinion comes to the conclusion to halt the sale. Either way, only if to reestablish some trust amongst .org domain holders, the ISOC board as well as PIR board have a lot of explaining to do at the very least, and need to step down after that explanation. The next boards coming in will need to change their statutes to ensure the .org registry is always run by a non-profit. Running a registry is a de-facto monopoly, how you can ever think it will be fine to leave that to an investment vehicle that on top of that finances the buy with debt, is beyond me.
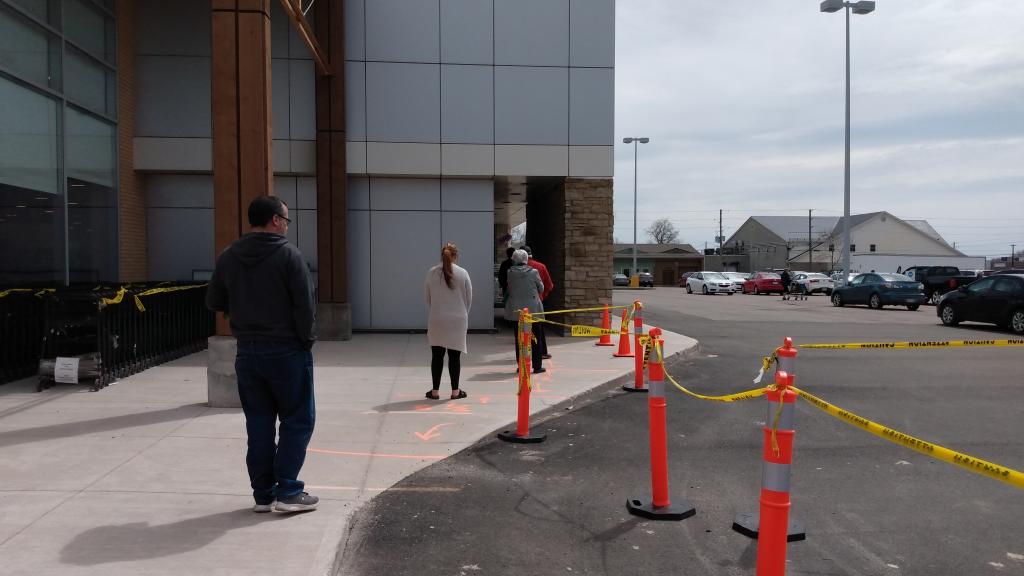
The Davie Queue Lane
|
mkalus
shared this story
from |
 We’re going to need a list of descriptors for the different kind of lanes that are being improvised to respond to pandemic conditions.
PT has been reporting on the changes to Beach Avenue (right), where half the avenue is for bikes of various kinds and the other half for west-bound motor vehicles. The former gives room for three different lanes, allowing cyclists to sort themselves by speed, with each having room to flow. Hence the coinage: ‘flow street.’
Some residents have simply used their narrow residential rights-of-way for a variety of users in what would otherwise space devoted to motor vehicles. Often, they’re designated as a ‘bikeway’ or ‘greenway’.
And now we have ‘queue lanes.’ Here’s the one spotted on the north side of the 1200-block Davie:

When I first saw it, I thought perhaps it was designed as a drive-through lane for grocery-story pick-ups. And in a way it is, only for West Enders queuing as they wait their turns to enter the store. Before. there just wasn’t room on the sidewalk even under normal conditions, much less a requirement for distancing. This solves the problem. Price: about a dozen on-street parking spaces. (Imagine if proposed for West Van.)
I probably wasn’t the only one confused about its purpose when I first saw it without a queue. Indeed, it was empty while the sidewalk remained crowded, even though space for walkers was available on the other side of the curb. But a century of conditioning has ingrained in us that the space beyond the curb is only for vehicles to park or drive. Pedestrians are initially reluctant to use it unless given permission and instructions.
That’s social engineering in action. That’s Motordom.
Postbotin ruiniert TikTok Video
"You're going the wrong way..."
There will come a time when I don’t document every trip to Sobeys for groceries like it’s a polar expedition. We’re not there yet.
Yesterday, 14 days since my last visit, I made my way up Prince Street midday; I could have taken my bicycle, but I’m not quite ready for that yet, so I took the car.
On arrival I found a line of about six people waiting to get in the store; the line moved quickly: it wasn’t more than 5 minutes until I was inside.
Perhaps because it was the first day of “Phase 1” of the province’s Everything Will Be Okay, Eventually, Really plan, there was a disquieting devil-may-care attitude in the air, with some of the social distancing rigour I’d seen in previous weeks now missing. I was very disciplined, waiting my turn and not passing anyone in the aisles; more than once I heard people piling up behind me whispering “I think he’s waiting for the person in front of him.”
That said, I witnessed many more people wearing masks—about 15% of shoppers, I’d guess—than my previous visit.
Witnessing several incidents of clear distancing protocol breaches, against type I finally broke down and told the oblivious person coming the wrong way down the pizza & juice aisle “you’re going the wrong way.” They’d had no idea, and quickly wheeled themselves around with an apology.
The home-baking trend is obviously still on, as the store was empty of all but Speerville whole wheat flour; everything else was in stock, though.
The rest of the shop was uneventful. I should have taken a list, as the background panic vibe, combined with a feeling that doubling back was ill-advised, caused me to forget a few things. We’ll do without.
E-bike rider loses court case against ticket for operating without licence, insurance
| mkalus shared this story : | |
| Yes, thank you. Now can we change the MVA to actually reflect that? |
A man in Metro Vancouver who was fined for operating an electric scooter without a licence or insurance has lost his appeal in B.C. Supreme Court, even though the province's insurer doesn't provide coverage for that type of vehicle.
Ali Moussa Ghadban argued in court that his Motorino XMr is a motor-assisted cycle — outfitted with pedals, limited power and a maximum speed of 32 km/h — and under B.C. law doesn't require a driver's licence or insurance to operate. But a judicial justice disagreed, and a B.C. Supreme Court judge recently upheld that decision.
"It's frustrating," said Ghadban's lawyer in the case, Brandon Moscoe.
Ghadban had tried to to insure the Motorino at ICBC, Moscoe said, but the provincial insurer doesn't offer coverage for that type of vehicle. In 2019, a man in Saanich, B.C., had the same fines dismissed for that reason.
But in this case Justice Robert W. Jenkins said the Motorino is not a motor-assisted cycle because the pedals don't propel the engine and the vehicle can operate without them.
"A Motorino XMr does not comply with the intent of the legislation, which was for a [motor-assisted cycle] to supplement or assist the human power required to pedal the vehicle," Jenkins wrote in his decision.
Moscoe says the decision highlights the ongoing challenges with electric scooters and other electric transportation modes, as well as the need to update provincial legislation that applies to them.
All about the pedals
According to the decision, Ghadban was riding his Motorino XMr in Surrey, B.C., in July 2018 when an officer issued the ticket..
On its website, Motorino describes the XMr as "all the fun of riding a motorcycle" with "all the advantages of a Motor Assisted Cycle ... classification (no licence, no insurance, free parking)."
The decision says the officer testified that he saw a man riding what he believed to be a "small motorcycle" who hopped onto the plaza at King George SkyTrain Station. The officer then noted the motorcycle had pedals, but Ghadban wasn't using them.
According to the B.C. Motor Vehicle Act, the motor of a motor-assisted cycle must turn off or disengage if the operator stops pedaling, an accelerator controller is released, or a brake is applied. In his decision, the judge wrote that the Motorino XMr "does not comply with the intent of the legislation."
In his decision, the judge referred to a 2012 decision that held up the same charges against a man who had removed the pedals from a similar type of electric scooter. Because of that, the judge decided, the vehicle no longer fit the definition of a motor-assisted cycle.
New legislation coming
Ghadban testified that, in the five years he had owned the Motorino, he had never used the pedals.
His lawyer, Moscoe, argued that is an irrelevant detail, which doesn't mean the Motorino fails to comply with legislation.
But the judge disagreed.
Several judges in B.C. courts have noted the need to update provincial laws regarding electric modes of transportation, especially with Segways, hover-boards, electric scooters, electric skateboards and electric unicycles now on the market.
Last fall, the province said it was looking into the matter. Currently, a device that does not fall under the act's definition of a motor vehicle, bicycle or pedestrian is not allowed to operate on roadways or sidewalks.
Bruce Schneier ist nicht begeistert von der Idee einer ...
|
mkalus
shared this story
from |
Bruce Schneier ist nicht begeistert von der Idee einer Contract-Tracing-App, speziell nicht für eine Pandemiebekämpfung. Gar nicht wegen Datenschutz oder so. Er glaubt nicht, dass die überhaupt was bringen kann.
Diese Art von Gedanken machen sich natürlich auch die Leute, die an solchen Apps arbeiten. Was ich so gehört habe, ist deren Gegenargument: Wenn es nur ein Menschenleben schützt, hat es sich insgesamt gelohnt!
Predictions For 2020
|
mkalus
shared this story
from |
At the beginning of every year, I make predictions. At the end of every year, I score them. So here are a hundred more for 2020.
Rules: all predictions are about what will be true on January 1, 2021. Some predictions about my personal life, or that refer to the personal lives of other people, have been redacted to protect their privacy. I’m using the full 0 – 100 range in making predictions this year, but they’ll be flipped and judged as 50 – 100 in the rating stage, just like in previous years. I’ve tried to avoid doing specific research or looking at prediction markets when I made these, though some of them I already knew what the markets said.
Feel free to get in a big fight over whether 50% predictions are meaningful.
CORONAVIRUS:
1. Bay Area lockdown (eg restaurants closed) will be extended beyond June 15: 60%
2. …until Election Day: 10%
3. Fewer than 100,000 US coronavirus deaths: 10%
4. Fewer than 300,000 US coronavirus deaths: 50%
5. Fewer than 3 million US coronavirus deaths: 90%
6. US has highest official death toll of any country: 80%
7. US has highest death toll as per expert guesses of real numbers: 70%
8. NYC widely considered worst-hit US city: 90%
9. China’s (official) case number goes from its current 82,000 to 100,000 by the end of the year: 70%
10. A coronavirus vaccine has been approved for general use and given to at least 10,000 people somewhere in the First World: 50%
11. Best scientific consensus ends up being that hydroxychloroquine was significantly effective: 20%
12. I personally will get coronavirus (as per my best guess if I had it; positive test not needed): 30%
13. Someone I am close to (housemate or close family member) will get coronavirus: 60%
14. General consensus is that we (April 2020 US) were overreacting: 50%
15. General consensus is that we (April 2020 US) were underreacting: 20%
16. General consensus is that summer made coronavirus significantly less dangerous: 70%
17. …and there is a catastrophic (50K+ US deaths, or more major lockdowns, after at least a month without these things) second wave in autumn: 30%
18. I personally am back to working not-at-home: 90%
19. At least half of states send every voter a mail-in ballot in 2020 presidential election: 20%
20. PredictIt is uncertain (less than 95% sure) who won the presidential election for more than 24 hours after Election Day. 20%
POLITICS:
21. Democrats nominate Biden, and he remains nominee on Election Day: 90%
22. Balance of evidence available on Election Day supports (as per my opinion) Tara Reade accusation: 90%
23. Conditional on me asking about Reade on SSC survey, average survey-taker’s credence in her accusation is greater than 50%: 70%
24. …greater than 75%: 10%
25. …greater than credence in Kavanaugh accusation asked in the same format: 40%
26. Trump is re-elected President: 50%
27. Democrats keep the House: 70%
28. Republicans keep the Senate: 50%
29. Trump approval rating higher than 43% on June 1: 30%
30. Biden polling higher than Trump on June 1: 70%
31. At least one new Supreme Court Justice: 20%
32. I vote Democrat for President: 80%
33. Boris still UK PM: 90%
34. No new state leaves EU: 90%
35. UK, EU extend “transition” trade deal: 80%
36. Kim Jong-Un alive and in power: 60%
ECON AND TECH:
37. Dow is above 25,000: 70%
38. …above 30,000: 20%
39. Bitcoin is above $5,000: 70%
40. …above $10,000: 20%
41. I have bought a Surface Book 3 laptop: 60%
42. Crew Dragon reaches orbit: 80%
43. Starship reaches orbit: 40%
SSC, ETC:
44. I do another Nootropics Survey this year: 70%
45. I do another SSC Survey this year: 90%
46. I start a Reader SSC Survey this year: 60%
47. I start a SSC Book Review Contest this year: 70%
48. I run another Adversarial Collaboration Contest this year: 10%
49. I publish [redacted]: 20%
50. I publish [redacted]: 50%
51. I publish [redacted]: 60%
52. I publish [redacted]: 80%
53. …conditional on being published, it gets at least 40,000 pageviews: 10%
54. I publish [redacted]: 60%
55. …conditional on being published, it gets at least 40,000 pageviews: 50%
56. More hits this year than last: 70%
57. Most hits ever this year: 20%
58. I finish Unsong revision this year: 40%
59. New co-blogger with more than 3 posts: 10%
FRIENDS:
60. No new long-term (1 month +) residents at group house by the end of the year: 70%
61. Koios has said his first clear comprehensible word: 50%
62. [redacted]: 40%
63. [redacted]: 60%
64. [redacted]: 80%
65. [redacted]: 80%
66. [redacted]: 95%
67. [redacted]: 10%
68. [redacted]: 95%
69. [redacted]: 80%
70. [redacted]: 80%
71. [redacted]: 50%
PROFESSIONAL
72. I’ve gotten at least one new patient to do a full wake therapy protocol: 60%
73. I have specific, set-in-motion plans to quit work / start my own business: 5%
74. I work the same schedule and locations I did before the coronavirus: 80%
75. I get a bonus for 2020: 20%
PERSONAL:
76. [redacted]: 70%
77. [redacted]: 70%
78. [redacted]: 95%
79. I travel to Alaska this year: 60%
80. [redacted]: 40%
81. [redacted]: 20%
82. I go on at least three dates with someone I haven’t met yet: 20%
83. [redacted]: 10%
84. [redacted]: 30%
85. [redacted]: 10%
86. I try one biohacking project per month x at least 5 of the last 6 months of 2020: 30%
87. I find at least one new supplement I take or expect to take regularly x 3 months: 20%
88. Not eating meat at home: 40%
89. Weight below 200: 50%
90. Weight below 190: 10%
91. [redacted]: 90%
92. [redacted]: 30%
93. [redacted]: 5%
94. I travel outside the country at least once: 10%
95. I get back into meditating seriously (at least ten minutes a day, five days a week) for at least a month: 10%
96. At least ten tweets in 2020: 80%
97. I eat at/from Sliver more than any other restaurant in Q4 2020: 50%
98. [redacted]: 30%
99. I do pushups and situps at least 3 days/week in average week of Q4 2020: 60%
100. I write the post scoring these predictions before 2/1/21: 70%
New Firefox Preview update rolling out with support for extensions

Mozilla has been hard at work rebuilding its Firefox app on Android. The new Firefox it’s quite impressive, with an excellent new design, speedy performance and, finally, official add-on support.
Currently, the newest changes hit the Firefox Preview app first before eventually making their way to the Firefox Beta app. Once things have cleared the beta process, they will launch on the official Firefox for Android app — although the new design hasn’t made it that far yet.
With version 5.0 of Firefox Preview, which has reportedly started rolling out, people are able to install add-ons on mobile Firefox again.
While I have yet to receive the 5.0 update myself, several users on Reddit have installed it already. To access add-ons and extensions, users must tap the three-dot overflow button > Settings > Add-ons (under the Advanced heading). From there, users can access a limited number of add-ons and extensions and apply them to Firefox.
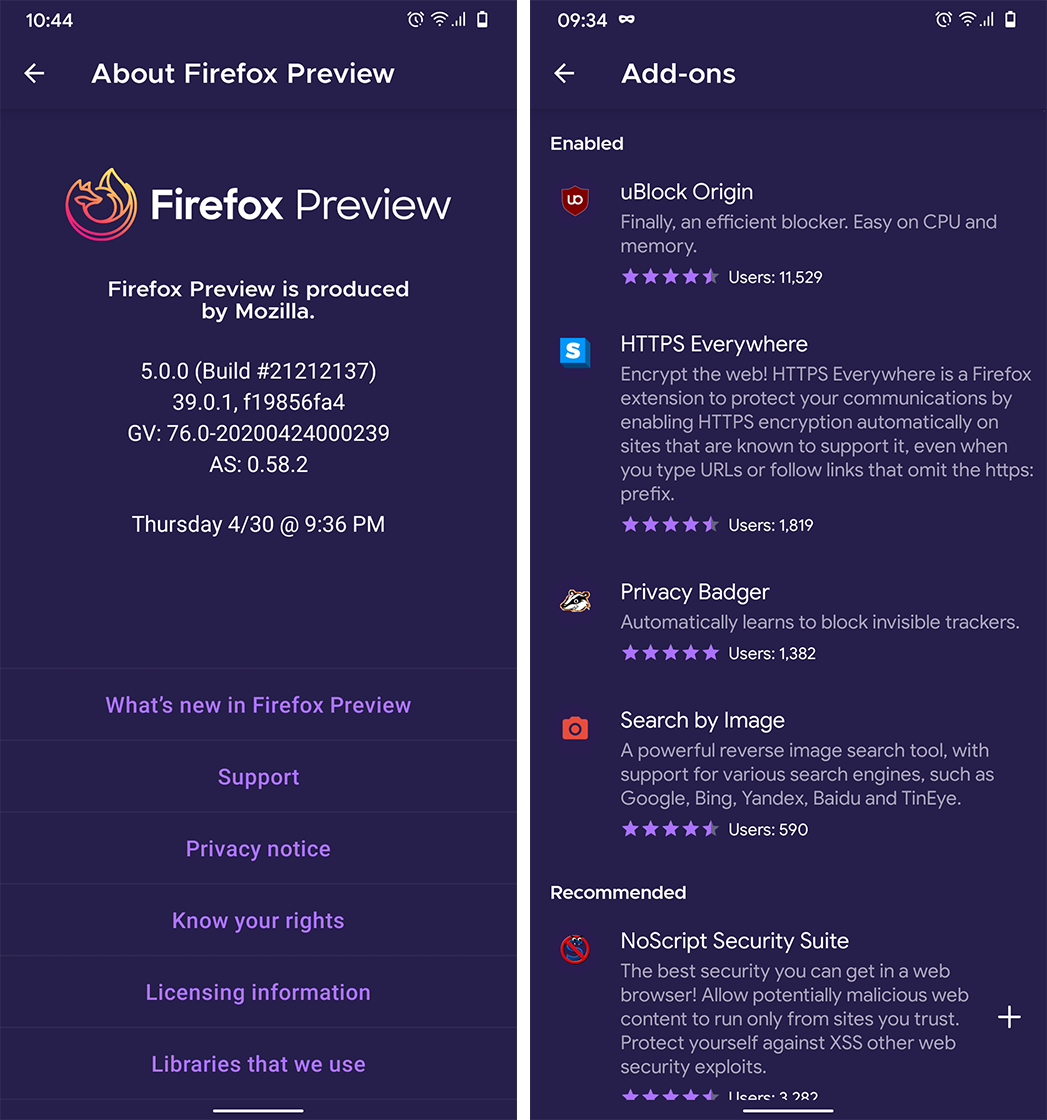
It’s worth noting that users on the previous version of Firefox Preview (4.3.0) can access this page as well, but the only available add-on is uBlock Origin.
For the moment, however, not all Firefox extensions and add-ons are available on mobile. Mozilla previously said it would focus on migrating add-ons from its ‘recommended extensions program‘ to Firefox for Android. Unfortunately, if an extension you want isn’t on that list, you’ll have to wait a little bit longer.
Thankfully, there are about 100 extensions in the program, including Privacy Badger, Facebook Container and LastPass. Chances are there will be something there that accomplishes what you need.
Firefox Preview 5.0 is rolling out via the Play Store now. If you already have it installed, the update should find you shortly. If not, you can download Firefox Preview for free.
Image credit: Reddit
Source: Reddit
The post New Firefox Preview update rolling out with support for extensions appeared first on MobileSyrup.
How will bikeshare perform in a post-covid city?
Maybe pretty well.

Reviving Bike Sharing as a Reliable, Low-Carbon Mobility Mode
Unlike public transport, the pandemic actually reignited interest in dockless bike sharing, an industry that had been experiencing a notable contraction in China. During the 50-day public transport lockdown in Wuhan, Meituan Bike (formerly Mobike) provided a remarkable 2.3 million trips in the city. As China’s economy re-opens, bike sharing appears to be back on the rise. … ride volume in Beijing has increased 120-187%, compared to before the pandemic. …
It seems increasingly likely that this surge in biking is more than a temporary phenomenon. Evidence suggests that cyclists are riding longer distances directly to their final destinations, not just for first- and last-mile connections. …
Feeling safe is also important for riders, suggesting cities may need to invest in safe cycling infrastructure to protect riders as motor vehicle traffic returns.
Microsoft Surface Pro X update improves Teams app stability

The Surface Pro X just got a new update that improves the stability of Microsoft’s Teams app.
Alongside Teams stability, there’s quite a bit more to this update. Fixes include adaptive brightness, as well as improved Bluetooth connectivity. There are also improvements to camera and Wi-Fi stability and lastly, performance when in tablet mode.
To check out the complete changelog, click here.
You can get the update through ‘Windows Update.’ If you don’t see it yet, Microsoft releases updates in stages, so you may just have to check again later.
Source: Windows Central
The post Microsoft Surface Pro X update improves Teams app stability appeared first on MobileSyrup.
A new empirical challenge for local theories of consciousness
Readers will recall my paper from a couple of years ago describing consciousness as experience. We have today a two papers that serve to refine similar sorts of theories. In the first paper, A new empirical challenge for local theories of consciousness (21 page PDF), the question concerns where precisely consciousness occurs in perception - 'localists' argue consciousness of a feature exists if it is "adequately represented and processed in sensory brain areas," while their opponents, 'globalists' argue that " consciousness involves the large-scale coordination of a variety of neuro-cognitive modules." This paper argues for the latter perspective based on the experience of separate phenomena only after they have been combined to form a single perception. In the second paper (23 page PDF), A Euthyphro Dilemma for Higher-order Theories of Consciousness, Daniel Stoljar, discusses the idea "that a psychological state of a subject is conscious if and only if the subject is conscious of being in that state."
Web: [Direct Link] [This Post]5 Learning Myths, Debunked
The first item on the list is of course learning styles. "People like to think that they have a special learning style, and some may even have learning preferences, but catering to those preferences does not show any learning benefits." Still. If you teach the same content the same way to different people, you get different outcomes (otherwise there would be no need for tests). So something varies from student to student. And if you're not getting any learning benefits by catering to that, then maybe it's your method, not the theory, that's at fault.
Web: [Direct Link] [This Post]RT @VitoGesualdi: Woke teenagers discovering Tropic Thunder is my favorite tweet genre pic.twitter.com/cyLsnpFnDg
|
mkalus
shared this story
from |
Woke teenagers discovering Tropic Thunder is my favorite tweet genre pic.twitter.com/cyLsnpFnDg


 AliceAvizandum
on Thursday, April 30th, 2020 7:20pm
AliceAvizandum
on Thursday, April 30th, 2020 7:20pm46253 likes, 8404 retweets
School Work and Surveillance
I was a guest speaker in the MA in Elearning class at Cork Institute of Technology this morning. Thanks very much to Gearóid Ó Súilleabháin for the invitation. Here's a bit of what I said...
Thank you for inviting me to speak to your class today. This is such a strange and necessary time to talk about education technology, to take a class about education technology, to get a degree in education technology because what, in the past, was so often framed as optional or aspirational is now compulsory — and compulsory under some of the worst possible circumstances. So it's a strange and necessary time to be a critic of education technology because, while I've made folks plenty angry before, now I am under even more pressure to say something, anything nice about ed-tech, to offer reassurance that — over time, by Fall Term surely — the tech will get better.
I can't. I'm sorry.
It's also an deeply uncomfortable time to be an American with any sort of subject matter expertise — it has been since well before the 2016 election, but particularly since then. I don't want to come off today as making broad sweeping statements about all of education everywhere when I'm very much talking about the education system in the US and the education technology industry in the US. So grain of salt and my apologies and all that.
One of the reasons that I am less than sanguine about most education technology is because I don't consider it this autonomous, context-free entity. Ed-tech is not a tool that exists only in the service of improving teaching and learning, although that's very much how it gets talked about. There's much more to think about than the pedagogy too, than whether ed-tech makes that better or worse or about the same just more expensive. Pedagogy doesn't occur in a vacuum. It has an institutional history; pedagogies have politics. Tools have politics. They have histories. They're developed and funded and adopted and rejected for a variety of reasons other than "what works." Even the notion of "what works" should prompt us to ask all sorts of questions about "for whom," "in what way," and "why."
I want to talk to you a bit today about what I think is going to be one of most important trends in education technology in the coming months and years. I can say this with some certainty because it's been one of the most important trends in education technology for a very long time. And that's surveillance.
Now, I don't say this to insist that surveillance technology is inevitably going to be more important, more pervasive. Me personally, I don't want the future of education to be more monitored, data-mined, analyzed, predicted, molded, controlled. I don't want education to look that way now, but it does.
Surveillance is not prevalent simply because that's the technology that's being sold to schools. Rather, in many ways, surveillance reflects the values we have prioritized: control, compulsion, efficiency. And surveillance plays out very differently for different students in different schools — which schools require schools to walk through metal detectors, which schools call the police for disciplinary infractions, which schools track what students do online, even when they're at home. And nowadays, especially when they're at home.
In order to shift educational institutions away from a surveillance culture, we are going to have to make a number of changes in priorities and practices — priorities and practices already in place long before this global pandemic.
Historically, a good deal of surveillance has involved keeping abreast (and control) of what the teacher was up to. She — and I recognize that teachers aren't always female, but the profession is certainly feminized — is alone in a classroom of other people's children, after all. And I'll return to this notion of teacher surveillance in a bit, but keep in mind, as I talk here, that none of the technologies I talk about affect students alone.
Perhaps the most obvious form of surveillance in schools involves those technologies designed to prevent or identify cheating. Indeed, if we expand our definition of "technology" to include more than just things with gears or silicon, we might recognize much of the physical classroom layout is meant to heighten surveillance and diminish cheating opportunities: the teacher in a supervisory stance at the front of the class, wandering up and down the rows of desks and peering over the shoulders of students. (Teachers, of course, know how to shift this physical setting — move the chairs around, for example. Teachers might be less adept or even able to do the same when the classroom setting is digital.)
Despite all the claims that ed-tech "disrupts," it is just as likely going to re-inscribe. That is, we are less likely to use ed-tech to rethink assignments or assessments than we are to use ed-tech more closely scrutinize student behavior.
Some of the earliest educational technologies — machines developed in the mid-twentieth century to automate instruction — faced charges that they were going to make it easier for students to cheat. If, as promised, these machines could allow students to move through course materials at their own pace without teacher supervision, there had to be — had to be — some mechanism to prevent deceptive behavior. As today, these technologies promised to "personalize" education; but that increased individualization also brought with it a demand to build into new devices ways to track students more closely. More personalized means more surveilled — we know this from Facebook and Amazon, don't we.
And this is key: the fear that students are going to cheat is constitutive of much of education technology. This belief dictates how it's designed and implemented. And in turn it reinforces the notion that all students are potential academic criminals.
For a long time, arguably the best known anti-cheating technology was the plagiarism detection software TurnItIn. The company was founded in 1998 by UC Berkeley doctoral students who were concerned about cheating in the science classes they taught. And I think it's worth noting, if we think about the affordances of technology, they were particularly concerned about how students were utilizing a new feature that the personal computer had given them: copy-and-paste. So they turned some of their research on pattern-matching of brainwaves to create a piece of software that would identify patterns in texts. And as you surely know, TurnItIn became a huge business, bought and sold several times over by private equity firms since 2008: first by Warburg Pincus, then by GIC, and then, in 2014, by Insight Partners — the price tag for that sale: $754 million. TurnItIn was acquired by the media conglomerate Advance Publications last year for $1.75 billion.
So we should ask: what's so valuable about TurnItIn? Is it the size of the customer base — the number of schools and universities that pay to use the product? Is it the algorithms — the pattern-matching capabilities that purport to identify plagiarism? Is it the vast corpus of data that the company has amassed — decades of essays and theses and Wikipedia entries that it uses to assess student work?
TurnItIn has been challenged many times by students who've complained that it violates their rights to ownership of their work. A judge ruled, however, in 2008 that students' copyright was not infringed upon as they'd agreed to the Terms of Service.
But what choice does one have but to click "I agree" when one is compelled to use a piece of software by one's professor, one's school? What choice does one have when the whole process of assessment is intertwined with this belief that students are cheaters and thus with a technology infrastructure that is designed to monitor and curb their dishonesty?
Every student is guilty until the algorithm proves their innocence.
Incidentally, one of its newer products promise to help students avoid plagiarism, and so essay mills now also use TurnItIn so they can promise to help students avoid getting caught cheating. The company works both ends of the plagiarism market. Genius.
Anti-cheating software isn't just about plagiarism, of course. No longer does it just analyze students' essays to make sure the text is "original." There is a growing digital proctoring industry that offers schools way to monitor students during online test-taking. Well-known names in the industry include ProctorU, Proctorio, Examity, Verificient. Many of these companies were launched circa 2013 — that is, in the tailwinds of "the Year of the MOOC," with the belief that an increasing number of students would be learning online and that professors would demand some sort of mechanism to verify their identity and their integrity. According to one investment company, the market for online proctoring was expected to reach $19 billion last year — much smaller than the size of the anti-plagiarism market, for what it's worth, but one that investors see as poised to grow rapidly, particularly in the light of the coronavirus pandemic.
These proctoring tools gather and analyze far more data than just a student's words, than their responses on an exam. They require a student show photo identification to their laptop camera before the test begins. Depending on what kind of ID they use, the software gathers data like name, signature, address, phone number, driver’s license number, passport number, along with any other personal data on the ID. That might include citizenship status, national origin, or military status. The software also gathers physical characteristics or descriptive data including age, race, hair color, height, weight, gender, or gender expression. It then matches that data that to the student's "biometric faceprint" captured by the laptop camera. Some of these products also capture a student's keystrokes and keystroke patterns. Some ask for the student to hand over the password to their machine. Some track location data, pinpointing where the student is working. They capture audio and video from the session — the background sounds and scenery from a student's home.
The proctoring software then uses this data to monitor a student's behavior during the exam and to identify patterns that it infers as cheating — if their eyes stray from the screen too long, for example, their "suspicion" score goes up. The algorithm — sometimes in concert with a human proctor — decides who is suspicious. The algorithm decides who is a cheat.
We know that algorithms are biased, because we know that humans are biased. We know that facial recognition software struggles to identify people of color, and there have been reports from students of color that the proctoring software has demanded they move into more well-lit rooms or shine more light on their faces during the exam. Because the algorithms that drive the decision-making in these products is proprietary and "black-boxed," we don't know if or how it might use certain physical traits or cultural characteristics to determine suspicious behavior.
We do know there is a long and racist history of physiognomy and phrenology that has attempted to predict people's moral character from their physical appearance. And we know that schools have a long and racist history too that runs adjacent to this.
Of course, not all surveillance in schools is about preventing cheating; it's not all about academic dishonesty — but it is always, I'd argue, about monitoring behavior and character. And surveillance is always caught up in the inequalities students already experience in our educational institutions.
For the past few years, in the US at least, a growing number of schools have adopted surveillance technology specifically designed to prevent school shootings. In some ways, these offerings are similar to the online proctoring tools, except these monitor physical and well as online spaces, using facial recognition software and algorithms that purport to identify threats. This online monitoring includes tracking students' social media accounts, "listening" for menacing keywords and phrases. (These products are sold to schools in other countries too, not as school shooting prevention — that seems to be a grotesquely American phenomenon — but often as ways to identify potential political and religious extremism and radicalization among students.)
And there are plenty of other examples I could give you too, unfortunately, of how surveillance technologies permeate schools. Schools using iris-scanners in the lunchroom. Schools using radio-trackers on students' ID cards and monitoring students' mobile phones to make sure they're in class. And all this is in addition to the incredible amounts of data gathered and analyzed by the day-to-day administrative software of schools — from the learning management system (the VLE), the student information system, the school network itself, and so on. Like I said, not all of this is about preventing cheating, but all of it does reflect a school culture that does not trust students.
So, what happens now that we're all doing school and work from home?
Well, for one thing, schools are going to be under even more pressure to buy surveillance software — to prevent cheating, obviously, but also to fulfill all sorts of regulations and expectations about "compliance." Are students really enrolled? Are they actually taking classes? Are they doing the work? Are they logging into the learning management system? Are they showing up to Zoom? Are they really learning anything? How are they feeling? Are they "at risk"? What are teachers doing? Are they holding class regularly? How quickly do they respond to students' messages in the learning management system?
And this gets us back to something I mentioned at the outset: the surveillance of teachers.
For a very long time, the argument that many employers made against working from home was that they didn't trust their employees to be productive. The supervisor needed to be able to walk by your desk at any moment and make sure you were "gonna have those TPS reports to us by this afternoon," to borrow a phrase from the terrific movie Office Space. And much as education technology is designed on the basis of distrust of students, enterprise technology — that is, technology sold to large businesses — is designed around a distrust of workers. Again, there's a long history here — one that isn't just about computing. The punch clock, for example, was invented in 1888 by a jeweler William LeGrand Bundy in order to keep track of what time his employees came and left work. He and his brother founded the Bundy Manufacturing Company to manufacture the devices, and after a series of mergers, it became a part of a little company called International Business Machines, or IBM. Those "business machines" were sold with the promise of more efficient workplaces, of course, and that meant monitoring workers.
Zoom, this lovely piece of videoconferencing software we are using right now, is another example of enterprise technology. Zoom never intended to serve the education market quite like this. And there is quite a bit about the functionality of the software that reveals whose interests it serves — the ability to track who's paying attention, for example, and who's actually working on something else (a feature, I will say, that the company disabled earlier this month after complaints about its fairly abysmal security and privacy practices). Who's cheating the time-clock, that is. Who's cheating the boss.
Social media monitoring tools that are used to surveil students are also used to surveil workers, identifying those who might be on the cusp of organizing or striking. Gaggle, a monitoring tool used by many schools, wrote a blog post a couple of years ago in which it suggested administrators turn the surveillance towards teachers too: "Think about the recent teacher work stoppage in West Virginia," the post read. "Could the story have been different if school leaders there requested search results for 'health insurance' or 'strike' months earlier? Occasional searches for 'salary' or 'layoffs' could stave off staff concerns that lead to adverse press for your school district." In response to one wildcat strike at a US university earlier this month, the administration threatened those graduate student-instructors who had not logged into the learning management system with the loss of their stipends.
One of my greatest fears right now is that this pandemic strengthens this surveillance culture in school. And the new technologies, adopted to ease the "pivot to digital," will exacerbate existing educational inequalities, will put vulnerable students at even more risk. These technologies will for foreclose possibilities for students and for teachers alike, shutting down dissent and discussion and curiosity and community.
Too often in education and ed-tech, we have confused surveillance for care. We need to watch students closely, we tell ourselves, because we want them to be safe and to do well. But caring means trusting, and trusting means being able to turn off a controlling gaze. Unfortunately, frighteningly, it seems we are turning it up.
Asymptotics of Reproducibility
Every once in a while, I see a tweet or post that asks whether one should use tool X or software Y in order to “make their data analysis reproducible”. I think this is a reasonable question because, in part, there are so many good tools out there! This is undeniably a good thing and quite a contrast to just 10 years ago when there were comparatively few choices.
The question of toolset though is not a question worth focusing on too much because it’s the wrong question to ask. Of course, you should choose a tool/software package that is reasonably usable by a large percentage of your audience. But the toolset you use will not determine whether your analysis is reproducible in the long-run.
I think of the choice of toolset as kind of like asking “Should I use wood or concrete to build my house?” Regardless of what you choose, once the house is built, it will degrade over time without any deliberate maintenance. Just ask any homeowner! Sure, some materials will degrade slower than others, but the slope is definitely down.
Discussions about tooling around reproducibility often sound a lot like “What material should I use to build my house so that it never degrades*?” Such materials do not exist and similarly, toolsets do not exist to make your analysis permanently reproducible.
I’ve been reading some of the old web sites from Jon Claerbout’s group at Stanford (thanks to the Internet Archive), the home of some of the original writings about reproducible research. At the time (early 90s), the work was distributed on CD-ROMs, which totally makes sense given that CDs could store lots of data, were relatively compact and durable, and could be mailed or given to other people without much concern about compatibility. The internet was not quite a thing yet, but it was clearly on the horizon.
But ask yourself this: If you held one of those CD-ROMs in your hand right now, would you consider that work reproducible? Technically, yes, but I don’t even have a CD-ROM reader in my house, so I couldn’t actually read the data. And a larger problem is that a CD from the 90s probably degraded to the point where it is likely unreadable anyway.
Claerbout’s group obviously knew about the web and were transitioning in that direction, but such a transition costs money. As does keeping a keen eye on emerging trends and technology usage.
Hilary Parker and I recently discussed the how the economics of academic research are not well-suited to support the reproducibility of scientific results. The traditional model is that a research grant pays for the conduct of research over a 3-5 year period, after which the grant is finished and there is no more funding. During (or after) that time, scientific results are published. While the funding can be used to prepare materials (data, software, and code) to make the published findings reproducible at the instant of publication, there is no funding afterwards for dealing with two key tasks:
- Ensuring that the work continues to be reproducible given changes to the software and computing environment (maintenance)
- Fielding questions or inquiries from others interested in reproducing the results or in building upon the published work (support)
These two activities (maintenance and support) can continue to be necessary in perpetuity for every study that an investigator publishes. The mismatch between how the grant funding system works and the requirements of reproducible research is depicted in the diagram below.

When I say “value” in the drawing above, what I really mean is the “reproducibility value”. In the old model of publishing science, there was no reproducibility value because the work was generally not reproducible in the sense that data and code were available. Hence, this whole discussion would be moot.
Traditional paper publications held their value because the text on the page did not generally degrade much over time and copies could easily be made. Scientists did have to field the occasional question about the results but it was not the same as maintaining access to software and datasets and answering technical questions therein. As a result, the traditional economic model for funding academic research really did match the manner in which research was conducted and then published. Once the results were published, the maintenance and support costs were nominal and did not really need to be paid for explicitly.
Fast forward to today and the economic model has not changed but the “business” of academic research has. Now, every publication has data and code/software attached to it which come with maintenance and support costs that can extend for a substantial period into the future. While any given publication may not require significant maintenance and support, the costs for an investigator’s publications in aggregate can add up very quickly. Even a single paper that turns out to be popular can take up a lot of time and energy.
If you play this movie to the end, it becomes soberingly clear that reproducible research, from an economic stand point, is not really sustainable. To see this, it might help to use an analogy from the business world. Most businesses have capital costs, where they buy large expensive things – machinery, buildings, etc. These things have a long life, but are thought to degrade over time (accountants call it depreciation). As a result, most businesses have “maintenance capital expenditure” costs that they report to show how much money they are investing every quarter to keep their equipment/buildings/etc. up to shape. In this context, the capital expenditure is worth it because every new building or machine that is purchased is designed to ultimately produce more revenue. As long as the revenue generated exceeds the cost of maintenance, the capital costs are worth it (not to oversimplify or anything!).
In academia, each new publications incurs some maintenance and support costs to ensure reproducibility (the “capital expenditure” here) but it’s unclear how much each new publication brings in more “revenue” to offset those costs. Sure, more publications allow one to expand the lab or get more grant funding or hire more students/postdocs, but I wouldn’t say that’s universally true. Some fields are just constrained by how much total funding there is and so the available funding cannot really be increased by “reaching more customers”. Given that the budgets for funding agencies (at least in the U.S.) have barely kept up with inflation and the number of publications increases every year, it seems the goal of making all research reproducible is simply not economically supportable.
I think we have to concede that at any given moment in time, there will always be some fraction of published research for which there is no maintenance or support for reproducibility. Note that this doesn’t mean that people don’t publish their data and code (they should still do that!), it just means they don’t support or maintain it. The only question is which fraction should *no*t be supported or maintained? Most likely, it will be older results where the investigators simply cannot keep up with maintenance and support. However, it might be worth coming up with a more systematic approach to determining which publications need to maintain their reproducibility and which don’t.
For example, it might be more important to maintain the reproducibility of results from huge studies that cannot be easily replicated independently. However, for a small study conducted a decade ago that has subsequently been replicated many times, we can probably let that one go. But this isn’t the only approach. We might want to preserve the reproducibility of studies that collect unique datasets that are difficult to re-collect. Or we might want to consider term-limits on reproducibility, so an investigator commits to maintaining and supporting the reproducibility of a finding for say, 5 years, after which either the maintenance and support is dropped or longer-term funding is obtained. This doesn’t necessarily mean that the data and code suddenly disappear from the world; it just means the investigator is no longer committed to supporting the effort.
Reproducibility of scientific research is of critical importance, perhaps now more than ever. However, we need to think harder about how we can support it in both the short- and long-term. Just assuming that the maintenance and support costs of reproducibility for every study are merely nominal is not realistic and simply leads to investigators not supporting reproducibility as a default.