Being a scientist can be pretty stressful for any number of reasons, from the peer review process, to getting funding, to getting blown up on the internet.
Like a lot of academics I suffer from a lot of stress related to my own high standards and the imposter syndrome that comes from not meeting them on a regular basis. I was just reading through the excellent material in Lorena Barba’s class on essential skills in reproducibility and came across this set of slides by Phillip Stark. The one that caught my attention said:
If I say just trust me and I’m wrong, I’m untrustworthy.
If I say here’s my work and it’s wrong, I’m honest, human, and serving scientific progress.
I love this quote because it shows how being open about both your successes and failures makes it less stressful to be a scientist. Inspired by this quote I decided to make a list of things that I’ve learned through hard experience do not help me with my own imposter syndrome and do help me to feel less stressed out about my science.
Put everything out in the open. We release all of our software, data, and analysis scripts. This has led to almost exclusively positive interactions with people as they help us figure out good and bad things about our work.
Admit mistakes quickly. Since my code/data are out in the open I’ve had people find little bugs and big whoa this is bad bugs in my code. I used to freak out when that happens. But I found the thing that minimizes my stress is to just quickly admit the error and submit updates/changes/revisions to code and papers as necessary.
Respond to requests for support at my own pace. I try to be as responsive as I can when people email me about software/data/code/papers of mine. I used to stress about doing this right away when I would get the emails. I still try to be prompt, but I don’t let that dominate my attention/time. I also prioritize things that are wrong/problematic and then later handle the requests for free consulting every open source person gets.
Treat rejection as a feature not a bug. This one is by far the hardest for me but preprints have helped a ton. The academic system is designed to be critical. That is a good thing, skepticism is one of the key tenets of the scientific process. It took me a while to just plan on one or two rejections for each paper, one or two or more rejections for each grant, etc. But now that I plan on the rejection I find I can just focus on how to steadily move forward and constructively address criticism rather than taking it as a personal blow.
Don’t argue with people on the internet, especially on Twitter. This is a new one for me and one I’m having to practice hard every single day. But I’ve found that I’ve had very few constructive debates on Twitter. I also found that this is almost purely negative energy for me and doesn’t help me accomplish much.
Redefine success. I’ve found that if I recalibrate what success means to include accomplishing tasks like peer reviewing papers, getting letters of recommendation sent at the right times, providing support to people I mentor, and the submission rather than the success of papers/grants then I’m much less stressed out.
Don’t compare myself to other scientists. It is very hard to get good evaluation in science and I’m extra bad at self-evaluation. Scientists are good in many different dimensions and so whenever I pick a one dimensional summary and compare myself to others there are always people who are “better” than me. I find I’m happier when I set internal, short term goals for myself and only compare myself to them.
When comparing, at least pick a metric I’m good at. I’d like to claim I never compare myself to others, but the reality is I do it more than I’d like. I’ve found one way to not stress myself out for my own internal comparisons is to pick metrics I’m good at - even if they aren’t the “right” metrics. That way at least if I’m comparing I’m not hurting my own psyche.
Let myself be bummed sometimes. Some days despite all of that I still get the imposter syndrome feels and can’t get out of the funk. I used to beat myself up about those days, but now I try to just build that into the rhythm of doing work.
Try very hard to be positive in my interactions. This is another hard one, because it is important to be skeptical/critical as a scientist. But I also try very hard to do that in as productive a way as possible. I try to assume other people are doing the right thing and I try very hard to stay positive or neutral when writing blog posts/opinion pieces, etc.
Realize that giving credit doesn’t take away from me. In my research career I have worked with some extremely generousmentors. They taught me to always give credit whenever possible. I also learned from Roger that you can give credit and not lose anything yourself, in fact you almost always gain. Giving credit is low cost but feels really good so is a nice thing to help me feel better.
The last thing I’d say is that having a blog has helped reduce my stress, because sometimes I’m having a hard time getting going on my big project for the day and I can quickly write a blog post and still feel like I got something done…
At the beginning of each year I make predictions, and at year’s end, I hold myself to account. It’s kind of fun to look back and see how wrong (or right) my musings end up being.
I’ll be writing my Predictions 2017 post this weekend (I think), and publishing it shortly thereafter. But for now, let’s take a stroll down memory lane, and see how I did. Here’s a short report card for each of my twelve 2016 predictions.
#1 – 2016 will be the year that “business on a mission” goes mainstream. Well, this was pretty self serving, given it’s at the core of the work I did all year long at NewCo andNewCo Shift. But I did predict that massive companies would put their missions at the core of their marketing, and that certainly happened with corporations like Unilever, Ikea, H&M, and many others. I also said the press would start covering the story as a regular beat, more than just annual “doing good by doing well” lists. While coverage (and the number of those annual lists) has increased, I can’t argue the story has broken out as big as I expected. And while organizations like Just Capital have launched to track company data beyond price and profit, I think this story needs another year or two to mature. Overall, this prediction trended in the right direction, but didn’t fully come true this year, so I’m going to give myself a (noble, well intentioned) whiff on this one.
#2 – Mobile will finally mean more than apps. It may seem counterintuitive, but I think this is the year my mobile prediction actually came true. Here’s the detail from my post: “by year’s end, we’ll find ourselves interacting with our technology in new and far more “web like” ways – bouncing from link to link, service to service, much as we did on the original web, but with the power, context, and sensor-laden enablement of mobile apps and devices.” In fact, that’s exactly how using my phone now feels – deep linking has gone mainstream, and more often than not a link from a search opens an app on my phone, or a call to action in an email or inside an app opens another app – or a mobile web view – inside a third party site. Plus, every new release of Android (I don’t use iOS) seems to increase the utility of notifications, voice, and search. That’s how the next generation internet should work, and it’s here, now. Which is a really good thing (and augurs some very cool new opportunities, which I’ll probably explore in my predictions post). I’m going to grade myself a “mostly nailed it.” Why mostly? Because at the end of my prediction, I said Google’s app streaming was going to help make it all happen. While the company continues to refine and roll out the service (and related services like Instant Apps, or Apple’s On Demand Resources), I deserve a ding for that call. I’d rate it a 75% win.
#3 – Twitter makes a comeback. I don’t really need to go into much detail here. This did not happen. It’s all about the product. And while the election certainly helped Twitter, Twitter did not help itself much this past year. My wishful thinking earned me a fail on this one. Damnit Twitter, please be all we know you can be in 2017!
#4 – Adtech and the Internet of Things begins to merge. Weeks after I wrote this prediction, the industry bellwether Dmexco, arguably the most important marketing conference in the world, declared that IoT was the future of adtech. Core adtech companies – Google, Facebook, Amazon (yes, Amazon is a serious player in adtech) – all released key products or platforms that vector IoT directly into their adtech strengths (Google Home? Check. Facebook Messenger bots? Check. Amazon’s Alexa/Echo? Check.) This merger will be messy and fraught, but bots and voice are the future for all the major internet players, and advertising business models and tech platforms will drive them all, in new and perhaps unexpected ways. Add to that the unprecedented amount of work done this past year in autonomous vehicles (which is a major IoT category and of course, a huge advertising platform in and of itself), and I think it’s fair to say this prediction came true. However, there’s a lot more to this trend than just merging advertising and IoT. That’s the easy (and obvious) part of the equation. The less obvious work remains to be done – as I wrote in the prediction: “I’m suggesting that the underlying technology powering adtech is perfectly suited to execute the highly complicated and highly performant rules-based decisioning required for the Internet of Things to touch our lives on a regular basis.” I honestly don’t know of any development over the past year that proves this part of my prediction, but I can’t imagine it’s not being worked on by the Amazons, Googles, and Facebooks of the world. We did have a major IoT event that proved the power of my predicted merger: Hackers harnessed millions of poorly secured IoT devices to mount massive DDOS attacks across the web.
Oh, and at the end of this prediction, I ventured that in 2016, we’d see a blockchain based adtech player emerge. We did see the emergence of BitTeaser and its related HubDSP, though they are in very early stages as of now. Overall, I’d say this prediction played out – score it as another 75% – a passing grade, at the very least.
#5 – Tesla’s Model 3 will garner more than 100,000 pre-orders. Many of you thought I was crazy to predict massive orders for the Model 3, but….Tesla blew through my most optimistic numbers. Orders are now approaching half a million, and counting.
#6 – Publishers and platforms come to terms. This is a hard one to prove. I wrote: “In 2016, Medium, LinkedIn, and Facebook will all make strides in helping all publishers succeed.” And I think this is largely true. Medium rolled out a publisher program, and limited, but improving advertising options for its publishers. LinkedIn hasn’t yet rolled out a publisher friendly platform, but it’s become a crucial traffic driver for a lot of publishers, and I’ve heard plenty of well-sourced rumors that a publishing platform is coming once the Microsoft integration is complete. And Facebook, well, Facebook had an uneven year when it comes to publisher relations, but there isn’t a serious publisher in the world who isn’t busy integrating with Instant Articles and the Newsfeed in one way or another. Add in publisher centric moves from Google (Amp, etc), and Apple (Apple News continue to grow, slowly), and I’d give this prediction a passing grade.
#7 – Search has a dominant year, thanks in large part to voice and AI. I think this also came to pass this year. We can debate if “traditional search” had a dominant year, but that was not my point. Search is in transition to new models based on voice and AI-assistants like Siri, Now, Alexa, and Cortana, and in 2016, these most certainly came into their own. I predicted that search volume, if once counted voice and AI, would be “way up” in 2016. Voice search volume did indeed explode in 2016, but we’ll have to wait for Mary Meeker’s mid year update to know by exactly how much. Regardless, I think I got this one right.
#8 – Apple endures a boring year. Yep, this pretty much happened. I wrote: “short of yet another iPhone folks feel obliged to purchase, there’ll be nothing spectacular. I don’t think folks will be calling for Tim Cook’s head, but many will wonder if Apple is meandering its way toward a boring, profit-milking middle age.” Check.
#9 – Microsoft and Google get serious about hardware. Oh yes, they sure as hell did. Microsoft became a billion dollar a quarter player in tablets/computing with Surface, and Google rolled out Home, Pixel (its first true Google phone), and more Chrome gadgets. Both companies are very, very serious about hardware now.
#10 – Medium has a breakout year. I wasn’t sure this was going to happen, but just this month, Medium released its growth numbers – up 140% year on year, to 60 million users. Combined with the launch of its publishing platform and the release of far better iOS and Android apps, Medium was indeed on a tear in 2016.
#11 –China goes shopping. In 2015, we all expected Chinese companies like Alibaba to start snapping up startups left and right. It didn’t exactly happen. But I predicted that 2016 would see it come to fruition, and indeed Chinese firms were very busy this past year. China dealmaking rose 145% in 2016, according to Bloomberg, and Internet and Software was one of the hottest sectors, with adtech – much maligned for years – a major standout.
#12 – Sports unbundle. Well….no. I really, really wanted to drop my cable sub this past year, and the only thing keeping me from doing so was my beloved San Francisco Giants. Alas, nothing happened this year that will change that. There was a lot of hand wringing about the future of sports-driven brands like ESPN, and nearly everyone things sports will someday unbundle, just as HBO and many others have recently done. But not this year, so…my wishful prediction was a swing and a miss.
Summing up, how’d I do? Pretty darn well, it turns out. I whiffed on only three – Business on a mission, Twitter, and Sports – and pretty much nailed the rest of them. That’s one of my best showings yet – nine for twelve, or a .750 batting average. Good enough to convince me to try again for next year! Have a great New Year’s Eve, and I’ll be back soon with predictions for 2017.
It’s been a hell of a year for dead artists, democracy, truth, and corporate stupidity. When I started 2016 I had a plan. I would complete the manuscript for Writing Without Bullshit, HarperBusiness would publish it, and I’d use the bullshit in the election season to promote it. I had no idea that this crazy election would … Continued
Stephen King@StephenKing
One remarkable difference between Obama and Trump: the latter seems to have absolutely no sense of humor. The clearest sign of a dull mind.
Renée Stephen@ReneeStephen
"Canadians are so nice because they're suppressing their meanness. Storing it up somewhere, like Dorian Grey."
"Hmm. That explains Toronto."
Rasha Al Aqeedi@RashaAlAqeedi
@MichaelStahlke Most movies don't. You only get the sense of how much war damages lives from 1) actually living in a war zone 2) books
Jack asked us for ideas on how to fix Twitter. A coherent plan for fixing Twitter would make millions of people happier, and pick up a billion dollars in market cap along the way. C’mon, it’ll be great!
Listen, it’s almost 2017, so it’s absurd to still be writing “how to save Twitter” thinkpieces. But I’m an eternal optimist, a fan of Twitter right from the start (no seriously, it says so on the company blog) and I don’t have time to go fix Twitter since I’m busy with my new job at Fog Creek now. So, Jack: I’ll give you this one for free, just because I still have a soft spot in my heart for the product and I really want us all to stop having to rescue Twitter in 2017.
Here’s the short version:
Show you can consistently ship new features
Directly handle abuse and tell the world what you’re doing
Stop using meaningless metrics as your measure of success
Provide specific tools for each of your types of users
Decide if you give a damn about developers or not
1. Show the world you can ship consistently
Open-letter advice articles like this Medium piece are usually particularly insufferable because they presume that a big company full of smart people couldn’t think of improvements that one random Internet dude spewed out in a few minutes. I don’t think that smart people at Twitter haven’t thought of these ideas: I’m merely emphasizing that nobody on the outside can tell if they did or not. So you have to ship. You have to launch new features, tell users what they are, and explain why you made them.
Everything depends on this. I know you make little updates to the Twitter apps, and are doing tests all the time on features that you try out for different groups of users. But almost nobody believes Twitter has the ability to launch meaningful new features on a consistent basis. The last “big” launch you did was Moments, and while it may be performing for new users, it was massively underwhelming for engaged users, and perception matters as much as metrics. Your most enthusiastic users haven’t seen anything significant in ages.
By contrast, it feels like Instagram or Facebook ship something new every other week, and Google throws so much shit up against the wall nobody can even pay attention to it all. Without trusting that you can iterate on your product, nobody will believe you can solve any of the other problems listed here.
Twitter for the Mac: It’s bad.
2. Abuse
Yeah, I know, you hear this one a lot. This is still the biggest fundamental issue. And yes, it’s a hard problem—even if you solve obvious and hyper-visible issues like the way women, especially women of color, are targeted on the English-speaking communities of Twitter, that wouldn’t fix complex issues like LGBT teens having their lives imperiled by being outed in Saudi Arabia. I know your Safety team’s intentions are good and that their responses have been improving. But Twitter’s apparent understanding of the threat model is often broken; solutions like blocking only make sense if the problem is one that goes away by ignoring it, not if it’s a threat that needs to be monitored.
This is one of the rare areas where you shouldn’t just show, you should tell: Explain loudly and clearly that you don’t want organized mobs of attackers on your site. Make sure features like quoting tweets aren’t being abused by people who set others up as targets. Fighting these large-scale attacks matters even more than banning individual bad actors. Harassment mobs like the alt-right already think you’re censoring them, so you might as well make their dreams come true. When they ask, you’ll have an answer:
Your relationship with Wall Street investors (and, to some degree, with advertisers) is fundamentally broken because you’ve gotten trapped into using the wrong metrics to measure the success or progress of Twitter. New signups are flat, and they’re going to stay flat, and every desperate flailing attempt to change that just reminds engaged users that they’re not seeing any progress and they don’t believe you can ship features they care about. Meanwhile, do you know how many new video creators joined YouTube this quarter? Me neither! You know why? Because all the good videos are on YouTube! What percentage of people who visit YouTube each month are logged in? What percentage ever uploaded a video? Answer: Nobody gives a shit. Because YouTube inarguably drives culture, and people (and advertisers!) want to be part of that.
Similarly, when Trump destroys the planet with more rambling, incoherent abusive gibberish, nobody is going to ask, “Did he say it on Tumblr?” Because Twitter is the place that popular culture gets created and discussed! I’m not happy about the fact that Twitter helped Trump get elected, but it makes it damned obvious that investors watching your signup numbers have thoroughly missed the point. Change the metrics, change the story, take the reins and lead them into a better understanding of the world than whatever meager measurements they got obsessed with in 2009.
Only a tiny percentage of YouTube users make videos, but YouTube’s outdoor advertising features those creators and works to make stars of them. The unique creativity on that platform is what defines it, in both the mind of users and creators. By contrast, even though some of the ads are very pretty and the overall execution is striking, Twitter’s outdoor advertising seems much more incoherent, because it’s promoting… #Putin?
Your ads should feature voices and creators and ideas that are unique to Twitter, and while hashtags fit the bill, Putin certainly doesn’t. It would make more sense to promote the fun and ridiculous joke hashtags that trend on their own every night, since those are unique to Twitter. We can get Putin anywhere.
Right now, it feels like Twitter is chasing video because there’s lots of money in TV and you want some. You know why all that money went to TV? Because it was the only place to see the creative people and ideas that were shaping culture. That’s a huge part of Twitter’s role today; just own it.
4. Understand your different users, and serve them differently
A few years ago, I wrote about being verified and getting a blue checkmark on Twitter. A lot of people are absolutely obsessed with what it means to be “Twitter famous”, but there’s also probably nothing on the platform that’s more alienating and divisive than the blue checkmark. You know why? Because Twitter can’t decide what the hell the checkmark means.
I know, I know, the stated policy is that the blue checkmark only signifies that someone is actually who they purport to be. That way, when there’s a blue checkmark on a white supremacist’s account, you know they’re a genuine Nazi. Here’s the thing, though: having a verified account also gives users access to a set of filtering and management features for their mentions. That’s got nothing to do with verifying identity. Add to that the fact that some verified accounts have almost no followers and no concerns about impersonation, while some hugely popular accounts on Twitter aren’t verified, and it becomes clear that there’s no consistent internal policy on the meaning of the status.
It’s not just verification—Twitter clearly places special value on celebrities and well-known voices across the platform. That’s reasonable! They help make Twitter an interesting place to hang out. The introduction of specialized apps like Dashboard and Engage are a good step toward accommodating power users on the platform. But it makes no sense that these tools aren’t promoted to every enthusiastic user on the platform, instead of just #brands and celebrities.
Again, look to YouTube: They’ve made a Creator Studio that, while overly complex, provides a great set of tools to people who want to make awesome things on the platform. The only people who get rich tools from Twitter are advertisers and people who get famous outside of Twitter. It’s time for a more coherent strategy:
It’s clear you want a dead-simple experience for new users, where you do things like hiding @names when they’re mentioned. Okay! But only do that for new users. Why change things for the worse for experienced users?
Unify all of the power-user creative tools—including the ones currently only available to advertisers—and make them automatically appear for people who could use them. Anyone who’s tweeted more than 1000 times should have these tools. Present it as a special reward, a feature they unlocked by being awesome contributors to the platform. In general, Twitter is abysmal at providing features that reward good behavior, and this would be a meaningful step.
Unify all of the tools for managing community, responses, and mentions, and provide them to anyone who’s ever had a tweet get more than 100 RTs. Limiting response tools to be only available for brands is absurd, and having some filtering tools only be for verified accounts is downright irresponsible.
In general, Twitter functionality needs to be organized by those who will make use of it, rather than internal divisions about who is an influencer and who is an advertiser and who is just a poor schmuck who happens to love Twitter.
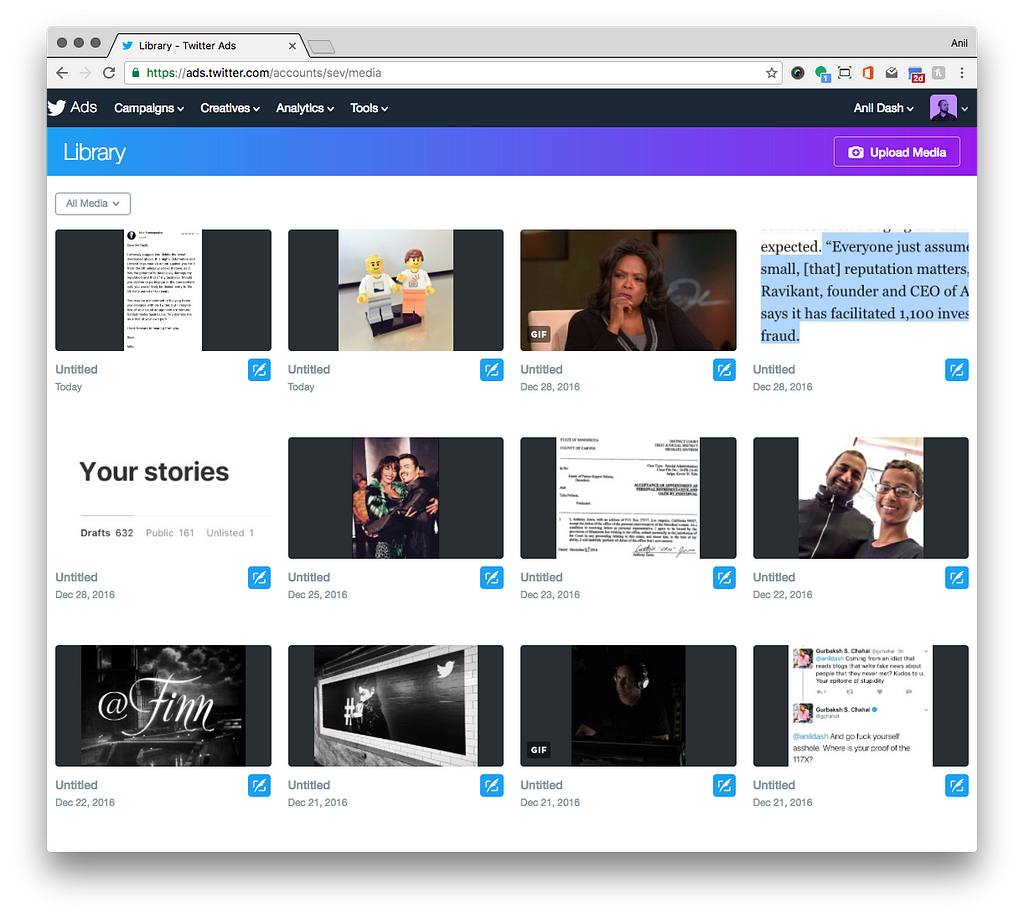
Twitter’s slick new media library creation tool. You can’t have it.
5. Get your shit together for developers and bots
Do you know why I have my cool new job heading up Fog Creek? One reason is because I’m super excited about working with a talented team to make meaningful products. The other reason is because my last startup depended on the Twitter API, and as a result, that product no longer exists. That sucks. We bet that Twitter wanted to help interesting new products be built on top of its platform, and despite all the problems in the past, I got my hopes up when you directly acknowledged those issues (even mentioning me by name!) at your developer conference:
Twitter hasn’t had a developer conference since. The only big platforms being built around Twitter are marketing analytics. Meanwhile, the entire rest of the industry lost its mind with excitement over bots, a market that Twitter used to completely dominate, and Twitter’s APIs were nowhere to be seen.
When we launched Gomix, we built tools to let anybody build a bot (I’m still hoping tons of people remix their own Twitter bots!) but it was shocking to see how much developers were wary of doing anything with Twitter. Twitter went from the place that developers used to say “Hello, world” with their new creations to being a total non-entity.
Despite all the this bad blood with developers, it still wouldn’t be too late for Twitter to embrace being a great bot platform, and a great Internet of Things platform, and to appeal to both Will.I.Am the rapper and Will.I.Am the creator of wearables. Boom Boom Pow. But it comes back to that first point: You gotta ship.
Fight for Twitter
The truth is, these kinds of requests to a publicly-traded company are ridiculous. When they’re sincere, they read like besotted fan-fiction about a corporate entity. When they’re strident, they read like the condescending and superficial rant of an unbearable egotist. And sure, I could just email you or some of the folks on the board and send a note, but well… that wouldn’t be right for Twitter.
I don’t presume that anything I mention here is a new idea, or even that these suggestions are particularly novel. I also know these ideas can add a lot to Twitter’s valuation, but honestly I don’t give a shit about that; it just makes a useful hook to get reluctant readers to take a look.
Honestly, it’s a lot more personal. There are a lot of reasons Twitter still matters to me, and to a lot of us. It’s the last bastion of the old era of blogging or social media that still has huge cultural relevance. It’s the last big company to at least give lip service to some of the values of the web we lost. We idealize Twitter despite its egregious flaws because it still has glints of the best parts of the Internet. But the worst of Twitter has crossed the line into overshadowing the best of Twitter for many people, and if we learn from past social platforms, that kind of phenomenon often reaches a tipping point. Sometimes it feels like Twitter-the-product is fighting a losing battle against Twitter-the-company.
You still have lots of creative people who care enough about Twitter to fix what’s wrong, both inside the company and outside. Now it’s time to do justice to all the energy that’s been expended.
That was fast. Just when you get used to dating with 2016, 2017 comes along. A big thank you to all of you who make this site possible. I thank my lucky stars that this is what I get to do every day, and I hope I get to do it for years to come.
This year I made a conscious effort to learn to visualize data with d3.js. I still used R for exploration and data preparation, but on the presentation side of things, I always tried to go native in the browser first.
The popularity of my experiments and learning exercises took me by surprise. This was the ninth year of FlowingData, and from a pageviews perspective, it was almost twice that of any other year. And keep in mind that blogs were supposed to have died multiple times over already.
A lot of the surge occurred during the first half of the year. My simulator for how you will die spread to millions and millions of people, and the popularity lasted for months. Usually when something I make grows popular, it only lasts for a few days. So yeah, that was nuts.
Then there was everything else after that. Here are the most popular FlowingData posts this year.
Usually I don’t think too much about this awards stuff, because there’s so much subjectivity in the judging. But three’s a trend, right?
Obviously, you can expect more interactive and animated visualization in 2017. There’s still so much to learn. And on that note, you can expect more d3.js tutorials. Although R is still my first love, so I won’t give it up anytime soon.
Thanks again for a great year. I’m looking forward to another.
Apart from mobile networks, another topic that I write about quite often these days is Linux in general and Ubuntu in particular. Ever since I jumped into the Linux world in 2009 it’s been a thrilling and liberating experience and 2016 has been no different. So here’s part 2 of my summary of what moved me in technology in 2016.
Disaster Recovery
You hope it never happens but it does eventually: Your notebook or that of a family member breaks or gets stolen. The device and all data on it is lost without any chance of recovery from that device. It happened to me in January when the notebook of my wife was stolen while she was traveling. But I’ve been preparing for this over the years and I had her system partition and all data safely backup-up. Within 30 minutes I had a spare notebook up and running with the backup of her system partition. Restoring the 500 GB of data took a bit longer due to the limited speed of the USB drive. But after a couple of hours I had a 1:1 clone of her stolen PC with only 2 days of data lost. Details of the story can be found here. Since then I’ve further enhanced my backup/restore procedure and now have a spare SSD to which I only have to replicate the latest data backup. In 15 minutes I can now deliver a fully working identical copy of our work PCs with all data restored.
New Ubuntu LTS 16.04
Every two years, Ubuntu delivers a new long term release. This year I was keen to update early as I had a nasty kernel bug in my 32-bit Ubuntu 14.04 installation that grew worse and worse the more RAM I installed in my notebook to run more virtual machines simultaneously. To my great relief, the kernel bug was gone after installing the 64-bit version of Ubuntu 16.04. So finally I could enjoy 16 GB of memory and run 3 virtual machines simultaneously without running into trouble. So apart from the kernel bug was it worth upgrading? ‘It depends’ is the classic answer and you can find the details here.
The File Explorer and SSH for Remote File Access
One thing that must have been there for years without me noticing is that Ubuntu’s file explorer can access remote files over SSH. Fully encrypted, and with password or certificate authentication it’s easy to use and a great extension to just using ssh to get to a shell on a remote system. Copying files with SCP from the shell is great but doing it via the file explorer is, in many cases, far more convenient. It doesn’t sound like much but in practice it makes a huge difference.
VPN Leaks – Where there is light, there is shadow
One thing that has not been fixed until today is a pretty nasty VPN bug in Ubuntu 16.04 which unfortunately makes the DNS resolver circumvent the VPN tunnel and thus exposes DNS queries to the local network if IPv4 and IPv6 is used on the local network. This is one of the main things that a VPN is supposed to protect the user from. As nobody seemed to care I came up with my own fix. It’s quick, it’s dirty, but it works.
There we go, this is what moved me in the Linux domain in 2016. In the final part of have some noteworthy miscellaneous stuff.
On my to do list for next year is to finally get round to doing something consistently with open data in an Isle of Wight context, probably on isleofdata.com. One of the things I particularly want to explore are customisable WordPress plugins that either source data from on online data source or that can be configured as part of an external publishing system.
For example, the following code, saved as MultiMarkerLeafletMap2.php and zipped up implements a WordPress plugin that can render an interactive leaflet map with clustered markers.
<?php
/*
Plugin Name: MultiMarkerLeafletMap2
Description: Shortcode to render an interactive map displaying clustered markers. Markers to be added as JSON. Intended primarily to supported automated post creation. Inspired by folium python library and Google Maps v3 Shortcode multiple Markers WordPress plugin
Version: 1.0
Author: Tony Hirst
*/

function MultiMarkerLeafletMap2_custom_styles() {

	wp_deregister_style( 'oi_css_map_leaflet' );
	wp_register_style( 'oi_css_map_leaflet', '//cdnjs.cloudflare.com/ajax/libs/leaflet/0.7.3/leaflet.css',false, '0.7.3' );
	wp_enqueue_style( 'oi_css_map_leaflet' );

	wp_deregister_style( 'oi_css_map_bootstrap' );
	wp_register_style( 'oi_css_map_bootstrap', '//maxcdn.bootstrapcdn.com/bootstrap/3.2.0/css/bootstrap.min.css', false, '3.2.0' );
	wp_enqueue_style( 'oi_css_map_bootstrap' );

	wp_deregister_style('oi_css_map_bootstrap_theme');
	wp_register_style('oi_css_map_bootstrap_theme','//maxcdn.bootstrapcdn.com/bootstrap/3.2.0/css/bootstrap-theme.min.css',false,false);
	wp_enqueue_style( 'oi_css_map_bootstrap_theme');

	wp_deregister_style('oi_css_map_fa');
	wp_register_style('oi_css_map_fa','//maxcdn.bootstrapcdn.com/font-awesome/4.1.0/css/font-awesome.min.css',false,false);
	wp_enqueue_style( 'oi_css_map_fa');

	wp_deregister_style('oi_css_map_lam');
	wp_register_style('oi_css_map_lam','//cdnjs.cloudflare.com/ajax/libs/Leaflet.awesome-markers/2.0.2/leaflet.awesome-markers.css',false,false);
	wp_enqueue_style( 'oi_css_map_lam');

	wp_deregister_style('oi_css_map_lmcd');
	wp_register_style('oi_css_map_lmcd','//cdnjs.cloudflare.com/ajax/libs/leaflet.markercluster/0.4.0/MarkerCluster.Default.css',false,false);
	wp_enqueue_style( 'oi_css_map_lmcd');

	wp_deregister_style('oi_css_map_lmc');
	wp_register_style('oi_css_map_lmc','//cdnjs.cloudflare.com/ajax/libs/leaflet.markercluster/0.4.0/MarkerCluster.css',false,false);
	wp_enqueue_style( 'oi_css_map_lmc');

	wp_deregister_style('oi_css_map_lar');
	wp_register_style('oi_css_map_lar','//birdage.github.io/Leaflet.awesome-markers/dist/leaflet.awesome.rotate.css',false,false);
	wp_enqueue_style( 'oi_css_map_lar');

}

function MultiMarkerLeafletMap2_custom_scripts() {

	wp_deregister_script( 'oi_script_leaflet' );
	wp_register_script( 'oi_script_leaflet', '//cdnjs.cloudflare.com/ajax/libs/leaflet/0.7.3/leaflet.js',array('oi_script_jquery'),'0.7.3');
	wp_enqueue_script( 'oi_script_leaflet' );

	wp_deregister_script( 'oi_script_jquery' );
	wp_register_script( 'oi_script_jquery', '//ajax.googleapis.com/ajax/libs/jquery/1.11.3/jquery.min.js', false, '1.11.3' );
	wp_enqueue_script( 'oi_script_jquery' );

	wp_deregister_script( 'oi_script_bootstrap' );
	wp_register_script( 'oi_script_bootstrap', '//maxcdn.bootstrapcdn.com/bootstrap/3.2.0/js/bootstrap.min.js',false,'3.2.0');
	wp_enqueue_script( 'oi_script_bootstrap' );

	wp_deregister_script( 'oi_script_lam' );
	wp_register_script( 'oi_script_lam', '//cdnjs.cloudflare.com/ajax/libs/Leaflet.awesome-markers/2.0.2/leaflet.awesome-markers.js',array('oi_script_leaflet'),'2.0');
	wp_enqueue_script( 'oi_script_lam' );

	wp_deregister_script( 'oi_script_lmc' );
	wp_register_script( 'oi_script_lmc', '//cdnjs.cloudflare.com/ajax/libs/leaflet.markercluster/0.4.0/leaflet.markercluster.js',array('oi_script_leaflet'),'0.4.0');
	wp_enqueue_script( 'oi_script_lmc' );

	wp_deregister_script( 'oi_script_lmcsrc' );
	wp_register_script( 'oi_script_lmcsrc', '//cdnjs.cloudflare.com/ajax/libs/leaflet.markercluster/0.4.0/leaflet.markercluster-src.js',array('oi_script_leaflet'),'0.4.0');
	wp_enqueue_script( 'oi_script_lmcsrc' );

}
add_action( 'wp_enqueue_scripts', 'MultiMarkerLeafletMap2_custom_scripts' );
add_action( 'wp_enqueue_scripts', 'MultiMarkerLeafletMap2_custom_styles' );

// Add items to header
add_action('wp_head', 'MultiMarkerLeafletMap2_header');
add_action('wp_head', 'MultiMarkerLeafletMap2_fix_css');

function MultiMarkerLeafletMap2_fix_css() {
	echo '<style type="text/css">#map {
        position:absolute;
        top:0;
        bottom:0;
        right:0;
        left:0;
      }</style>' . "\n";
 }

function MultiMarkerLeafletMap2_header() {
}

function MultiMarkerLeafletMap2_call($attr) {
// Generate the map template

	// Default attributes - can be overwritten from shortcode
	$attr = shortcode_atts(array(
									'lat'   => '0',
									'lon'    => '0',
									'id' => 'oimap_1',
									'zoom' => '7',
									'width' => '600',
									'height' => '400',
									'type' => 'multimarker',
									'markers'=>''
									), $attr);

	$html = '<div class="folium-map" id="'.$attr['id'].'" style="width: '. $attr['width'] .'px; height: '. $attr['height'] .'px"></div>
<script type="text/javascript">
      var base_tile = L.tileLayer("https://{s}.tile.openstreetmap.org/{z}/{x}/{y}.png", {
          maxZoom: 18,
          minZoom: 1,
          attribution: "Map data (c) OpenStreetMap contributors - http://openstreetmap.org"
      });

      var baseLayer = {
        "Base Layer": base_tile
      };

      /*
      list of layers to be added
      */
      var layer_list = {

      };
      /*
      Bounding box.
      */
      var southWest = L.latLng(-90, -180),
          northEast = L.latLng(90, 180),
          bounds = L.latLngBounds(southWest, northEast);

      /*
      Creates the map and adds the selected layers
      */
      var map = L.map("'.$attr['id'].'", {
                                       center:['.$attr['lat'].', '.$attr['lon'].'],
                                       zoom: '.$attr['zoom'].',
                                       maxBounds: bounds,
                                       layers: [base_tile]
                                     });

      L.control.layers(baseLayer, layer_list).addTo(map);

      //cluster group
      var clusteredmarkers = L.markerClusterGroup();
      //section for adding clustered markers
      ';

    if($attr['type']=='multimarker'){
	// Get our custom fields
	global $post;

	$premarkers=get_post_meta( $post->ID, 'markers', true );
	$markers = json_decode($premarkers,true);
	$legend = get_post_meta( $post->ID, 'maplegendtemplate', true );
	$legendkeys = get_post_meta( $post->ID, 'maplegendkeys', true );

	if (count($markers)>0){
		for ($i = 0;$i < count($markers);$i ++){
			$popup=$legend;
			foreach (explode(',', $legendkeys) as $k) {
				$popup=str_replace("%".$k."%",$markers[$i][$k],$popup);
			};

			$html .='
			     var marker_'.$i.'_icon = L.AwesomeMarkers.icon({ icon: "info-sign",markerColor: "blue",prefix: "glyphicon",extraClasses: "fa-rotate-0"});
      var marker_'.$i.' = L.marker(['.$markers[$i]['lat'].','.$markers[$i]['lon'].'], {"icon":marker_'.$i.'_icon});
      marker_'.$i.'.bindPopup("'.$popup.'");
      marker_'.$i.'._popup.options.maxWidth = 300;
      clusteredmarkers.addLayer(marker_'.$i.');

      	';

		}
	}
    }

	$html .= '//add the clustered markers to the group anyway
      map.addLayer(clusteredmarkers);</script>';
	return $html;
	?>

<?php } add_shortcode('MultiMarkerLeafletMap2', 'MultiMarkerLeafletMap2_call'); ?>
Data is passed to the plugin embedded in a WordPress post via three custom fields associated with the post:
markers: a JSON list that contains information associated with each marker;
maplegendkeys: a comma separated list of key values that refers to keys in each marker object that are referenced when constructing the popup legend for each marker;
maplegendtemplate: a template that is used to construct each popup legend, of the form ‘Asset type: %typ% (%loc%)’, where the %VAR% elements identify key vales VAR associated with object attributes in the markers list.
In the set up I have, the post content – including the plugin code – is generated from a Python script running in a Jupyter notebook that can be posted using the following code fragment:
#!pip3 install python-wordpress-xmlrpc

from wordpress_xmlrpc import Client, WordPressPost
from wordpress_xmlrpc.compat import xmlrpc_client
from wordpress_xmlrpc.methods import media, posts
from wordpress_xmlrpc.methods.posts import NewPost

wpoi = Client(WORDPRESS_BLOG_URL+'/xmlrpc.php', 'robot1', WORDPRESS_API_KEY)

def wp_customPost(client,title='ping',content='pong, <em>pong<em>',custom={}):
    post = WordPressPost()
    post.title = title
    post.content = content
    post.custom_fields = []
    for c in custom:
        post.custom_fields.append({
            'key': c,
            'value': custom[c]
        })
    response = client.call(NewPost(post))
    return response
A list of objects is created from a pandas dataframe where each object contains the information associated with each marker – we limit the list to only include items for which we have latitude and longitude information:
A post is then constructed that includes a reference to the plugin (as part of the text of the body of the post) and the data that is to be passed to the custom variables.
import json

#txt contains the content for the blog post
txt="[MultiMarkerLeafletMap2 zoom=11 lat=50.675 lon=-1.31 width=800 height=500]"
txt='{}{}'.format(txt,'
<div><em>Data produced by <a href="https://www.iwight.com/Council/transparency/Our-Assets/Transparency-Our-Assets/Property">Isle of WIght Council</a>.</div>
')

#jsondata contains the custom variable data that will be associated with the post
jsondata={'markers':json.dumps( jd1.tolist() ),
          'maplegendkeys':'typ,tenure,location,loc',
          'maplegendtemplate':'Asset type: %typ% (%loc%)<br/>Tenure: %tenure%<br/>%location%'}

wp_customPost(wpoi, "Properties on the Isle of Wight Council property register", txt, jsondata)
And no, we are not talking about any current holiday trend, but the group of Asian ladies of a certain age who have divvied up the “turf” of single-family housing areas in Vancouver. They collect bottles and redeemable containers from blue box recycling containers on recycle collection days. Some are pleasant, and respectful, and know all the neighbours. Others are more demanding, going onto properties and in garages to retrieve their booty. One local bottle lady tucks her treasures in a late-model car. But what is the life of these women, how do they divide their territories and how does it all work?
Marcus Gee of the Globe and Mail also wondered how these ladies operate in Toronto, and armed with a translator approached them. Marcus notes: “Big, complex cities such as Toronto contain worlds within worlds, many of them unknown to each other. The world of the bottle ladies is one of the city’s most obscure. Social agencies that track downtown poverty and work with the Chinese community admit they don’t know much about who they are or what drives them, although they think some may have dementia or hoarding issues.”
“Despite their old clothes and their willingness to trudge the streets for a few dollars, most are not homeless or desperately poor. Many have families. Quite a few have a government pension or other income. Many live with a son or daughter and spend the daytime caring for grandchildren. They insist they never take money from anyone. The last thing they want is charity or pity.”
“They go out collecting, they say, to bring in a little spending money and to keep active in their later years. That’s not unusual in China, where garbage picking has been refined into an art. Even in prosperous Hong Kong, wizened, bent women can be seen pushing carts piled high with scrap cardboard down busy city streets. Many bottle ladies, it turns out, come from neighbouring parts of southern China, especially Taishan, in the Pearl River Delta.”
Marcus also found that one bottle lady actually leaves gifts and tokens for customers who left bottles out for her, and collected to stay active. “The phrase she used to describe herself is “ngaii duk,” a Cantonese term to describe someone who can endure hardship with fortitude.”
An article in the South China Post published in 2014 found that nearly 70 per cent of vulnerable Hong Kong seniors collected recycling to pay for basic housing and food costs. It is also a part of Vancouver life dominated by one cohort of ladies who have wholeheartedly embraced the bottle collecting task. The Globe and Mail article gives a glimpse into the reasons why.
In a brilliant flash of seasonal inspiration, The BBC reports on the jogging patterns of Owen Delaney who is using his Strava application on his smartphone not only to track his running routes but to create public art .
Now it must be strange to see this individual running in a park-but in his jogs, he has created on his GPS tracker images of Santa Claus, a snowman, and even a Christmas cracker.
Mr. Delaney’s festive art work on the fitness tracking application will continue through the Christmas season. To create these artistic runs requires about one hour of preplanning to ensure he does not go through streams or ravines.
“I used to draw a lot of cartoons when I was younger, and sometimes made hand drawn Christmas cards for people,” Mr Delaney said. “I guess this is a similar theme, but I never imagined being able to use the park as a canvas…we could all do with something simple and happy this year I think.”
Many thanks to Brian Gable in today’s Globe and Mail. Here’s wishing that 2016 is the apex of awful, and that better thoughts will predominate when we review 2017.
In a year where I spent more time than ever making and releasing my own music, I still found time to hear a whole bunch of new (and new to me) music. Here’s my favourite 11 albums from the last 12 months – give ’em a listen, and buy the ones you like.
I heard this album in its unfinished state back in January in LA. I’d heard a couple of the songs as they were being written (and played improvised versions of them on a gig with Divi in 2015) but was still knocked out by just how great this album is. It’s an extraordinary statement, a labour of love, and the sound of someone throwing their everything into a project, and it working. I love everything about this.
Together, As One – Dinosaur
Together, As One by Dinosaur
Laura Jurd’s latest band – I love her trumpet playing on everything I’ve heard her on. This takes something of the vibe of 70s Miles and takes it on a beautiful journey. This benefits from extended repeat listening. I can’t imagine ever getting tired of this album.
New Hope & Social albums are interesting, because listening to old Hope & Social albums is so heavily associated with memories of seeing them live. They are, after all, my favourite live band in the world. This album stands on its own two feet and I can’t wait to hear all these songs live. Everything they do is wonderful.
Also a contender for favourite gig of the year, this is Kristin’s new album that was released as a book with accompanying CDs, rather than a regular music release, but I’ve just found that it’s also on Bandcamp. It is, as expected from Kristin, an amazing collection of songs – she plays everything and never shies away from allowing the music and lyrics to be unsettling where necessary. A rich, rewarding journey that I’m going to be revisiting a LOT throughout 2017.
New Jonatha records usually take me a few listens to get into, cos she doesn’t stand still, and I have such a huge love for her earlier albums. This took a few spins to properly love, but now I adore it. Amazing songwriting, a properly deep probing lyrical journey, and some amazing arrangements.
Properly beautiful hip-hop/nu soul/funky organic electronica project from one of my favourite producers in the world.
Kin – KT Tunstall
Another one that took a while to get properly into – KT reintroducing the fun rocking element of her earlier records, following the more downbeat sound of much of the last record. Loving it.
The Violent Sleep Of Reason – Meshuggah
Meshuggah do what they do and do it better than anyone. This record has more swagger and sway to it than some of their earlier records, and is all the better for it.
Dissociation – Dillinger Escape Plan
The swansong from an amazing band – as dizzying and disturbing as you’d expect, and (if you can imagine it) perhaps even more diverse than previous albums. Amazing.
Eden – Ivy Sole
Eden by Ivy Sole
A surprise recommendation from a friend who works at Bandcamp – soulful hip hop that I’ve played a LOT this year.
Jasper took a little time out from Phronesis this year for other projects – this fabulous quintet record, with Laura Jurd on trumpet and Mark Lockheart on sax is full of interestingness and beauty.
So - I don't know. Do I want my mobile phone to accept bluetooth messages from the ambient environment? This article touts it as a good thing. "If a beacon is addressing your mobile device, you won’ t even know it’ s there until your device responds, possibly offering up some information that you’ re only just realizing you need. If you’ re holding the beacon, personalized content might instantly appear as you approach a learning station." The problem with such systems in the past has always been spam and malware. There's no reason to believe these won't plague the current iteration.
This is a high-level overview of how artificial intelligence works (some of it, at least) and how it will shape e-learning in the future. The article cautions (and I agree) that AI is just a tool. "Holding the creators of algorithms liable is not technically fair though. The systems learn from the data being processed, not from the algorithms themselves. And in verticals where safety and compliance is non-negotiable, such as a learning environment, this could present a radical problem." The same applies to human learning. We don't have built-in content algorithms. Learning depends on the experiences we present to learners (or the experiences they are able to find for themselves).
I think this is probably a useful service but only Forbes would call starting a for-profit education business as "paying it forward". Anyhow, here's the gist: "FrontLearners offers schools an out-of-the-box, end-to-end e-learning solution. Participating classrooms receive a kit that includes a server loaded with content, a router to establish a wi-fi connection, and tablets that students use to follow their teachers’ lessons." The software offering, which is based on a Moodle platform, offers what they call a "blended mastery learning method."
Tinkering is a deceptively high-value activity. You don’t usually allocate much time to tinkering because the obvious value of tinkering is low. You don’t start tinkering with a goal in mind; you start with pure curiosity. I’ve heard about this thing, but I’ve never used it.How does this thing work?I’ve always wanted to know about more about X.
Downtime is an easy time to tinker. Nothing is pressing, so these acts of mental wandering are acceptable. I’ve spent a significant amount of the holiday break tinkering, and as with all tinkering binges, I am reminded that tinkering isn’t fumbling through random ideas, tinkering is mindful structured learning.
Here’s what I’ve been tinkering with for the past two weeks:
There’s a new book coming in the next year. I’m writing a good portion of it before approaching publishers. In the past, I’ve dumped chapters into a Dropbox folders with a half-thought-out naming scheme. It’s fine, but somewhere around 20 chapters, I change my naming scheme or perform a lobotomy on the table of contents. As I’m laboriously changing titles and chapter numbers in the surprisingly hostile Finder, I dream of a better way.
Bear is a better way as I’ve written before. Add a tag anywhere in the document, and that tag instantly appears as an organizing mechanism in the left bar. Add a tag/sub-tag, and you’ve got a tag hierarchy which means I’ve got a simple editable book organizing structure. In just under an hour, the entire book is now inside of a dynamic information architecture within Bear.
I’ve been preparing the site to WPEngine in the new year. WPEngine is service devoted to running WordPress – that’s all they do. On my MediaTemple instance, WordPress is intolerably slow. A quick import of the Rands content to WPEngine revealed WordPress performance is downright spunky. There is no SSH access to WPEngine, so I’ll abandon a couple of tools including Shaun Inman’s Mint which I’ve used religiously since 2005. However, Shaun is moving on and so shall I.
After a couple of nights of intense tinkering, I can confirm, “There’s a shit ton of information inside Google Analytics.” I’ve had Google Analytics installed for as long as Mint, but have never used it. An answer to every obscure question I had about my traffic for the last decade is sitting somewhere inside of Google Analytics.
Also, sometime in the past few years, analytics spam has become a thing, I know this because I keep finding reports like this one:
While I am puzzled why Google hasn’t built preventative measures into Google Analytics, additional tinkering revealed a wealth of resources on the Internet to help configure Analytics to filter out this crap traffic.
I’ve been tinkering with a new R. More on this in the new year.
Newsblur has been my RSS reader since the passing of Google Reader in 2013. Newsblur is a fine newsreader but has two lingering issues: one mine, one theirs.
My self-inflicted issue involves keyboard support. Consuming RSS feeds is a task best done at a speed which means sensible keyboard support is required. Newsblur’s keyboard support is good, but once every 27 interactions, I’d randomly save a story or tag it. I never save or tag stories, so there suddenly there’d be this story hanging around for unknown reasons. Again, fixing this means “reading the documentation” and that’s on me, but it’s a design flaw that I easily interrupt my flow with an errant stroke of the keyboard.
Newsblurs’s larger issue is performance. Nine out of ten times stories loaded fine, but 10% of the time I sat there waiting for 5-10 seconds for a story to load. Again, a hangnail annoyance, but enough friction that I started tinkering with RSS readers.
Feedly is scary fast, provides a clean design, and offer just enough keyboard support. Highly recommend tinkering here.
Lastly, I live in a forest, and in a forest, you deal with trees. Whether it’s dead trees, fallen branches, cleaning up leaf-infested drive ways, or just preserving the view, power tools are a fact of life, and until recently the best tools required gasoline.
Gasoline is expensive, hard to store, and bad for the environment. Gas-powered engines are loud polluters that are apt to fail when you need them. The combination of power tools plus gasoline have felt like a necessary evil to live in the mountains, but this holiday purged that evil.
The Stihl 14 inch chain saw is powered by a large lithium-ion battery. With constant usage, the battery will allegedly last 20 to 30 minutes, but normal usage where you are cutting a bit, moving down the hills, and cutting some more equals several hours of usage with a single battery. Add instant torque provided by an electric motor, and I’m feeling pretty good. Remove almost all gasoline from the equation (the chain requires bar oil), and I’m delighted.
The battery doesn’t just work with the chainsaw. Stihl provides a whole suite of tools that use the same battery which means all the “gas” for a new leaf blower and a future weed whacker has already been purchased.
Battery life is my biggest concern. Even with a reasonable fast charge, having to stop mid-project could be a productivity buzz kill, but battery life exploration is how I’ll tinker today.
Before you know it, it’ll be April, and we’ll all be consumed with endless lists of interesting and urgent things to do. I’ll gleefully jump from one item to the next priding myself on my adept context switching abilities. Efficient? For sure. Productive? Maybe. Creative? Not really. Tinkering. Nope.
Mark my words: GoPro is toast. This company will not survive their own stupidity. Not only did they try to build a drone from scratch and launched it without a test. And then had to call back every single one of them when they fell out of the sky. Not only did they get pummeled by the incumbent DJI and their Mavic Pro.
No, not only that. Now somebody has decided that you cannot use their existing remote control software without a login to a "GoPro+" account. And you need to be connected to the Internet to do that. How do you connect to the camera? You enable a Wifi access point, then connect your phone to that access point, then you talk to your camera. That is complicated enough. But now that remote control software wants access to cellular data so it fcuking can log you in. Oh, great.
What is the problem, you say? GoPro are used everywhere. No connection required. Until now.
The CS faculty has decided to create common syllabi for all courses
in the department. The motivation to do this came from several
directions, including a need to meet university requirements
regarding "outcomes assessment" and a desire to make sections
taught by different instructors more consistent within and across
semesters. But it will also help instructors improve their courses.
Faculty teaching upper-division courses will have a more better
sense of what students coming into their courses should already
know, and faculty teaching lower-division courses will have a
better sense of what students their students need to be able to do
in their upcoming courses.
Our first pass at this is for each faculty member to use a common
format to describe one of his or her courses. The common format
requires us to define in some detail the purpose, goals, outcomes,
and content of the course. Of course, we all have syllabi for our
courses that cover some or all of these things, but now we are
expected to make all the elements concrete enough that the syllabus
can be used by other faculty to teach the course.
For my first attempt, I decided to write an extended syllabus for
my Programming Languages and Paradigm course, which I am teaching
again in the spring. I have been teaching this course for years,
have detailed lecture notes for every session (plus many more), and
already give students a syllabus that tries to explain in a useful
way the purpose, goals, outcomes, and content of the course. That
should give me a running start, right?
I've been working on putting my current syllabus's content into
the extended syllabus format for several hours now. At this point,
I have concluded that the process is three things: instructive,
likely to be very helpful in the long run, and very hard to do.
Defining detailed goals and outcomes is instructive because it
causes me to think about the course both at the highest level of
detail (the goal of the course both in our curriculum and in our
students' CS education) and at the lowest (what we want students
our students to know and be able to do to when they leave the
course). After teaching the course for many years, I tend to
think big-picture thoughts about the course only at the beginning
of the semester and only in an effort make general modifications
to the direction it takes. Then I think about finer details on
a unit-by-unit and session-by-session basis, slowly evolving the
course content in reaction to specific stimuli. Looking at the
course across multiple levels of abstraction at the same time is
teaching me a lot about what my course is and does in a way that
I don't usually see when I'm planning only at the high level or
executing only at the day-to-day level.
One specific lesson I've learned is really a stark reminder of
something I've always known: some of my sessions are chock-full
of stuff: ideas, techniques, code, examples, .... That is great
for exposing students to a wide swath of the programming languages
world, but it is also a recipe for cognitive overload.
This process is helpful because it causes me think about concrete
ways I can make the course better. I am finding holes in my
coverage of certain topics and leaps from one concept to another
that are intuitive in my mind but not documented anywhere.
I've been taking notes as I go long detailing specific changes I
can make this spring:
to session materials, so that they give more examples of
new concepts before I ask students to use the concepts in
their work
to homework assignments, so that they emphasize specific
goals of the course more clearly and to cover goals that
seem to have lost coverage over time
to exams, so that they assess the outcomes we hope to
achieve in the course
Designing class sessions, homework, and exams in terms of goals
and outcomes creates a virtuous cycle in which the different
elements of the course build on and reinforce one another. This
is perhaps obvious to all you teachers out there, as it is to me,
but it's easy to lose sight of over time.
But my most salient conclusion at this moment is that this is
hard. It is difficult to explain the course in enough detail
that faculty outside the area can grok the course as a part of
our curriculum. It's difficult to explain the course in enough
detail that other faculty could, at least in principle, teach it
as designed. It's difficult to design a course carefully enough
to be justifiably confident that it meets your goals for the
course. That sounds a little like programming.
But I'm glad I'm doing it. It's worth the effort to design a
course this carefully, and to re-visit the design periodically.
That sounds a little like programming, too.
Mike Caulfield’s Digital Polarization Initiative (DigiPo) is a template for a course that will lead students through exercises to analyze and fact-check news stories. The pedagogical approach Mike describes here is evolving; in parallel I’ve been evolving a toolkit to help students research and organize the raw materials of the analyses they’ll be asked to produce. Annotation is a key component of the toolkit. I’ve been working to integrate it into the fact-checking workflow in ways that complement the use of other tools.
We’re not done yet but I’m pleased with the results so far. This post is an interim report to summarize what we’ve learned so far about building an annotation-powered toolkit for fact checkers.
Here’s an example of a DigiPo claim to be investigated:
EPA Plans to Allow Unlimited Dumping of Fracking Wastewater in the Gulf of Mexico (see Occupy)
I start with no a priori knowledge of EPA rules governing release of fracking wastewater, and only a passing acquaintance with the cited source, occupy.com. So the first order of business is to marshal some evidence. Hypothesis is ideal for this purpose. It creates links that encapsulate both the URL of a page containing found evidence, and the evidence itself — that is, a quote selected in the page.
There’s a dedicated page for each DigiPo investigation. It’s a wiki, so you can manually include Hypothesis links as you create them. But fact-checking is tedious work, and students will benefit from any automation that helps them focus on the analysis.
The first step was to include Hypothesis as a widget that displays annotations matching the wiki id of the page. Here’s a standalone Hypothesis view that gathers all the evidence I’ve tagged with digipo:analysis:gulf_of_frackwater. From there it was an easy next step to tweak the wiki template so it embeds that view directly in the page:
That’s really helpful, but it still requires students to acquire and use the correct tag in order to populate the widget. We can do better than that, and I’ll show how later, but here’s the next thing that happened: the timeline.
While working through a different fact-checking exercise, I found myself arranging a subset of the tagged annotations in chronological order. Again that’s a thing you can do manually; again it’s tedious; again we can automate with a bit of tag discipline and some tooling.
If you do much online research, you’ll know that it’s often hard to find the publication date of a web page. It might or might not be encoded in the URL. It might or might not appear somewhere in the text of the page. If it does there’s no predictable location or format. You can, however, ask Google to report the date on which it first indexed a page, and that turns out to be a pretty good proxy for the publication date.
So I made another bookmarklet to encapsulate that query. If you were to activate it on one of my posts it would lead you to this page:
I wrote the post on Oct 30, Google indexed it on Oct 31, that’s close enough for our purposes.
I made another bookmarklet to capture that date and add it, as a Hypothesis annotation, to the target page.
With these tools in hand, we can expand the widget to include:
Timeline. Annotations on the target page with a googledate tag, in chronological order.
Related Annotations. Annotations on the target page with a tag matching the id of the wiki page.
You can see a Related Annotations view above, here’s a Timeline:
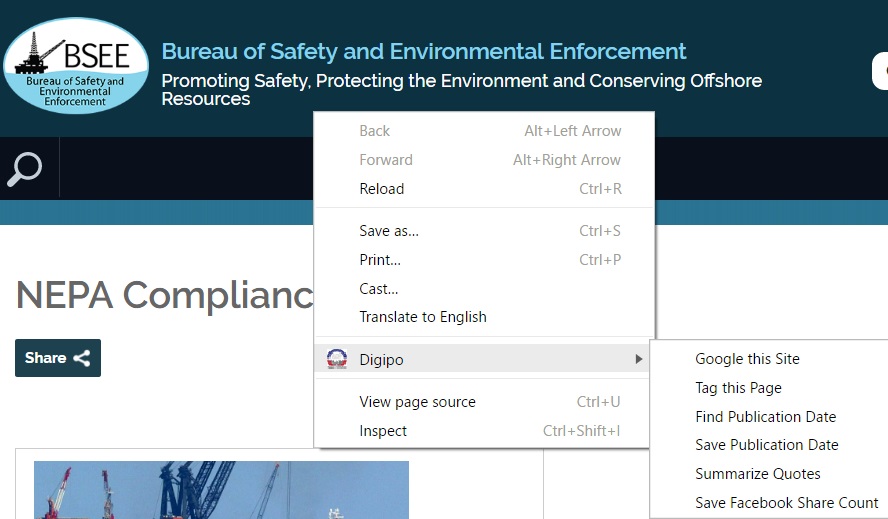
So far, so good, but as Mike rightly pointed out, this motley assortment of bookmarklets spelled trouble. We wouldn’t want students to have to install them, and in any case bookmarklets are increasingly unlikely to work. So I transplanted them into a Chrome extension. It presents the growing set of tools in our fact-checking toolkit as right-click options on Chrome’s context menu:
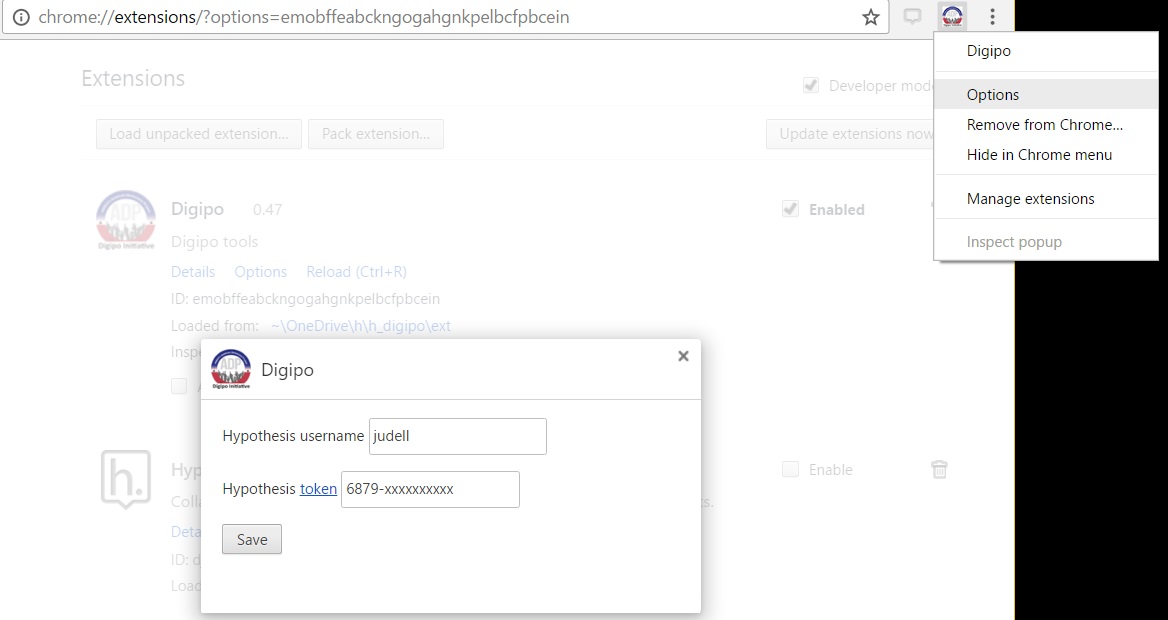
It also affords a nice way to stash your Hypothesis credentials, so the tools can save annotations on your behalf:
(The DigiPo extension is Chrome-only for now, as is the Hypothesis extension, but WebExtensions should soon enable broader coverage.)
With the bookmarklets now wrapped in an extension we returned to the problem of simplifying the use of tags corresponding to wiki investigation pages. Hypothesis tags are freeform. Ideally you’d be able to configure the tag editor to present controlled lists of tags in various contexts, but that isn’t yet a feature of Hypothesis.
We can, though, use the Digipo extension to add a controlled-tagging feature to the fact-checking toolkit. The Tag this Page tool does that:
You activate the tool from a page that has evidence related to a DigiPo investigation. It reads the DigiPo page that lists investigations, captures the wiki ids of those pages. and presents them in a picklist. When you choose the investigation to which the current page applies, the current page is annotated with the investigation’s wiki id and will then show up in the Related Annotations bucket on the investigation page.
While I was doing all this I committed an ironic faux pas on Facebook and shared this article. Crazy, right? I’m literally in the middle of building tools to help people evaluate stuff like this, and yet I share without checking. Why did I not take the few seconds required to vet the source, bipartisanreport.com?
When I made myself do that I realized that what should have taken a few seconds took longer. There’s a particular Google advanced query syntax you need in this situation. You are looking for the character string “bipartisanreport.com” but you want to exclude the majority of self-referential pages. You only want to know what other sites say about this one. The query goes like this:
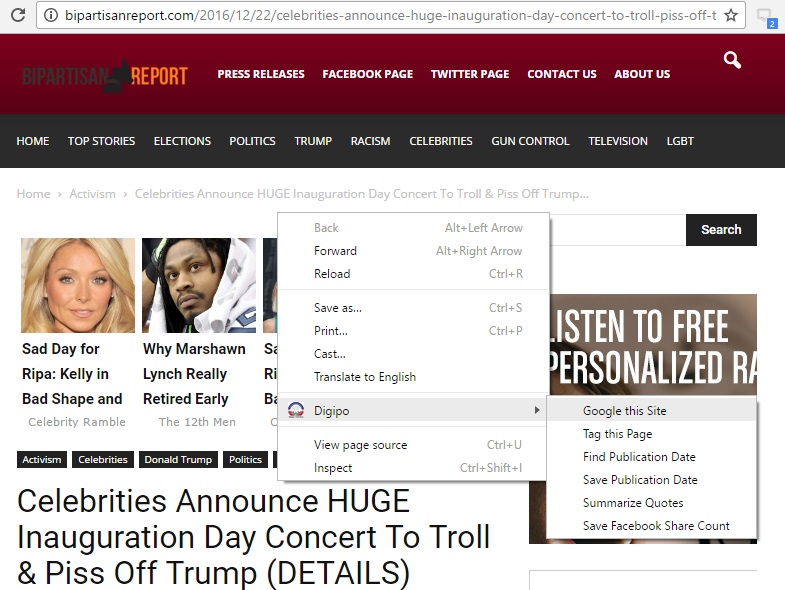
Just knowing the recipe isn’t enough. Using it needs to be second nature and, even for me, it clearly wasn’t. So now there’s Google this Site:
Which produces this:
It’s ridiculously simple and powerful. I can see at a glance that bipartisanreport.com shows up on a couple of lists of questionable sites. What does the web think about the sites that host those lists? I can repeat Google this Site to zoom in on them.
How, for example, has this questionable claim propagated on Facebook? There’s a breadcrumb trail in the annotation layer. On Dec 26 I used Save Publication Date to assign the tag googledate:2016-08-31, and on the same day I used Save Facebook Share Count to record the number of shares reported by the Facebook API. On Dec 30 I again used Save Facebook Share Count. Now we can see that the article is past its sell-by date on Facebook and never was highly influential.
Some of the annotations contain Hypothesis direct links to related annotations. If you open this annotation in the Politico article, for example, you can follow Hypothesis links to related annotations on pages at USA Today and Science.
These transitive annotations are potent but it gets to be a lot of clicking around. So the most experimental of the tools in the kit, Summarize Quotes, produces a page like this:
This approach doesn’t feel quite right yet, but I suspect there’s something there. Using these tools you can gather a lot of evidence pretty quickly and easily. It then needs to be summarized effectively so students can reason about the evidence and produce quality analysis. The toolkit embodies a few ways to do that summarization, I’m sure more will emerge.
A spirit bear in the Great Bear Rainforest (photo: Ian McAllister)
As 2016 draws to a close, we reflect on the highlights, surprises, challenges and tragedies of the year that was. If we are to believe popular opinion, 2016 was a terrible year. The war in Syria became increasingly catastrophic. A man who has repeatedly denied the existence of climate change became President of the World’s largest democracy. We lost the artistic genius of Prince, David Bowie, George Michael, Leonard Cohen, Carrie Fisher and many others.
What’s left to celebrate?
I worked with my team at MODUS to develop a list of some of our favourite things that happened in 2016, especially those things that strengthened our communities and our world.
All of these stories serve to remind us that our governments, businesses, non-profits and we as citizens have the power to save the planet.
1. The Paris Agreement – At the Paris climate conference, 195 countries adopted the first-ever universal and legally-binding global climate deal. The agreement sets out a global action plan to put the world on track to avoid dangerous climate change by limiting global warming to well below 2°C.
2. Canada’s Commitment to the Paris Agreement - For the first time in Canada, the government is pricing carbon pollution as part of the country’s commitment to the Paris Agreement. In March 2016, all Canadian provinces adopted the Pan-Canadian Framework on Clean Growth and Climate Change to invest in clean energy and reduce carbon emissions.
3. Robson Square Plaza - The City of Vancouver made a monumental decision this year to close the 800 block of Robson Street, which runs through Robson Square, Vancouver’s main public plaza in the heart of downtown. With this closure, Robson Square will become downtown Vancouver’s largest public space. And the north side of the Art Gallery is getting a fresh new plaza design as well.
4. Renewable Energy is “Crushing” Fossil Fuels – Clean energy investment broke new records in 2015 and is now seeing twice as much global funding as fossil fuels. To prove this, California is now powering over 6 million homes with solar power, a record in the US, and Portugal ran its entire nation solely on renewable energy for four days straight.
5. Public Transit Investments – The Lower Mainland’s transit referendum may have failed, but Los Angeles residents voted in favour of a permanent sales tax increase to fund a major expansion of the county’s public transit system. Measure M will bring in $860 million annually for decades and will fund expanded subway lines, sidewalk improvements, cycling infrastructure, bike share expansion, and a network of greenways. Locally, Metro Vancouver celebrated the expansion of its rapid transit network with the opening of the Evergreen Line in December.
6. Zero Waste in Vancouver – The City of Vancouver is the first large city in the world to commit to a zero waste target. As part of its ambitious goal to become the Greenest City in the World by 2020, Vancouver has already reduced solid waste going to landfills by 23% – almost halfway towards the 2020 target of a 50% reduction. With help from MODUS, the City is now creating a long-term Zero Waste Strategy (with a target of 0 waste by 2040).
AP Photo/Rajesh Kumar Singh
7. Reforestation in India and Beyond – on July 11th, 2016, 800,00 volunteers in India planted 50 million trees in 24 hours to combat climate change, smashing world records for the most trees planted in a single day. In December, African nations pledged to reforest 100 million hectares. A wide range of stakeholders, from countries to companies, also signed on to the non-binding New York Declaration of Forests with the goal of halving deforestation by 2020 and ending it by 2030.
8. Endangered Species are Rebounding - Endangered tiger, panda and manatee populations grew in 2016, demonstrating that conservation efforts really work. The giant panda is no longer an endangered species, following decades of work by conservationists. Wild tiger populations appear to be slowly rebounding thanks to efforts to crack down on poaching and protect wildlife reserves in places like India, Russia, Nepal, and Bhutan. The Florida manatee population now hovers around 6,300, a 500 percent increase from 1991, thanks to conservation efforts.
9. The Great Bear Rainforest - On February 1, 2016, Premier Christy Clark announced an agreement between the province of British Columbia, First Nations, environmentalists and the forestry industry to protect 85% of the 6.4 million hectare Great Bear Rainforest from industrial logging. In December 2016, Canada’s Prime Minister, Justin Trudeau, officially ended its greatest threat, the Northern Gateway Project.
10. Syrian Refugees - While the war in Syria rages on, Canada has welcomed 38,713 Syrian refugees since November 4, 2015.
All of these good news stories demonstrate real momentum in efforts to make the world a better place. Let’s keep moving forward in 2017.
Catherine G.@missmobtown
@anildash I don't know which i hate more: Slack or the people who are militantly opposed to any other form of communication except it
Anil Dash@anildash
@jack Alright, I wrote up my suggestions of how I'd love to see Twitter improve in 2017. Hope you'll take a look. :) medium.com/@anildash/a-bi…
On this episode of the SyrupCast, the entire MobileSyrup team squeezes into the podcast studio for a year end wrap up of their favourite tech stories from 2016.
MobileSyrup director of social media Zach Gilbert is up first and discusses Blackberry’s rocky 2016. The company has undergone drastic changes over the course of the past year, from handing off hardware production to TCL, to focusing its future on autonomous cars and software security, leaving the team to predict that 2017 will see a very different BlackBerry emerging from the embers.
Staff writer Rose Behar selects the Samsung Note 7 to reminisce in her segment. Although Samsung had battery combustion problems with the Note 7, rumours regarding the impending release of the S8 are already circulating.
Senior editor Patrick O’Rourke, in true Pokémaster fashion, brings Pokémon Go into the conversation as his favourite story of the year. The augmented reality app that brought the nostalgia of Pokémon to smartphones, has not seen continued growth following its initial boon in popularity, though the developer behind the game, Niantic, is starting to add new features to the mobile title at a rapid pace.
Senior editor Igor Bonifacic directs the conversation to the successful year Microsoft has had. Apple has been at the forefront of the post-PC era, but 2016 saw releases from both Microsoft and Apple that hint at the end of Apple’s reign.
Photos by REV Birmingham, Hal Yaeger and Bill FitzGibbons
This article was originally published on August 5, 2013 but we think it still rocks!
No one likes to walk through an underpass late at night on their own, much less one that's fallen into disrepair. You've probably seen way too many horror movies for it to be a comfortable experience. But artist Bill FitzGibbons found a solution, by transformimg the dark, uninviting environment of the 18th Street underpass in Birmingham, Alabama into a rainbow-lit tunnel in his installation LightRails.
The tunnel's Art Deco design was lit up with a network of thousands of LEDs which were hooked up to a computerized system so the artist could program from a range of 16 million different options, varying speed and color to create different moods.
The installation's color and patterns augment the lines of the Art Deco arches, while also providing pedestrians and cyclists with an inviting glow for them to navigate between two major areas of the city.














 Photos by REV Birmingham, Hal Yaeger and Bill FitzGibbons