Rafael Bernard Rodrigues Araújo
Shared posts
Chamado do Alto
Passei de fase
Existe um ritual de passagem quando a gente se torna pai. É uma experiência que deixa você completamente bobo, como eu fiquei quando deixei minha esposa em uma maternidade de Brasília para ter nossa primeira filha e saí dirigindo pela cidade em plena madrugada. Vaguei quase uma hora pelas ruas e avenidas até perceber que não sabia o que estava fazendo. Eu deveria estar no hospital, aguardando o parto, ao invés de ter deixado minha esposa lá como quem deixa a filha na escola e vai para o trabalho.
Comprei uma maçã verde em uma banca de rua, a única coisa aberta àquela hora da madrugada, e voltei ao hospital com a desculpa de que tinha ido comprar uma fruta para ela.
Quase trinta anos se passaram desde o primeiro parto e eu voltava a experimentar esse passar de fase no game da vida. Minha filha, que nasceu em minha fase macrobiótica de bicho-grilo-avesso-a-tecnologia, havia dado à luz um garotão nos EUA — meu primeiro neto — a sete mil quilômetros daqui, mas eu podia ver e escutar seu choro quase diariamente via Skype. Na parte do choro, os sete mil quilômetros até que eram uma vantagem.
Quantas fases eu passei para chegar aqui? Não foram poucas. Quem passa dos quarenta — e eu já passei dos sessenta — deve saber que nada será como antes, e a visão da vida também deve mudar. Até certa idade você corre atrás de dinheiro, sucesso e poder, qualquer que seja sua carreira. Seu relógio anda pra frente. Então, um belo dia, você entra em modo de contagem regressiva. Aí é hora de olhar menos para o cifrão e mais para o significado da vida. E um neto ajuda demais nessa mudança de fase.
É claro que nem todos pensam assim. Muitos preferem mentir o processo natural da vida, numa desesperada tentativa de negar as mudanças de fase. Tinge aqui, estica ali, suga acolá, tentando recuperar os anos perdidos criando filhos, aturando o cônjuge e trabalhando sem parar. Mas, será que foram mesmo perdidos? Se fizer um balanço vai descobrir um saldo positivo. O melhor mesmo é aceitar o processo. Sem completar uma fase você não entra na seguinte.
Existe algo de belo na estação da vida chamada envelhecer. Ou será que você precisa provar que é tão forte, ágil e capaz quanto um adolescente? Eu, particularmente, prefiro observar a natureza dando livre curso ao seu processo. Acho que nada se compara à profusão de cores das folhas de outono no hemisfério norte. Sim, elas estão caindo, mas caem belas para dar lugar às mais novas.
Depois de ter tido filhos e plantado árvores, o seu vigor estará mais para escrever livros ou simplesmente narrar suas histórias ao lado do berço das novas gerações. Elas necessitam desse conhecimento transformado em sabedoria e envelhecido em tonéis de experiência. Isto se a sua meta na vida não for dirigir um carro vermelho, tomar pílulas azuis e ser o tiozão das baladas adolescentes.
Passar de fase é algo que deve ser acalentado, sorvido sem sofreguidão, como fazemos com vinhos caros. Afinal, para que a pressa quando se passou da metade do jogo? Passar de fase é coisa para ser anunciada com orgulho e paixão. Como contou um escritor na entrevista que ouvi no rádio do carro.
Acho que foi Ignácio Loyola Brandão, não tenho certeza. O que recordo bem foi que contou da palestra que fez para 400 pessoas. Antes de iniciar, pediu licença à plateia para manter seu celular ligado, pois esperava uma ligação importante. Na metade da palestra o celular tocou. Ele atendeu, desligou e, voltando-se para a plateia, curiosa por saber que assunto poderia ser mais importante do que sua palestra naquele momento. Então ele anunciou, com voz embargada:
— Meu neto nasceu!
Pela primeira vez na história 400 pessoas aplaudiram de pé a interrupção de uma palestra por um celular.
Mario Persona é palestrante de comunicação, marketing e desenvolvimento profissional. Seus serviços, livros, textos e entrevistas podem ser encontrados em www.mariopersona.com.br
© Mario Persona - Quer publicar Mario Persona CAFE em seu blog? Não se esqueça de colocar um link apontando para www.mariopersona.com.br .
Robert Haas: New Features Coming in PostgreSQL 10
Read more »
Ativando o Optimus NVIDIA GPU no Dell XPS 15 com Linux, mesmo na bateria
Já se passou um bom tempo desde meu artigo sobre tuning Manjaro para o Dell XPS 15. Manjaro lançou uma versão mais recente (17) e o kernel lançou a 4.10. A atualização do Manjaro 16 e do kernel 4.9 se deu sem problemas.
Estes são os pacotes específicos do kernel atualmente instalados:
$ pacman -Ss 410 | grep installed
core/linux410 4.10.1-1 [installed]
core/linux410-headers 4.10.1-1 [installed]
extra/linux410-acpi_call 1.1.0-0.7 (linux410-extramodules) [installed]
extra/linux410-bbswitch 0.8-0.7 (linux410-extramodules) [installed]
extra/linux410-ndiswrapper 1.61-0.7 (linux410-extramodules) [installed]
extra/linux410-nvidia 1:375.39-0.7 (linux410-extramodules) [installed]
E para ter certeza de que tudo está ok, eu removi os antigos pacotes relacionados à versão 4.9:
sudo pacman -R linux49 linux49-headers linux49-acpi_call linux49-bbswitch linux49-ndiswrapper linux49-nvidia
Eu também atualizei a BIOS para a mais recente, 1.2.19 (embora muitos tenham dito para ficar em 1.2.18 por enquanto, mas eu não reduzi). A atualização da BIOS é bastante fácil porque você só precisa ter uma unidade USB formatada FAT e copiar o arquivo “XPS_9550_1.2.19.exe”. Na inicialização, você pode pressionar F12 e escolher a opção para atualizar diretamente de lá.
Uma coisa que parou de funcionar foram as teclas de função para controlar o brilho da tela. Eu não fui capaz de resolver isso de volta, mas eu ainda posso controlar o brilho manualmente a partir do Terminal usando comandos como este:
xbacklight -inc 20 # to increment
xbacklight -dec 20 # to decrement
Então, a parte mais irritante: o cartão NVIDIA Optimus.
Suspender o sistema operacional funciona perfeitamente na maioria das vezes. Eu posso apenas fechar a tampa, abrir no outro dia e a bateria permanece razoavelmente no mesmo nível. Kudos para a equipe do kernel por apoiar isso.
Mas o sistema de gerenciamento de energia desliga a GPU NVIDIA e não posso reativá-la depois que a máquina voltar da suspensão, mesmo que eu a conecte novamente a uma fonte de alimentação. Sempre que eu tento executar algo através de optirun (o que força o processamento através da GPU NVIDIA em vez da GPU Intel integrado primário) ele dá erro com esta mensagem:
Could not enable discrete graphics card
E a única maneira de tê-lo em execução era conectar o cabo de alimentação e reiniciar a máquina. Então, eu poderia usar o NVIDIA GPU normalmente. Reiniciar o tempo todo não é lento (graças ao rápido SSD), mas ainda é chato ter que reabrir cada aplicativo toda vez.
Finalmente, depois de muita pesquisa, eu descobri como ter o NVIDIA GPU habilitado mesmo na bateria e após suspender. Primeiro, você precisa saber o ID PCI para o cartão:
$ lspci | grep "NVIDIA" | cut -b -8
01:00.0
Então, você precisa editar /etc/default/tlp e adicionar esse ID PCI para ser colocado na lista negra do gerenciamento de energia:
# Exclude PCI(e) device adresses the following list from Runtime PM
# (separate with spaces). Use lspci to get the adresses (1st column).
#RUNTIME_PM_BLACKLIST="bb:dd.f 11:22.3 44:55.6"
RUNTIME_PM_BLACKLIST="01:00.0"
Reinicie e é isso! Agora eu posso executar aplicativos através do cartão NVIDIA mesmo sem estar conectado ao cabo de alimentação.
Parece que há um conflito entre TLP e Bumblebee. A solução foi listada neste tópico do reddit de janeiro/2017 e neste tópico de fevereiro/2017 no fórum Manjaro se você estiver interessado na discussão sobre isso.
A parte mais difícil de usar o NVIDIA no Linux é entender todas as muitas terminologias dele. Nem mesmo tenho certeza de que já compreendi tudo.
Isso é o que eu descobri até agora:
- Optimus é a tecnologia de cards gráficos híbridos, que permite que uma GPU Intel de baixa potência seja o card principal que você pode conectar à secundária GPU NVIDIA, exigente em termos de energia, exatamente quando você realmente precisa dele.
- optirun é o comando que você usa para fazer essa conexão.
- “NVIDIA” é o que chamamos de binários proprietários oficiais. No Arch está disponível no pacote “linux410-nvidia”.
- “Nouveau” é o driver de código aberto, ele usa Primus para fazer a conexão em vez de optirun. Acredito que você deve evitar esse driver por enquanto se precisar de desempenho completo e conformidade total da GPU.
- “Bumblebee” é um daemon usado para ativar e desativar a NVIDIA GPU. Você não quer que ele esteja ativado o tempo todo, especialmente quando estiver sendo executado com bateria, para evitar drená-la muito rápido.
- “bbswitch” é o módulo do kernel que faz chamadas ACPI de baixo nível para controlar o estado de energia do cartão NVIDIA GPU.
- “TLP” é o sistema de gerenciamento de energia geral do Linux, que controla todos os aspectos do hardware da máquina, incluindo os dispositivos PCI (um dos quais é o cartão NVIDIA).
Eu entendo que você não quer que TLP entre em cena e desligue o cartão, porque se ele o fizer, então Bumblebee não poderá ativá-lo novamente quando necessário (através de bbswitch). Então você tem que colocar na lista negra o dispositivo PCI em TLP e deixar Bumblebee fazer o seu trabalho.
Se tudo estiver funcionando bem, então NVIDIA GPU estará desativada por padrão. Você pode verificar se ela está desligada através de bbswitch:
$ cat /proc/acpi/bbswitch
0000:01:00.0 OFF
Agora, digamos que você queira forçar algo a usar o card, então você faz isso assim:
$ optirun -vv glxgears
[ 1817.200384] [DEBUG]Reading file: /etc/bumblebee/bumblebee.conf
[ 1817.200519] [INFO]Configured driver: nvidia
[ 1817.200579] [DEBUG]optirun version 3.2.1-2017-02-27-Format:%h$ starting...
[ 1817.200584] [DEBUG]Active configuration:
[ 1817.200588] [DEBUG] bumblebeed config file: /etc/bumblebee/bumblebee.conf
[ 1817.200592] [DEBUG] X display: :8
[ 1817.200595] [DEBUG] LD_LIBRARY_PATH: /usr/lib/nvidia:/usr/lib32/nvidia
[ 1817.200599] [DEBUG] Socket path: /var/run/bumblebee.socket
[ 1817.200603] [DEBUG] Accel/display bridge: auto
[ 1817.200607] [DEBUG] VGL Compression: proxy
[ 1817.200611] [DEBUG] VGLrun extra options:
[ 1817.200615] [DEBUG] Primus LD Path: /usr/lib/primus:/usr/lib32/primus
[ 1817.200645] [DEBUG]Using auto-detected bridge virtualgl
[ 1818.163747] [INFO]Response: Yes. X is active.

[ 1818.163757] [INFO]Running application using virtualgl.
[ 1818.163843] [DEBUG]Process vglrun started, PID 9770.
10419 frames in 5.0 seconds = 2083.766 FPS
10671 frames in 5.0 seconds = 2134.041 FPS
Isto irá executar glxgears (um aplicativo simples para testar o card) através da conexão Optimus (em modo detalhado, é por isso que você tem todas essas informações extras). E se glxgears era capaz de usar a NVIDIA GPU, ele deve relatar FPS (frames per second) maior que 1.000.
E você pode verificar com bbswitch como este:
$ cat /proc/acpi/bbswitch
0000:01:00.0 ON
Quando você Ctrl-C fora de glxgears ele deve relatar como OFF novamente.
Apenas para ter certeza, é importante garantir que o /etc/bumblebee/bumblebee.conf está personalizado como este (somente as chaves importantes são mostradas abaixo):
[bumblebeed]
Driver=nvidia
...
[optirun]
Bridge=auto
...
[driver-nvidia]
KernelDriver=nvidia
PMMethod=bbswitch
...
Até agora, as únicas pequenas questões que ainda tenho são as seguintes:
- As teclas de função não alteram o brilho da tela
- Fone de ouvido bluetooth Bose conecta perfeitamente, mas não se tornará saída de som primária sem manualmente mudar para tal nas configurações de Som (mas todas as teclas de função de hardware para controle de volume e mídia funcionam sem problemas).
- Eu tive que instalar o Manjaro usando o boot antigo da BIOS e o esquema de partição MBR em vez de GPT sobre UEFI. Não sei com certeza como mover para GPT/UEFI agora (usando um esquema de partição cifrada LUKS)
Depois de corrigir a NVIDIA GPU após uma suspensão ou desligamento de energia, os outros problemas são apenas pequenos aborrecimentos.
Até agora, estou muito feliz por estar usando Manjaro no Dell XPS. Estou usando uma configuração de monitor duplo e tudo está funcionando perfeitamente. Se você quiser tentar isto, eu recomendo que você fique com a versão 9560 (versão mid 2016) Sandy Bridge. Não vá para as novas versões Kaby Lake ainda, pois você vai achar BIOS firmware bastante bugado e muitos aspectos do hardware não estarão ainda devidamente suportados ou documentados.
E se você é novo no Arch, eu recomendo que você comece com o Manjaro GNOME. É de longe o melhor e mais útil desktop Linux que eu já tentei.
***
Artigo traduzido com autorização do autor. Publicado originalmente em http://www.akitaonrails.com/2017/03/14/enabling-optimus-nvidia-gpu-on-the-dell-xps-15-with-linux-even-on-battery
Privacidade: módulo de segurança de internet banking solicita senha sudo de usuários linux
Em março de 2017 usuários do Internet Banking do Banco do Brasil começaram a receber a mensagem de que um novo módulo de segurança necessitava ser instalado. Para ver a mensagem de erro basta acessar o site do BB e clicar no botão "ACESSE SUA CONTA" (a mensagem de erro aparece caso você não tenha o módulo instalado. A mensagem aparece tanto em sistemas Windows quanto Linux, e em ambos navegadores, Firefox e IE.
Se você quiser acessar o Internet Banking obrigatoriamente terá que instalar o módulo. As instruções de instalação estão disponíveis nos links da página com o erro.
Eu fiz a instalação no meu sistema Ubuntu e qual não foi a minha surpresa quando percebi que o durante o processo de instalação do módulo foi solicitada a minha senha de administrador (senha sudo).
Aparentemente o software "warsaw", desenvolvido pela GAS Tecnologia, da empresa Diebold, desenvolveu um módulo de segurança que discretamente solicita o usuário ubuntu/linux a sua senha de administrador. Isso fica claro nas próprias instruções para instalação do módulo que estão disponíveis na página de ajuda e tira-dúvidas do BB para o sistema Ubuntu/Mint. O walkthrough com as imagens mostra duas caixas de diálogo durante o processo de instalação: uma caixa apresentada pelo próprio sistema Ubuntu solicitando permissão para instalação de software (o que é um procedimento padrão); e uma segunda caixa de diálogo que é apresentada pelo instalador e que requisita novamente a senha de administrador com a mensagem "Você precisa ter permissões de administrador para instalar softwares. Pode ser inseguro instalar pacotes manualmente. Instale apenas programas de origem confiável."
(...) Note que alguns usuários serão perspicazes o suficiente para perceberem que algo está errado com o instalador, e que ele não deveria solicitar a senha sudo. Porém, grande parte dos usuários não possui conhecimento suficiente para compreender o alcance do processo, e provavelmente digitarão a sua senha novamente nessa segunda caixa de diálogo, permitindo que a GAS Tecnologia tenha acesso ao seu computador de uma forma que não fosse tão séria, seria até banal.
O usuário leigo, que não possui um maior conhecimento de sistemas de computação, não irá duvidar da validade da segunda solicitação por vários motivos. (1) A instalação do software é obrigatória - sem a instalação do módulo de segurança o cliente não tem acesso ao Internet Banking; (2) O software é utilizado por uma instituição financeira de renome e respeitável, além de ser uma das maiores no Brasil (o software também é utilizado por outras instituições financeiras, porém eu sou cliente apenas do BB); (3) a caixa de diálogo do instalador é apresentada de forma a assemelhar-se à caixa de diálogo do sistema Ubuntu, portanto não sendo honesta na sua apresentação e induzindo o usuário a digitar novamente a sua senha.
A comunidade Linux deve levantar-se contra softwares que não respeitam o usuário e seu direito à privacidade. Milhões de usuários estão sendo obrigados a utilizar esse módulo de segurança que, no mínimo, pode ser considerado questionável no seu processo de instalação.
Reclamações em relação à GAS Tecnologia não são raras com atestam as inúmeras reclamações enviadas para o site Reclame Aqui.
Enviado por Daniel Montezano (tnlmontezanoΘgmail·com)
O artigo "Privacidade: módulo de segurança de internet banking solicita senha sudo de usuários linux" foi originalmente publicado no site BR-Linux.org, de Augusto Campos.
PG Phriday: Everything in Common
Not a lot of people remember what Postgres was like before version 8.4. In many ways, this was the first “modern” release of the database engine. CTEs, Window Functions, column level permissions, in-place upgrade compatible with subsequent versions, collation support, continuous query statistic collection; it was just a smorgasbord of functionality.
Of these, CTEs or Common Table Expressions, probably enjoy the most user-level exposure; for good reason. Before this, there was no way to perform a recursive query in Postgres, which really hurts in certain situations. Want to display all related child threads in an online discussion? How about fetching the components of an organization chart by following management assignments? Better get ready for a lot of queries in a loop.
In addition to that, complicated queries were difficult to logically simplify. Reporting queries are especially prone to frequent sequences of aggregates and subqueries. It’s not uncommon to build a query that’s several pages long in this kind of context. Optimizing such an unwieldy beast is often difficult or even impossible simply due to all of the components and confusing nesting.
CTEs changed these things for the better and in the eyes of many, finally brought Postgres to parity with Oracle and its long-established recursive query support. So let’s explore what CTEs really deliver, and how they can improve our Postgres experience—caveats and all.
Let’s start with a trivial table and some data:
CREATE TABLE employee
(
  employee_id  SERIAL PRIMARY KEY,
  full_name    VARCHAR NOT NULL,
  manager_id   INT REFERENCES employee
);

INSERT INTO employee (full_name, manager_id) VALUES
  ('King Randor', NULL),
  ('Prince Adam', 1),
  ('Teela', 2),
  ('Man-at-Arms', 2),
  ('Skeletor', NULL),
  ('Evil-Lyn', 5),
  ('Trap Jaw', 5),
  ('Clawful', 6);
It’s easy enough to display the management relationships. Here’s how our cartoon cohorts look with a basic JOIN:
SELECT m.full_name AS boss, e.full_name AS goon
  FROM employee e
  JOIN employee m ON (m.employee_id = e.manager_id)
 ORDER BY e.manager_id;

boss     |    goon


-------------+-------------
 King Randor | Prince Adam
 Prince Adam | Teela
 Prince Adam | Man-at-Arms
 Skeletor    | Evil-Lyn
 Skeletor    | Trap Jaw
 Evil-Lyn    | Clawful
In this trivial example, we can visually follow the results and understand that Clawful is ultimately a minion of Skeletor. We could also leverage our knowledge that the organization chart is only three levels deep and employ a third join to fully represent all relationships. But such a shallow corporate hierarchy is exceedingly rare, so let’s use a CTE to flush out the table instead.
WITH RECURSIVE org_tree AS (
    SELECT NULL::VARCHAR AS boss, , 0 AS level,
           employee_id AS end_boss
      FROM employee
     WHERE manager_id IS NULL
    UNION ALL
    SELECT t.full_name AS boss, e., t.level + 1 AS level,
           t.end_boss
      FROM employee e
      JOIN org_tree t ON (t.employee_id = e.manager_id)
)
SELECT repeat(' ', level * 5) || full_name AS relationship
  FROM org_tree
 ORDER BY end_boss, level;

     relationship

King Randor
      Prince Adam
           Teela
           Man-at-Arms
 Skeletor
      Trap Jaw
      Evil-Lyn
           Clawful
Well that’s quite an improvement! But how does it work?
Our initial clue is the first query within the CTE. Other databases may do this differently, but Postgres creates a temporary in-memory table to act as a holding area to represent the CTE contents as they’re constructed. When we specify the RECURSIVE decorator, we gain the ability to bootstrap that temporary data with one query. The second query can then refer to the cumulative result in each iteration of the recursion.
The result is one query that loops in on itself three times in our example. We took advantage of this by adding a new column to track how deep the recursion is so we can visualize this more easily. Here’s what the contents of the “tree” table look like for each phase:
WITH RECURSIVE tree AS (
    SELECT NULL::VARCHAR AS boss, , 0 AS level
      FROM employee
     WHERE manager_id IS NULL
    UNION ALL
    SELECT t.full_name AS boss, e., t.level + 1 AS level
      FROM employee e
      JOIN tree t ON (t.employee_id = e.manager_id)
)
SELECT * FROM tree;

boss     | employee_id |  full_name  | manager_id | level


-------------+-------------+-------------+------------+-------
             |           1 | King Randor |            |     0
             |           5 | Skeletor    |            |     0
 King Randor |           2 | Prince Adam |          1 |     1
 Skeletor    |           6 | Evil-Lyn    |          5 |     1
 Skeletor    |           7 | Trap Jaw    |          5 |     1
 Prince Adam |           3 | Teela       |          2 |     2
 Prince Adam |           4 | Man-at-Arms |          2 |     2
 Evil-Lyn    |           8 | Clawful     |          6 |     2
Each “level” here represents one dive into the employee table to fetch employees of the employees already listed. This loop naturally terminates once every boss is listed in the results. But there’s one flaw in this particular construction: what if we wanted to choose any grunt and see the whole chain of command from that point? To do that, we need to modify the CTE slightly to incorporate our desired predicate in the CTE portion itself so we can follow the relationship properly.
Here’s how that looks:
WITH RECURSIVE tree AS (
    SELECT , 0 AS level
      FROM employee
     WHERE full_name = 'Clawful'
    UNION ALL
    SELECT e., t.level + 1 AS level
      FROM tree t
      JOIN employee e ON (e.employee_id = t.manager_id)
)
SELECT full_name
  FROM tree
 ORDER BY level DESC;

 full_name

Skeletor
 Evil-Lyn
 Clawful
Not bad, eh? We had to flip the JOIN because we started with a specific minion instead of the list of all executives. Then we followed the chain backwards, adding one middle-management peon per iteration until we reached the End Boss. We could combine this kind of trickery by writing a CTE that refers to another CTE and produce a query that would output the entire organization given any member in the hierarchy. We won’t, because that’s a gigantic and rather ugly query, but the capability is there.
What we can do, is demonstrate using CTEs to logically separate query fragments of a larger whole. In the past, a reporting query might consist of an imposing bulk of awkward subqueries to produce necessary aggregates and decode or label various summaries. In the worst cases, such queries might meander for dozens of pages. It’s often a miracle the end result executes at all, and debugging it is equally problematic.
Here’s how we might use CTEs to solve that conundrum:
WITH RECURSIVE org_tree AS (
    SELECT NULL::VARCHAR AS boss, , 0 AS level,
           employee_id AS end_boss
      FROM employee
     WHERE manager_id IS NULL
    UNION ALL
    SELECT t.full_name AS boss, e., t.level + 1 AS level,
           t.end_boss
      FROM employee e
      JOIN org_tree t ON (t.employee_id = e.manager_id)
),
org_stats AS (
  SELECT m.full_name AS ceo, count()-1 AS minions,
         max(level) AS cruelty
    FROM org_tree org
    JOIN employee m ON (m.employee_id = org.end_boss)
   GROUP BY m.full_name
),
org_attributes AS (
  SELECT m.full_name AS ceo,
         sum(1) FILTER (WHERE org.full_name ILIKE '%evil%') AS evil,
         sum(1) FILTER (WHERE org.full_name ILIKE '%prince%' OR
                              org.full_name ILIKE '%king%') AS royalty
    FROM org_tree org
    JOIN employee m ON (m.employee_id = org.end_boss)
   GROUP BY m.full_name
)
SELECT st., atr.evil, atr.royalty
  FROM org_stats st
  JOIN org_attributes atr USING (ceo);

 ceo     | minions | cruelty | evil | royalty


-------------+---------+---------+------+---------
 King Randor |       3 |       2 |      |       2
 Skeletor    |       3 |       2 |    1 |
The first portion of the query is just our previous recursive attempt to flatten the organization chart and see how everything is related. The second summarizes basic statistics like employee count and maximum abstraction through middle-management. The third is just a bunch of miscellaneous attributes that might be interesting in a report. All of our examples are trivial, but in a real report, each of these may reflect much more comprehensive aggregates and formulas. Yet despite query complexity, we can determine the end goal of a fragment at a glance. Combine this with SQL comments, and we have a very user-friendly report.
Of course, CTEs are not all sunshine and roses. Remember when we said a CTE is built in a temporary memory location to facilitate recursive functionality and allow CTEs to reference each other? A consequence is that every CTE acts as what we call an optimization fence.
Normally before a query is executed, it is broken down into its component parts and the planner translates those elements into execution instructions. This might mean collapsing certain conditionals, simplifying or substituting a subquery, pushing predicates down into a stack for better row elimination, and so on.
When the planner encounters a CTE however, it can go no further. It will optimize the CTE query itself, but it does so as an encapsulated black box. Even if a WHERE clause from the referring query could greatly reduce matched rows during the CTE execution, that optimization cannot be applied. The CTE executes as written as if we had done this instead:
CREATE TEMP TABLE my_cte_chunk AS
SELECT ...
This applies to every CTE in a query. It’s better to think of each CTE as a virtual temporary table. While that allows each CTE to refer to the entire contents of another CTE, it also means we may lose several opportunities to optimize a query. It’s not uncommon to unroll a CTE and receive a much faster query in return. Query planners are complex beasts, and like any software compiler, may simplify necessary instructions by eliminating entire branches from the execution tree due to redundancy or empty result paths. Using a CTE reduces the planner’s ability to do that.
On the other hand, an experienced user can leverage this knowledge to their benefit. Since the query planner cannot penetrate optimization fences, it means we can override its decision tree. When the data or statistics indicate the planner will improperly prefer a highly inefficient plan, we can force it along an improved path. In these cases, we’re actively trading the potential for future planner improvements for immediate advantage.
The primary argument here is that the planner improvements we need may not arrive for years, or at all. Can we justify suffering bad performance for an undetermined length of time until some nebulous future planner addresses our obscure data edge case? Often the answer to this question is ‘no’. In the rare instances where this justification applies, leveraging optimization fences is probably a safe bet. At least we have the option!
In the end, Postgres improved its reputation among power users, and we gained a versatile tool that enabled the previously impossible. New recursion, simplification, and optimization options, all from a single feature? Yes, please!
David Rader: Holy Easy PostgreSQL deployment
Holy Easy PostgreSQL deployment!
In case you missed it, the BigSQL team released an awesome package manager for installing and configuring PostgreSQL and many related, useful components. The package manager can be found here: https://www.bigsql.org/package-manager.jsp.
Playfully named pgc, for ‘pretty good command line’, pgc is a utility similar to yum or apt-get that allows you to install, configure, update and manage Postgres related components including foreign data wrappers, stored procedure languages, connectors, devops tools, HA tools and monitoring tools. Common uses:
- Provision Postgres (9.2 through 9.6, including multiple versions on same server)
- Installing pgBouncer, Backrest, and other community projects
- Scripting configurations in chef or other devops tools
PGC runs on Linux, Windows and OS X and supports the same exact cli so it is an ideal provisioning/management tool for multi OS environments.
PGC not only allows you to get and install these components but you can use pgc to update each component as new updates become available.
PGC’s syntax is very intuitive and easy to use:
Use the help command to see the possible commands:
$ ./pgc help

Usage: pgc command [component1 component2 ...]

Common commands:

help - Show this help file

info - Display OS or component information

list - Display installed & available components

status - Display status of installed server components

start - Start server components

stop - Stop server components

enable - Enable a server component

disable - Disable a server component from starting automatically

update - Retrieve new list of available components

upgrade - Upgrade installed components to newer (compatible) versions

install - Install a component

remove - Remove a component

Advanced commands:

init - Initialize a component

download - Download a component

config - Configure a component

clean - Remove component files from download cache

enable - Enable a server component

disable - Disable a server component from starting automatically
Example workflow:
1) Checking to see what components are available
The list command displays installed and available components. It confirms that the core
Postgres 9.6 server component is installed.
$ ./pgc list
Category | Component | Version | Stage | ReleaseDt | Status | Cur? | Updates
PostgreSQL pg92 9.2.18-2a 2016-09-15 1
PostgreSQL pg93 9.3.14-2a 2016-09-15 1
PostgreSQL pg94 9.4.9-2a 2016-09-15 1
PostgreSQL pg95 9.5.4-2 2016-08-18 1
PostgreSQL pg96 9.6.0-1 2016-09-29 Installed 1
Extensions hadoop_fdw2-pg96 2.5.0-1 2016-09-01 1
Extensions oracle_fdw1-pg96 1.5.0-1 2016-09-01 1
Extensions orafce3-pg96 3.3.1-1 2016-09-23 1
Extensions plprofiler3-pg96 3.0-1 2016-10-08 1
Extensions plv814-pg96 1.4.8-1 2016-09-01 1
Extensions postgis22-pg96 2.2.2-2 2016-09-01 1
Extensions postgis23-pg96 2.3.0-1 2016-10-08 1
Extensions slony22-pg96 2.2.5-2 2016-09-01 1
Servers bam2 1.6.2 2016-09-15 1
Servers cassandra30 3.0.8 2016-09-01 1
Servers hadoop26 2.6.4 2016-02-14 1
Servers hive2 2.0.1 2016-06-16 1
Servers pgbouncer17 1.7.2-1a 2016-10-08 1
Servers pgha2 2.1b 2015-12-17 1
Servers pgstudio2 2.0.1-2 2016-03-23 1
Servers spark16 1.6.1 2016-03-16 1
Servers tomcat8 8.5.4 2016-09-01 1
Servers zookeeper34 3.4.8 2016-03-30 1
Applications backrest 1.08 2016-09-23 1
Applications birt 4.5.0 2016-05-12 1
Applications ora2pg 17.4 2016-05-12 1
Applications pgbadger 9.0 2016-09-03 1
Frameworks java8 8u92 2016-07-01 1
2) Installing a component
Use the install command to provision a component
$ ./pgc install pg96
[‘pg96′]
Get:1 http://s3.amazonaws.com/pgcentral pg96-9.6.0-1-linux64
Unpacking pg96-9.6.0-1-linux64.tar.bz2
3) Initialize PostgreSQL 9.6
./pgc init pg96
## Initializing pg96 #######################
Superuser Password [password]:
Confirm Password:
Giving current user permission to data dir
Initializing Postgres DB at:
-D “/software/bigsql/data/pg96″
Using PostgreSQL Port 5432
Password securely remembered in the file: /home/oscgadmin/.pgpass
to load this postgres into your environment, source the env file:
/software/bigsql/pg96/pg96.env
4) Add extensions, such as FDW’s, PostGIS, Slony replication, or the NEW plProfiler 3
$ ./pgc list –extensions pg96
Category | Component | Version | Stage | ReleaseDt | Status | Cur? | Updates
Extensions hadoop_fdw2-pg96 2.5.0-1 2016-09-01 1
Extensions oracle_fdw1-pg96 1.5.0-1 2016-09-01 1
Extensions orafce3-pg96 3.3.1-1 2016-09-23 1
Extensions plprofiler3-pg96 3.0-1 2016-10-08 1
Extensions plv814-pg96 1.4.8-1 2016-09-01 1
Extensions postgis22-pg96 2.2.2-2 2016-09-01 1
Extensions postgis23-pg96 2.3.0-1 2016-10-08 1
Extensions slony22-pg96 2.2.5-2 2016-09-01 1
$ ./pgc install plprofiler3-pg96
[‘plprofiler3-pg96′]
Get:1 http://s3.amazonaws.com/pgcentral plprofiler3-pg96-3.0-1-linux64
Unpacking plprofiler3-pg96-3.0-1-linux64.tar.bz2
5) Install and launch a GUI management and monitoring console – BigSQL Manager:
$ ./pgc install bam2
[‘bam2′]
Get:1 http://s3.amazonaws.com/pgcentral bam2-1.6.2
Unpacking bam2-1.6.2.tar.bz2
oscgadmin@ubuntu:~/Downloads/bigsql$ ./pgc start bam2
bam2 starting on port 8050
bam2 started on port 8050.

As you can see, pgc by BigSQL is an easy to use provisioning tool for Postgres and its related components. Anyone looking to use Postgres in their DevOps environment would benefit from using pgc so take a look at it today! https://www.bigsql.org/package-manager.jsp
Oração, sofrimento, Palavra e fé

Donizete, um amado irmão, é o marido de Maria de Luca, essa querida irmã que coopera com o Campos de Boaz como editora. Ela é que tem publicado os últimos Gotas de Orvalho. O Doni está há mais de um mês na UTI. Por causa de dores de cabeça, foi fazer uma tomografia, que revelou um tumor no cerebelo. Feita a cirurgia, teve meningite, trombose e outras complicações. Ele está bem, recuperando-se, mas ainda amarrado à cama, pois não deve se mover, com dificuldade para falar, cansado. Depois que tiver alta, terá um longo processo de recuperação pela frente.
Doni e Maria têm um lindo casal de filhos.
A situação não é apenas de expectativa e de sofrimento. Deus tem usado isso para operar algo novo, maravilhoso na família e em todos os que os conhecem (eu me incluo como um especial privilegiado pela amizade desse casal). Recentemente, Maria me enviou um texto pelo WhatsApp que, com a permissão dela, publico aqui.
Sei que o apoio e as orações dos irmãos é que estão nos sustentando. Eu estou aqui, esperando no Senhor. Sei que Ele é poderoso. A mim, cabe apenas me humilhar na presença Dele e clamar por Sua misericórdia e compaixão até que se compadeça de nós.
Eu tive uma conversa com as crianças essa semana. Eu lhes expliquei, usando o salmo 139, que todos os nossos dias foram escritos na presença de Deus. E que, se o Senhor não voltar antes, cada um de nós será chamado a Sua presença quando Ele determinar. E por isso nós poderíamos descansar. Porque o papai só pode morrer se for o momento em que o Senhor chamar. E, mesmo que alguém esteja com plena saúde, se Ele chamar, esse alguém morrerá.
Então, um dia depois, meu filho foi disputar um campeonato com a equipe da escola. Foram bem colocados e ganharam até medalha. No dia seguinte, o pai de um de seus colegas trabalhou o dia todo normalmente. À noite, ao chegar em casa, sentiu-se mal. Teve um ataque fulminante do coração e morreu. Meu filho me disse que se lembrou do que eu havia falado.
Olho para o Doni dormindo no hospital e penso em tantas coisas que o Senhor está me ensinando com tudo isso enquanto ele dorme. Ensinando a meus filhos e a toda nossa família. Vejo o quanto minha fé é vacilante e como gostamos de ter o controle sobre tudo o que nos acontece. Como somos relutantes em nos jogar nos braços do Pai e dizer-Lhe que faça Sua vontade! Como ainda tememos a morte! Como ainda nos falta a coragem e a bravura de irmãos do passado cuja única coisa que temiam era desagradar o Pai! Que o Senhor, em Sua misericórdia, me encontre vigilante.
Eu respondi a ela:
Maria, eu seria muito leviano se tentasse acrescentar qualquer coisa ao que você disse. Mesmo concordar com isso, eu sinto, é, de minha parte, superficial, pois só consigo imaginar o que seja esse tempo.
O pouco que conheço do Senhor me faz saber que Ele é sempre bondoso, mesmo quando nos conduz pelo vale da sombra da morte. Fugimos tanto dela, e ela é tão real, precisa e inevitável. E nossos filhos precisam saber disso, pois, em Adão, somos todos perecíveis.
Muito obrigado por partilhar isso comigo. Sinto-me honrado por vocês e agraciado pelo Senhor em poder ler isso. Se me permite, eu gostaria de publicar um artigo no Campos, pedindo oração dos leitores também e partilhando esse texto. Não o farei sem sua autorização.
Li ontem num livro do Spurgeon: “É bom ficar sabendo que Deus não põe fardos pesados sobre ombros inexperientes. […] Não pense que, à medida que você cresce em graça, a vereda se tornará mais suave sob seus pés e os céus, mais serenos sobre sua cabeça. Ao contrário, reconheça que, conforme Deus lhe dá maior habilidade como soldado, Ele o mandará para empreitadas mais árduas ainda.” Que lhes sirva de consolo saber que Deus capacitou seus ombros para isso.
Saibam que amamos imensamente vocês.
Alguns dias depois, ela também me escreveu o seguinte:
Eu estava terminando de ler um livro do Jerry Bridges quando tudo começou. O nome do livro é Confiando em Deus, mesmo quando a vida nos golpeia, aflige e fere. É um livro doce, resultado do estudo do autor sobre a soberania de Deus enquanto via o câncer consumir a saúde da esposa, até que o Senhor a tomou para Si. Foi uma leitura proveitosa, tanto para mim como para o Doni, que estava na metade do livro e terminou de lê-lo já no hospital, antes da cirurgia.
O autor mostra tantos exemplos bíblicos de pessoas que sofreram dor e perda e, ainda assim, confiaram no Senhor. Dois apóstolos foram presos: Tiago e Pedro. A igreja orou pela libertação dos dois. Pedro foi liberto milagrosamente, enquanto Tiago foi decapitado. O que pensou a esposa de cada um deles?
Tenho aprendido com estes e tantos outros exemplos que “nossa leve e momentânea tribulação produz para nós eterno peso de glória”. Os dias não têm sido fáceis. Um dia recebo uma boa notícia, no outro, uma ruim. Mas tenho comigo que nossa frágil vida está em mãos seguras. Como dizia Spurgeon, “a menos que Deus me chame, eu não posso morrer”. E o contrário é igualmente verdadeiro. Se Ele chamar você, não importa se goza de boa saúde ou tem prosperidade financeira que lhe garanta recursos mil, você irá se encontrar com Ele.
Tenho vivido cada dia. Um de cada vez. Sem querer previsões, sem querer saber o que houve em casos como o dele. Confio apenas que Deus cuida dos Seus um a um. Ele escreve nossa história de maneira única. Embora os testemunhos sirvam sempre para nos dar alento, Hebreus nos alerta que, olhando para aqueles testemunhos, devemos imitar a fé que tiveram – e não os atos de fé.
Conheço irmãos por quem oramos quando não havia mais esperança, e Deus os curou. Outros, igualmente piedosos, foram chamados a Sua presença. Então, aguardo em Deus o desfecho de tudo isso, sabendo que Ele é Deus e só Ele merece toda honra. Se Ele for glorificado com a cura do Doni, amém. Mas, se não, que Ele igualmente seja glorificado.
Eu sou tão fraca e tenho uma fé tão vacilante! Mas tenho pedido a Deus que me fortaleça para que eu possa testemunhar sobre a paz de Jesus aos médicos com quem converso diariamente.
Lembro-me sempre da paz que havia entre os irmãos morávios, a qual levou John Wesley a procurá-los, porque, mesmo em meio à grande tormenta, nem suas crianças temiam a morte. E aquilo o atraiu. Um irmão fez-lhe algumas perguntas que o levaram posteriormente a ter uma experiência real com Jesus, e ele se tornou o maior pregador da Inglaterra.
Que o Senhor continue nos conduzindo, apesar de nossa fraqueza e grande debilidade. Ele é forte, capaz, bom e Todo-poderoso.
Partilho tudo isso com você, prezado leitor do Campos de Boaz, em primeiro lugar para pedir suas orações por todos eles. Como costumo dizer, orações são sempre bem-vindas! Orações pela plena recuperação do Doni, sem nenhuma seqüela, por paciência e confiança para o tempo que ele ainda terá de passar no hospital. Oração pela Maria, para que o Senhor a capacite, dia após dia, a esperar, confiar e ajudar seus filhos a também confiarem e esperarem no Senhor. Pelos filhos, para que, apesar da pouca idade, conheçam o Senhor no meio desse sofrimento.
Partilho também para que sirva de alerta: qualquer um de nós, e qualquer pessoa a quem amamos, a qualquer momento, pode ser chamado à presença do Senhor. Você está preparado? E seus filhos? Já conhecem o Senhor? São ajudados a confiar no Senhor? E seus amigos e parentes, a quem você muito ama, estão prontos para se encontrar com o Criador?
Por fim, divido isso para que lhe sirva de encorajamento. Em toda situação, Deus quer apenas uma coisa: conformar-nos mais e mais à imagem de Seu Filho. Se O buscarmos, se nos submetermos a Sua vontade, por vezes misteriosa e cheia de dor, se exercitarmos nossa confiança e submissão a Ele, Deus obterá em nós o que deseja.
Em Cristo, seu conservo
Francisco Nunes
Andrew Dunstan: Indiscriminate use of CTEs considered harmful
However, there is one aspect of the current implementation of CTEs that should make you pause. Currently CTEs are in effect materialized before they can be used. That is, Postgres runs the query and stashes the data in a temporary store before it can be used in the larger query. There are a number of consequences of this.
First, this can be a good thing. I have on a number of occasions used this fact to good effect to get around problems with poorly performing query plans. It's more or less the same effect as putting "offset 0" on a subquery.
However, it can also result in some very inefficient plans. In particular, if CTEs return a lot of rows they can result in some spectacularly poorly performing plans at the point where you come to use them. Note also that any indexes on the underlying tables will be of no help to you at all at this point, since you are no longer querying against those tables but against the intermediate result mentioned above, which has no indexes at all.
This was brought home to me forcefully on Friday and Saturday when I was looking at a very poorly performing query. After some analysis and testing, the simple act of inlining two CTEs in the query in question resulted in the query running in 4% of the time it had previously taken. Indiscriminate use of CTEs had made the performance of this query 25 times worse.
So the moral is: be careful in using CTEs. They are not just a convenient tool for abstracting away subqueries.
There has been some discussion about removing this aspect of the implementation of CTEs. It's not something that is inherent in CTEs, it's simply a part of the way we have implemented them in PostgreSQL. However, for now, you need to be familiar with the optimization effects when using them, or you might face the same problem I was dealing with above.
Gotas de orvalho (51)

A coroa de ferro do sofrimento precede a coroa de ouro da glória.
(F. B. Meyer)
Deus pediu a Abraão a coisa mais preciosa em sua vida. Não era Isaque que Deus queria, mas Abraão.
(J. Oswald Sanders)
Não se esqueça de que o mundo odeia a Palavra de Deus acima de tudo, mas precisa dela acima de tudo.
(Henry Vögel)
Desejo ardentemente o dia de Cristo. Quase posso chamar de cruel a Sua ausência. Oh!, quando O veremos?
(Samuel Rutherford)
Eu não quero nada para mim mesma; quero tudo para o Senhor.
(Margaret Barber)
Meus sentimentos estão tão presos ao céu que posso deixar a todos vocês sem remorsos. Não é que os ame menos, mas amo mais a Deus.
(William Wilberforce)
Existe algo de suave em ser podado por uma mão ferida.
(Lady Powerscourt)
PG Phriday: Trusty Table Tiers
I always advocate breaking up large Postgres tables for a few reasons. Beyond query performance concerns, maintaining one monolithic structure is always more time consuming and consequentially more dangerous. The time required to create a dozen small indexes may be slightly longer than a single larger one, but we can treat the smaller indexes as incremental. If we want to rebuild, add more indexes, or fix any corruption, why advocate an all-or-nothing proposition? Deleting from one large table will be positively glacial compared to simply dropping an entire expired partition. The list just goes on and on.
On the other hand, partitioning in Postgres can be pretty intimidating. There are so many manual steps involved, that it’s easy to just kick the can down the road and tackle the problem later, or not at all. Extensions like the excellent pg_partman remove much of the pain involved in wrangling an army of partitions, and we strongly suggest using some kind of tool-kit instead of reinventing the wheel.
The main limitation with most existing partition management libraries is that they never deviate from the examples listed in the Postgres documentation. It’s always: create inherited tables, add redirection triggers, automate, rinse, repeat. In most cases, this is exactly the right approach. Unfortunately triggers are slow, and especially in an OLTP context, this can introduce sufficient overhead that partitions are avoided entirely.
Well, there is another way to do partitioning that’s almost never mentioned. The idea is to actually utilize the base table as a storage target, and in lieu of triggers, schedule data movement during low-volume time periods. The primary benefit to this is that there’s no more trigger overhead. It also means we can poll the base table itself for recent data with the ONLY clause. This is a massive win for extremely active tables, and the reason tab_tier was born.
Let’s create some data for testing this out:
CREATE TABLE sensor_log (
  id            INT PRIMARY KEY,
  location      VARCHAR NOT NULL,
  reading       BIGINT NOT NULL,
  reading_date  TIMESTAMP NOT NULL
);

INSERT INTO sensor_log (id, location, reading, reading_date)
SELECT s.id, s.id % 1000, s.id % 100,
       CURRENT_DATE - ((s.id * 10) || 's')::INTERVAL
  FROM generate_series(1, 5000000) s(id);

CREATE INDEX idx_sensor_log_location ON sensor_log (location);
CREATE INDEX idx_sensor_log_date ON sensor_log (reading_date);

ANALYZE sensor_log; |
Now we have 5-million rows in a table with a defined date column that’s a perfect candidate for partitioning. The way this data is currently distributed, we have content going back to late 2014. Imagine in this scenario we don’t need this much live information at all times. So we decide to keep one week of logs for active use, and relegate everything else into some kind of monthly partition.
This is how all of that would look in tab_tier:
CREATE EXTENSION tab_tier;

SELECT tab_tier.register_tier_root('public', 'sensor_log', 'reading_date');

UPDATE tab_tier.tier_root
   SET root_retain = '1 week'::INTERVAL,
       part_period = '1 month'::INTERVAL
 WHERE root_schema = 'public'
   AND root_table = 'sensor_log';

SELECT tab_tier.bootstrap_tier_parts('public', 'sensor_log');

\dt

                 List OF relations
 Schema |          Name          | TYPE  |  Owner
--------+------------------------+-------+----------
 public | sensor_log             | TABLE | postgres
 public | sensor_log_part_201410 | TABLE | postgres
 public | sensor_log_part_201411 | TABLE | postgres
 public | sensor_log_part_201412 | TABLE | postgres
 public | sensor_log_part_201501 | TABLE | postgres
 public | sensor_log_part_201502 | TABLE | postgres
 public | sensor_log_part_201503 | TABLE | postgres
 public | sensor_log_part_201504 | TABLE | postgres
 public | sensor_log_part_201505 | TABLE | postgres
 public | sensor_log_part_201506 | TABLE | postgres
 public | sensor_log_part_201507 | TABLE | postgres
 public | sensor_log_part_201508 | TABLE | postgres
 public | sensor_log_part_201509 | TABLE | postgres
 public | sensor_log_part_201510 | TABLE | postgres
 public | sensor_log_part_201511 | TABLE | postgres
 public | sensor_log_part_201512 | TABLE | postgres
 public | sensor_log_part_201601 | TABLE | postgres
 public | sensor_log_part_201602 | TABLE | postgres
 public | sensor_log_part_201603 | TABLE | postgres
 public | sensor_log_part_201604 | TABLE | postgres
public | sensor_log_part_201605 | TABLE | postgres |
Taking this piece by piece, the first thing we did after creating the extension itself, was to call the register_tier_root function. This officially tells tab_tier about the table, and creates a record with configuration elements we can tweak. And that’s exactly what we do by setting the primary retention window and the partition size. Creating all of the partitions manually is pointless, so we also invoke bootstrap_tier_parts. Its job is to check the range of dates currently represented in the table, and create all of the partitions necessary to store it.
What did not happen here, is any data movement. This goes back to our original concern regarding maintenance. Some tables may be several GB or even TB in size, and moving all of that data as one gargantuan operation would be a really bad idea. Instead, tab_tier provides the migrate_tier_data function to relocate data for a specific partition.
With a bit of clever SQL, we can even generate a script for it:
COPY (
  SELECT 'SELECT tab_tier.migrate_tier_data(''public'', ''sensor_log'', ''' ||
         REPLACE(part_table, 'sensor_log_part_', '') || ''');' AS part_name
    FROM tab_tier.tier_part
    JOIN tab_tier.tier_root USING (tier_root_id)
   WHERE root_schema = 'public'
     AND root_table = 'sensor_log'
   ORDER BY part_table
) TO '/tmp/move_parts.sql';

\i /tmp/move_parts.SQL

SELECT COUNT(*) FROM ONLY sensor_log;

 COUNT
-------
 60480

SELECT COUNT(*) FROM sensor_log_part_201504;

 COUNT
--------
259200 |
Following some debugging notices, all of our data has moved to the appropriate partition. We verified that by checking the base table and a randomly chosen partition for record counts. At this point, the table is now ready for regular maintenance. In this case “maintenance” means regularly calling the cap_tier_partitions and migrate_all_tiers functions. The first ensures target partitions always exist, and the second moves any pending data to a waiting partition for all tables we’ve registered.
And that’s it. We’re completely done with this table. If we stopped here, we could be secure in the knowledge we no longer have to worry about some gigantic monolith ruining our day some time in the future. But that’s not how tab_tier got its name. One or two levels does not a tier make; the real “secret sauce” is its support for long term storage.
One thing we didn’t really cover, and most partition systems never even consider, is that partitioning is only half of the story. On an extremely active system, having months or years of data just sitting around is relatively frowned upon. The mere presence of older data might encourage using it, transforming our finely tuned OLTP engine into a mixed workload wreck. One or two queries against those archives, and suddenly our cache is tainted and everything is considerably slower.
We need to move that data off of the system, and there are quite a few ways to do that. Some might use ETL scripts or systems like talend to accomplish that goal. Or we can just use tab_tier and a Postgres foreign table. Let’s now dictate that only six months of archives should ever exist on the primary server. Given that constraint, this is how we could proceed:
-- Do this on some kind of archive server

CREATE USER arc_user PASSWORD 'PasswordsAreLame';

CREATE TABLE sensor_log (
  id            INT PRIMARY KEY,
  location      VARCHAR NOT NULL,
  reading       BIGINT NOT NULL,
  reading_date  TIMESTAMP NOT NULL,
  snapshot_dt   TIMESTAMP WITHOUT TIME ZONE
);

GRANT ALL ON sensor_log TO arc_user;

-- Back on the data source..,

UPDATE tab_tier.tier_root
   SET lts_threshold = '6 months'::INTERVAL,
       lts_target = 'public.sensor_log_archive'
 WHERE root_schema = 'public'
   AND root_table = 'sensor_log';

CREATE EXTENSION postgres_fdw;

CREATE USER arc_user PASSWORD 'PasswordsAreLame';
GRANT tab_tier_role TO arc_user;
GRANT ALL ON ALL TABLES IN SCHEMA PUBLIC TO tab_tier_role;

CREATE SERVER arc_srv
  FOREIGN DATA WRAPPER postgres_fdw
  OPTIONS (dbname 'postgres', host 'archive-host');

CREATE USER MAPPING FOR arc_user
  SERVER arc_srv
  OPTIONS (USER 'arc_user', password 'PasswordsAreLame');

CREATE FOREIGN TABLE sensor_log_archive (
  id            INT,
  location      VARCHAR NOT NULL,
  reading       BIGINT NOT NULL,
  reading_date  TIMESTAMP NOT NULL,
  snapshot_dt   TIMESTAMP WITHOUT TIME ZONE

) SERVER arc_srv OPTIONS (TABLE_NAME 'sensor_log');

GRANT INSERT ON sensor_log_archive TO tab_tier_role;

-- Connect as arc_user, then run this:

SELECT tab_tier.archive_tier('public', 'sensor_log');

SELECT COUNT(*) FROM sensor_log_archive;

  COUNT
---------
3263360 |
Whew! That was a lot of work. Maybe a future version of tab_tier should provide a wrapper for that. In any case, all we did was set up a foreign table on a remote server, create a separate user to handle the data movement, and tell tab_tier about our six month threshold for long term storage, and the target table itself.
Using a foreign table isn’t required here, since the target can be any kind of table, but isn’t that the whole point of this exercise? The cool thing about Postgres foreign data wrappers is that we could have used any of them. In this case we’re just moving data to another remote Postgres instance, but we could have dumped everything into Cassandra or Hadoop instead. Take that, subspace!
For those who noticed all of the ridiculous GRANT statements, please remember this is only for demonstration purposes. A real system would probably use ALTER DEFAULT PRIVILEGES to give tab_tier_role more limited control over a specific schema and tables specifically designed for archival. The extension doesn’t add its own privileges—even to tables it creates—in case controls are tightly locked down. We don’t want to hijack any carefully laid down security. Instead tab_tier just propagates any ACLs it finds on root tables to new partitions.
This is the same reason we ran the archive_tier (or archive_all_tiers) routine as a different user. Since we’re using a foreign user mapping, we want to limit data leak potential by isolating the movement process from the table owner or a superuser. We recommend using this approach for any foreign table usage whenever possible.
With all of that out of the way, we still need to clean up. We archived all of the partition content, but the partitions themselves are still sitting around and gathering dust. Let’s fix that by running one final step as the owner of sensor_log or any superuser:
SELECT part_table
  FROM tab_tier.tier_part
 WHERE is_archived;

       part_table
------------------------
 sensor_log_part_201410
 sensor_log_part_201411
 sensor_log_part_201412
 sensor_log_part_201501
 sensor_log_part_201502
 sensor_log_part_201503
 sensor_log_part_201504
 sensor_log_part_201505
 sensor_log_part_201506
 sensor_log_part_201507
 sensor_log_part_201508
 sensor_log_part_201509
 sensor_log_part_201510

SELECT tab_tier.drop_archived_tiers();

SELECT COUNT(*) FROM sensor_log_archive;

  COUNT
---------
1736640 |
During the archival process itself, tab_tier marks the related metadata so archived tables will no longer be used in any of the data movement functions. It also makes them an easy target for removal with a maintenance function. We can see that everything worked as a large portion of our data is no longer part of the sensor_log inheritance tree. Now the archived data is securely located on another system that’s probably geared more toward OLAP use, or some incomprehensible Hive we don’t have to worry about.
I for one, welcome our incomprehensible Hive overlords.
Menos para os revisores…

Meditar é preciso. Revisar também.
Facilmente se observa que o texto, lido hoje na Galileu online, não foi revisado.
Primeira cochilada, mais do que evidente: professional. (Como essa é a forma em inglês, aumentam minhas suspeitas de que o texto foi traduzido e não mal revisado.) Em português, escreve-se profissional.
Qua? A pressa na tradução e a falta de revisão uniram o que e o a. O correto seria “de que a meditação”. Mas no início da frase há um bom acerto: lembre-se de que. Quem se lembra, lembra-se de alguma coisa. Quem lembra, lembra alguma coisa.
Não vou comentar o restante da frase, já que é um especialista que está dizendo. Mas acho difícil acreditar que a meditação vá fazer o sujeito ficar bombadão como os exercícios na academia.

Crossfit é pros fracos. Eu tô meditando!
Um gerente ou um engenheiro. Essa é uma construção típica do inglês, não usada, ou desnecessária, em português. Por aqui, dizemos e escrevemos apenas: Não importa se você é gerente ou engenheiro.
Por fim, a forma correta é bem-estar. Mesmo com a lambança do Acordo Ortográfico, esse necessário hífen foi mantido. Bem-estar é substantivo; bem estar é o mesmo que estar bem. “Para ele bem estar, estamos cuidando de seu bem-estar.” “Sono de qualidade garante seu bem-estar o dia todo.” “Para eu bem estar, preciso dormir bem.”
Aprendeu? Medite, mas não dispense a academia. E a revisão de seus textos.
Abraço.
O post Menos para os revisores… apareceu primeiro em Que falta faz um revisor!.
Utilizando o Optimize for ad-hoc workloads
O servidor SQL Server possui a configuração Optimize for ad-hoc workloads, sobre a qual já escrevi uma dica antes.
O SQL Server sempre cria um cache do plano de execução das queries que executamos, quer sejam stored procedures ou queries ad hoc. Porém, quando nossa atividade no servidor é demasiadamente focada em queries ad hoc – instruções SQL enviadas diretamente ao servidor, ao contrário do uso de procedures -, corremos o risco de que a criação dos planos de execução consuma memória de forma inadequada.
Isso pode acontecer porque é possível que muitas das queries ad hoc que executamos no servidor jamais se repitam, por isso a armazenagem do plano de execução pode ser um desperdício de memória.
Para resolver este problema, podemos utilizar a configuração ‘Optimize for Ad hoc queries’. Quando esta configuração está ativada, o servidor apenas guarda o plano de execução da query em cache na segunda vez que ela for executada, não da primeira.
Na primeira execução é criado um stub em cache, contendo apenas uma contagem de execução da query. Na segunda execução, o stub é substituído pelo plano de execução real.
Para ativar essa configuração, precisamos primeiro ativar a exibição de configurações avançadas:
sp_configure 'show advanced options',1
GO
reconfigure
GO
Em seguida, ativar a configuração:
sp_configure 'optimize for ad hoc workloads',1
GO
reconfigure
go
Para desativar, utilizamos as mesmas instruções, trocando “1” por “0”.
Vamos fazer uma simulação para que você veja o efeito gerado. Utilizando o banco AdventureWorks, rode em um ambiente de teste as seguintes instruções:
dbcc freeproccache
go
select * from person.person Where LastName='Raheem'
go
Agora vamos verificar o resultado dessa execução no cache:
select usecounts,cacheobjtype,objtype,size_in_bytes,[text]
from sys.dm_exec_cached_plans
    cross apply sys.dm_exec_sql_text(plan_handle)
Observe na imagem abaixo o tamanho guardado no cache, indicando que o plano de execução está no cache.

Agora ative o ‘optimize for ad hoc workloads’, conforme indiquei acima, e repita a execução dos mesmos trechos acima. Veja o resultado no cache:

Desta vez, apenas um stub foi guardado no cache; não o plano inteiro. Com isso, temos uma economia de memória caso essa query não venha a ser utilizada novamente. Execute novamente a query (sem limpar o cache) e confira o resultado no cache:

Agora o stub foi transformado em plano de execução realmente compilado. Ele não soma as contagens, que continua sendo um, afinal o plano compilado ainda não foi re-utilizado. Execute novamente a mesma query e confira o cache; assim poderá observar a contagem aumentando, como na imagem abaixo.

Todo servidor sempre possui alguma quantidade de queries ad-hoc. Considero essa configuração uma boa prática na grande maioria dos servidores. São poucas as exceções.
Paginando dados com OffSet e Fetch
Uma nova forma de realizar paginação na busca de informações no SQL Server é utilizando as cláusulas Offset/Fetch que foram criadas no SQL Server 2012. Veja como é a sintaxe:
select firstname,lastname from person.person
order by businessentityID
offset 0 rows
fetch next 10 rows only
No exemplo acima, estamos buscando as primeiras 10 linhas da tabela person (banco adventureworks2012). Para buscar as próximas 10 linhas, basta alterar para que fique da seguinte forma:
select firstname,lastname from person.person
order by businessentityID
offset 10 rows
fetch next 10 rows only
Porém nem tudo são flores. Para gerar o efeito da instrução offset, saltando linhas, o SQL Server utiliza um index scan. O total de linhas do scan é o total somando do offset mais o fetch, conforme mostra a figura abaixo.

Dessa forma, existe uma perda gradual de performance conforme avançamos na paginação com offset/fetch, até atingir o pior cenário possível, na última página.
Assim sendo, o uso de offset/fetch é muito prático, mas deve ser limitado a result sets não muito grandes, pois para result sets maiores a perda de performance ao longo das páginas pode ser considerável.
Queries do Dia a Dia – Monitorando o Crescimento de Tabelas e Bases no SQL Server
By fabricio Olá Pessoal, Hoje vou compartilhar com vocês um Script que utilizo em todos os clientes que realizo um monitoramento diário do SQL Server. É um script que irá armazenar diariamente o tamanho das tabelas de todas as bases de dados e, com isso, você conseguirá monitorar o quanto suas tabelas e base estão crescendo por […]
Fonte: FABRICIO LIMA
É fim de semana! É hora de limpar o seu Linux Ubuntu

PHP e Performance, parte 1
O primeiro artigo trata de usar o unset() para controlar o momento da desalocação de memória.
Enviado por Jonathan André Schweder (jonathanschwederΘgmail·com)
O artigo "PHP e Performance, parte 1" foi originalmente publicado no site BR-Linux.org, de Augusto Campos.
Josh Berkus: Don't delete pg_xlog
pg_log, pg_xlog and pg_clog
pg_log
You can freely delete, rename, compress, and move files in pg_log without penalty, as long as the postgres user still has rights to write to the directory. If pg_log becomes bloated with many large files, you probably need to decrease the number of things you're logging by changing the settings in postgresql.conf.
Do note that if you "delete" the current log file on a Linux or Unix system, it may remain open but not accessible, just sending any successive log messages to /dev/null until the file rotates.
pg_xlog
If replication, archiving, or PITR is failing, this directory can become bloated with gigabytes of logs the database server is saving for when archiving resumes. This can cause you to run out of disk space
.
Unlike pg_log, you may not freely delete, move, or compress files in this directory. You may not even move the directory without symlinking it back to its original location. Deleting pg_xlog files may result in unrecoverable database corruption.
If you find yourself in a situation where you've got 100GB of files in pg_xlog and the database won't start, and you've already disabled archiving/replication and tried clearing disk space every other way, then please take two steps:
- Move files from pg_xlog to a backup disk or shared network drive, don't delete them, and
- Move only a few of the oldest files, enough to allow PostgreSQL to start again.
pg_clog
$PGDATA/pg_clog contains a log of transaction metadata. This log tells PostgreSQL which transactions completed and which did not. The clog is small and never has any reason to become bloated, so you should never have any reason to touch it.
Should you ever delete files from pg_clog, you might as well delete the entire database directory. There is no recovery from a missing clog.
Note that this means, if you back up the files in a $PGDATA directory, you should make sure to include the pg_clog and pg_xlog as well, or you may find that your backup is not usable.
POST de dados de formulário com cURL
cURL é o utilitário mágico que permite que os desenvolvedores baixem conteúdo de uma URL, explorem cabeçalhos de resposta, obtenham cotações de ações, confirmem se a codificação GZip está funcionando, e muito mais. Outra grande utilização do cURL para linha de comando é postar dados de formulário para um servidor, especialmente ao testar processamentos de formulários de moderados a avançados. E, assim como outros comandos cURL, postar dados de formulário é incrivelmente simples.
POSTando dados de formulário com cURL
Comece o seu comando cURL com curl -X POST e depois adicione -F para cada field=value que você deseja adicionar ao POST:
curl -X POST -F 'username=davidwalsh' -F 'password=something' http://domain.tld/post-to-me.php
Se você estiver usando PHP, você pode usar print_r na variável $ _POST para ver se o servidor recebeu os dados POST conforme o esperado:
Array(
  'username' => 'davidwalsh',
  'password' => 'something'
)
Se você precisa enviar um tipo de dados específico ou um cabeçalho com cURL, use -H para adicionar um cabeçalho:
# -d to send raw data
curl -X POST -H 'Content-Type: application/json' -d '{"username":"davidwalsh","password":"something"}' http://domain.tld/login
POSTagem de arquivos com cURL
POSTar um arquivo com cURL é ligeiramente diferente, você precisa adicionar um @ antes do local do arquivo, após o nome do campo:
curl -X POST -F 'image=@/path/to/pictures/picture.jpg' http://domain.tld/upload
Utilizar PHP para explorar o array variável $ _FILES irá mostrar dados do arquivo como se ele fora enviado pelo formulário no navegador:
Array(
  "image": array(
    "name" => "picture.jpg"
    "type" => "image/jpeg",
    "tmp_name" => "/path/on/server/to/tmp/phprj5rkG",
    "error" => 0,
    "size" => 174476
  )
)
POSTar o conteúdo do arquivo com cURL é provavelmente mais fácil do que você pensou, certo?
A primeira vez que eu precisei enviar dados de arquivos a partir da linha de comando eu pensei que iria enfrentar uma luta; em vez disso, descobri que cURL faz esse processo facilmente!
***
David Walsh faz parte do time de colunistas internacionais do iMasters. A tradução do artigo é feita pela redação iMasters, com autorização do autor, e você pode acompanhar o artigo em inglês no link: https://davidwalsh.name/curl-post-file
Mensagem do anunciante:
Conheça a Umbler, startup de Cloud Hosting por demanda feita para agências e desenvolvedores. Experimente grátis!
Visualização de Postgres Plan Query
Depois de uma temporada recente na otimização de query, eu mais uma vez me encontrei desejando uma maneira melhor para ver planos de query produzidos por EXPLAIN. Então, eu finalmente decidi fazer algo a respeito e o resultado é Postgres EXPLAIN Visualizer (ou Pev):

Por que Pev
Eu queria uma ferramenta que pode fazer planos simples de entender e ser visualmente agradável. Mais especificamente, eu queria:
- mínimo ruído visual
- insights
- alto grau de personalização
- plano no contexto da query
Vamos ver como Pev ajuda com isso. Vou usar o plano produzido pela query a seguir para ilustração:
SELECT C.STATE,SUM(O.NETAMOUNT), SUM(O.TOTALAMOUNT)
FROM CUSTOMERS C
  INNER JOIN CUST_HIST CH ON C.CUSTOMERID = CH.CUSTOMERID
  INNER JOIN ORDERS O ON CH.ORDERID = O.ORDERID
GROUP BY C.STATE
  LIMIT 10 OFFSET 1
Gostaria também de salientar que Pev só funciona com planos de EXPLAIN em formato JSON. Para produzir um, use este código:
EXPLAIN (ANALYZE, COSTS, VERBOSE, BUFFERS, FORMAT JSON)
Visualização dos nós
Primeiro, Pev usa um gráfico clássico de árvore para visualizar o plano. Eu acho que isso é mais fácil de ver do que a árvore da esquerda para a direita usada por PgAdmin:

Por padrão, cada nó exibe seu tipo + detalhes relevantes (como o objeto que está sendo examinado ou a condição join), duração e informações importantes (como se esse nó é algum tipo anexo):

Falando de insights, Pev atualmente calcula o seguinte:
- Nós outlier (maior, mais lento, mais caro)
- Nós com estimativas mal planejadas (planejados não atendidos por um fator de 100 ou mais)
Pev também permite várias personalizações, como mostrar detalhes de estimativas planejadas e um gráfico de linhas, duração ou custo:

Se você quiser ver absolutamente tudo que o Postgres sabe sobre o nó, basta clicar sobre o título para obter a visão estendida:

Usando essas personalizações (disponíveis no menu de configurações do lado esquerdo), você pode facilmente criar gráficos como o abaixo, que mostra o quão rápido cada nó é:

Query Display
Eu pessoalmente acho que é difícil mapear mentalmente o plano que eu estou vendo com a query que foi gerada. Pev ajuda a esse respeito, mostrando-lhe a query junto ao seu nó e destacando a parte relevante sempre que possível. Basta clicar no ícone do banco de dados azul, pequeno, dentro do nó:

Devo admitir que destacar a parte relevante da query é bastante rudimentar nesse ponto, mas eu estou esperançoso de que isso pode ser melhorado no futuro.
Mais duas coisas
Pev é fortemente influenciado pelo excelente explain.depesz.com. Eu aprendi muito sobre como o planejador Postgres funciona usando-o e lendo a ajuda.
Se você usar o Pev, por favor me deixe saber sua opinião em @alexTatiyants. Se você quiser melhorá-lo, o código está no GitHub.
***
Alex Tatiyants faz parte do time de colunistas internacionais do iMasters. A tradução do artigo é feita pela redação iMasters, com autorização do autor, e você pode acompanhar o artigo em inglês no link: http://tatiyants.com/postgres-query-plan-visualization/
Mensagem do anunciante:
Conheça a Umbler, startup de Cloud Hosting por demanda feita para agências e desenvolvedores. Experimente grátis!
O fim da era dos frameworks full stack
Venho acompanhando de perto a evolução dos frameworks PHP desde meados de 2004 e me parece que todos estão caminhando para uma abordagem cada vez mais focada ao conceito de micro-frameworks.
Um pouco dessa história… Nos primórdios havia o caos, e então veio o Ruby on Rails… E as outras linguagens viram que era legal e criaram suas versões do “framework MVC perfeito”, como o Zend Framework, Symfony, CakePHP, Code Igniter etc. Mas todos eles eram muito monolíticos, com sua grande quantia de componentes fortemente acoplados e com isso o desenvolvimento de grandes projetos, com manutenções e expansões constantes tornou-se cada vez mais complexa. Percebendo isso, grandes figuras do mundo PHP se uniram e criaram um grupo chamado PHP-FIG, que criou os padrões PSR, o que permitiu o surgimento do Composer e outras inovações.
A próxima evolução dos frameworks corrigiu um grande número de problemas das suas versões anteriores e com nomes como Zend Framework 2 e Symfony 2, vimos uma nova era de desenvolvimento surgir. Projetos menos acoplados, componentes mais facilmente intercambiáveis, desenvolvedores mais produtivos e felizes.
Mas usar um framework full stack como o ZF2 ainda era grande demais para a maioria das aplicações que desenvolvemos no dia a dia, especialmente quando começamos a usar arquiteturas baseadas em serviços e APIs. Isso acarretou a criação de micro-frameworks como o Slim e o Silex. Com os micro-frameworks agora podemos iniciar um projeto de forma rápida e simples e ir adicionando componentes na proporção que eles são necessários. É muito mais fácil iniciar com algo pequeno e adicionar recursos do que começar um projeto com algo enorme e remover componentes desnecessários e que podem causar perda de performance.
A próxima grande evolução que nos levou a esse caminho foi a aprovação do PSR7, que padroniza a forma como os frameworks e componentes manipulam Requests e Responses, o coração de todo e qualquer aplicativo web. Ao invés de usarmos o padrão MVC, que foi portado do mundo desktop para a web, agora temos um padrão que nasceu para este ambiente dinâmico e específico. Com a adoção deste padrão, estamos vendo os grandes frameworks como o Zend Framework, Symfony e Laravel se tornando micro-frameworks (ZF3, Symfony 3, Lumen) e projetos que já nasceram com essa abordagem, como o Slim, evoluindo a passos largos.
Então, me parece seguro dizer que o futuro pertence aos micro-frameworks, micro-serviços, containers e cloud computing. É hora de pensarmos em nossos projetos desta forma e usufruirmos de toda a tecnologia que está surgindo ao nosso redor.
O que você acha? Estamos vendo o fim dos frameworks full stack?
Mensagem do anunciante:
Infraestrutura financeira descomplicada é com a iugu! Tão simples que parece brincadeira! Clique aqui e dê um up nos negócios!
Tomas Vondra: On the usefulness of expression indexes
When teaching PostgreSQL trainings, both on basics and advanced topics, I often find out the attendees have very little idea how powerful the expression indexes may be (if they are aware of them at all). So let me give you a brief overview.
So, let’s say we have a table, with a range of timestamps (yes, we have generate_series function that can generate dates):
CREATE TABLE t AS
SELECT d, repeat(md5(d::text), 10) AS padding
  FROM generate_series(timestamp '1900-01-01',
                       timestamp '2100-01-01',
                       interval '1 day') s(d);
VACUUM ANALYZE t;
The table also includes a padding column, to make it a bit larger. Now, let’s do a simple range query, selecting just one month from the ~200 years included in the table. If you do explain on the query, you’ll see something like this:
EXPLAIN SELECT * FROM t WHERE d BETWEEN '2001-01-01' AND '2001-02-01';

                               QUERY PLAN
------------------------------------------------------------------------
 Seq Scan on t  (cost=0.00..4416.75 rows=32 width=332)
   Filter: ((d >= '2001-01-01 00:00:00'::timestamp without time zone)
        AND (d <= '2001-02-01 00:00:00'::timestamp without time zone))
(2 rows)
and on my laptop, this runs in ~20ms. Not bad, considering this has to walk through the whole table with ~75k rows.
But let’s create an index on the timestamp column (all indexes here are the default type, i.e. btree, unless mentioned explicitly):
CREATE INDEX idx_t_d ON t (d);
And now let’s try to run the query again:
                               QUERY PLAN
------------------------------------------------------------------------
 Index Scan using idx_t_d on t  (cost=0.29..9.97 rows=34 width=332)
   Index Cond: ((d >= '2001-01-01 00:00:00'::timestamp without time zone)
            AND (d <= '2001-02-01 00:00:00'::timestamp without time zone))
(2 rows)
and this runs in 0.5ms, so roughly 40x faster. But that was of course a simple indexes, created directly on the column, not expression index. So let’s assume we instead need to select data from each 1st day of each month, doing a query like this
SELECT * FROM t WHERE EXTRACT(day FROM d) = 1;
which however can’t use the index, as it needs to evaluate an expression on the column while the index is built on the column itself, as shown on the EXPLAIN ANALYZE:
                               QUERY PLAN
------------------------------------------------------------------------
 Seq Scan on t  (cost=0.00..4416.75 rows=365 width=332)
                (actual time=0.045..40.601 rows=2401 loops=1)
   Filter: (date_part('day'::text, d) = '1'::double precision)
   Rows Removed by Filter: 70649
 Planning time: 0.209 ms
 Execution time: 43.018 ms
(5 rows)
So not only this has to do a sequential scan, it also has to do the evaluation, increasing the query duration to 43ms.
The database is unable to use the index for multiple reasons. Indexes (at least btree indexes) rely on querying sorted data, provided by the tree-like structure, and while the range query can benefit from that, the second query (with `extract` call) can’t.
Note: Another issue is that the set of operators supported by indexes (i.e. that can be evaluated on indexes directly) is very limited. And the “extract” function is not supported, so the query can’t work around the ordering issue by using a Bitmap Index Scan.
In theory the database might try to transform the condition into range conditions, but that is extremely difficult and specific to expression. In this case we’d have to generate an infinite number of such “per-day” ranges, because the planner does not really know the min/max timestamps in the table. So the database does not even try.
But while the database does not know how to transform the conditions, developers often do. For example with conditions like
(column + 1) >= 1000
it’s not difficult to rewrite it like this
column >= (1000 - 1)
which works just fine with the indexes.
But what if such transformation is not possible, as for example for the example query
SELECT * FROM t WHERE EXTRACT(day FROM d) = 1;
In this case the developer would have to face the same issue with unknown min/max for the d column, and even then it would generate a lot of ranges.
Well, this blog post is about expression indexes, and so far we have only used regular indexes, built on the column directly. So, let’s create the first expression index:
CREATE INDEX idx_t_expr ON t ((extract(day FROM d)));
ANALYZE t;
which then gives us this explain plan
                               QUERY PLAN
------------------------------------------------------------------------
 Bitmap Heap Scan on t  (cost=47.35..3305.25 rows=2459 width=332)
                        (actual time=2.400..12.539 rows=2401 loops=1)
   Recheck Cond: (date_part('day'::text, d) = '1'::double precision)
   Heap Blocks: exact=2401
   ->  Bitmap Index Scan on idx_t_expr  (cost=0.00..46.73 rows=2459 width=0)
                                (actual time=1.243..1.243 rows=2401 loops=1)
         Index Cond: (date_part('day'::text, d) = '1'::double precision)
 Planning time: 0.374 ms
 Execution time: 17.136 ms
(7 rows)
So while this does not give us the same 40x speedup as the index in the first example, that’s kinda expected as this query returns far more tuples (2401 vs. 32). Moreover those are spread through the whole table and not as localized as in the first example. So it’s a nice 2x speedup, and in many real-world cases you’ll see much larger improvements.
But the ability to use indexes for conditions with complex expressions is not the most interesting information here – that’s kinda the reason why people create expression indexes. But that’s not the only benefit.
If you look at the two explain plans presented above (without and with the expression index), you might notice this:
                               QUERY PLAN
------------------------------------------------------------------------
 Seq Scan on t  (cost=0.00..4416.75 rows=365 width=332)
                (actual time=0.045..40.601 rows=2401 loops=1)
 ...
                               QUERY PLAN
------------------------------------------------------------------------
 Bitmap Heap Scan on t  (cost=47.35..3305.25 rows=2459 width=332)
                        (actual time=2.400..12.539 rows=2401 loops=1)
 ...
Right – creating the expression index significantly improved estimates. Without the index we only have statistics (MCV + histogram) for raw table columns, so the database does not know how to estimate the expression
EXTRACT(day FROM d) = 1
So it instead applies a default estimate for equality conditions, which is 0.5% of all rows – as the table has 73050 rows, we end up with an estimate of just 365 rows. It’s common to see much worse estimation errors in real-world applications.
With the index, however, the database also collected statistics on columns of the index, and in this case the column contains results of the expression. And while planning, the optimizer notices this and produces much better estimate.
This is a huge benefit, and may help with fixing some cases of poor query plans caused by inaccurate estimates. Yet most people are unaware of this handy tool.
And the usefulness of this tool only increased with the introduction of JSONB data type in 9.4, because it’s about the only way to collect statistics about the contents of the JSONB documents.
When indexing JSONB documents, two basic indexing strategies exist. You can either create a GIN/GiST index on the whole document, e.g. like this
CREATE INDEX ON t USING GIN (jsonb_column);
which allows you to query arbitrary paths in the JSONB column, use containment operator to match sub-documents, etc. That’s great, but you still have only the basic per-column statistics, which are
not very useful as the documents are treated as scalar values (and no one matches whole documents or uses range of documents).
Expression indexes, for example created like this:
CREATE INDEX ON t ((jsonb_column->'id'));
will only be useful for the particular expression, i.e. this newly created index will be useful for
SELECT * FROM t WHERE jsonb_column ->> 'id' = 123;
but not for queries accessing other JSON keys, like ‘value’ for example
SELECT * FROM t WHERE jsonb_column ->> 'value' = 'xxxx';
This is not to say that GIN/GiST indexes on the whole document are useless, but you have to choose. Either you create a focused expression index, useful when querying a particular key and with the added benefit of statistics on the expression. Or you create a GIN/GiST index on the whole document, able to handle queries on arbitrary keys, but without the statistics.
However you can have a cake and eat it too, in this case, because you can create both indexes at the same time, and the database will choose which of them to use for individual queries. And you’ll have accurate statistics, thanks to the expression indexes.
Sadly, you can’t eat the whole cake, because expression indexes and GIN/GiST indexes use different conditions
-- expression (btree)
SELECT * FROM t WHERE jsonb_column ->> 'id' = 123;

-- GIN/GiST
SELECT * FROM t WHERE jsonb_column @> '{"id" : 123}';
so the planner can’t use them at the same time – expression indexes for estimation and GIN/GiST for execution.
pgBackRest 1.0 Released
April 17, 2016: Crunchy Data is proud to announce pgBackRest 1.0, Reliable PostgreSQL Backup & Restore.
Release 1.0
The first stable of release of pgBackRest introduces a new, more capable repository format, simpler configuration, and comprehensive support for backup and restore of symlinked directories and files.
There are a number of important changes in pgBackRest 1.0 so be sure to read the release notes very carefully before upgrading.
Links
Features
Multithreaded Backup & Restore
Compression is usually the bottleneck during backup operations but, even with now ubiquitous multi-core servers, most database backup solutions are still single-threaded. pgBackRest solves the compression bottleneck with multithreading.
Utilizing multiple cores for compression makes it possible to achieve 1TB/hr raw throughput even on a 1Gb/s link. More cores and a larger pipe lead to even higher throughput.
Local or Remote Operation
A custom protocol allows pgBackRest to backup, restore, and archive locally or remotely via SSH with minimal configuration. An interface to query PostgreSQL is also provided via the protocol layer so that remote access to PostgreSQL is never required, which enhances security.
Full, Incremental, & Differential Backups
Full, differential, and incremental backups are supported. pgBackRest is not susceptible to the time resolution issues of rsync, making differential and incremental backups completely safe.
Backup Rotation & Archive Expiration
Retention polices can be set for full and differential backups to create coverage for any timeframe. WAL archive can be maintained for all backups or strictly for the most recent backups. In the latter case WAL required to make older backups consistent will be maintained in the archive.
Backup Integrity
Checksums are calculated for every file in the backup and rechecked during a restore. After a backup finishes copying files, it waits until every WAL segment required to make the backup consistent reaches the repository.
Backups in the repository are stored in the same format as a standard PostgreSQL cluster (including tablespaces). If compression is disabled and hard links are enabled it is possible to snapshot a backup in the repository and bring up a PostgreSQL cluster directly on the snapshot. This is advantageous for terabyte-scale databases that are time consuming to restore in the traditional way.
All operations utilize file and directory level fsync to ensure durability.
Backup Resume
An aborted backup can be resumed from the point where it was stopped. Files that were already copied are compared with the checksums in the manifest to ensure integrity. Since this operation can take place entirely on the backup server, it reduces load on the database server and saves time since checksum calculation is faster than compressing and retransmitting data.
Streaming Compression & Checksums
Compression and checksum calculations are performed in stream while files are being copied to the repository, whether the repository is located locally or remotely.
If the repository is on a backup server, compression is performed on the database server and files are transmitted in a compressed format and simply stored on the backup server. When compression is disabled a lower level of compression is utilized to make efficient use of available bandwidth while keeping CPU cost to a minimum.
Delta Restore
The manifest contains checksums for every file in the backup so that during a restore it is possible to use these checksums to speed processing enormously. On a delta restore any files not present in the backup are first removed and then checksums are taken for the remaining files. Files that match the backup are left in place and the rest of the files are restored as usual. Since this process is multithreaded, it can lead to a dramatic reduction in restore times.
Advanced Archiving
Dedicated commands are included for both pushing WAL to the archive and retrieving WAL from the archive.
The push command automatically detects WAL segments that are pushed multiple times and de-duplicates when the segment is identical, otherwise an error is raised. The push and get commands both ensure that the database and repository match by comparing PostgreSQL versions and system identifiers. This precludes the possibility of misconfiguring the WAL archive location.
Asynchronous archiving allows compression and transfer to be offloaded to another process which maintains a continuous connection to the remote server, improving throughput significantly. This can be a critical feature for databases with extremely high write volume.
Tablespace & Link Support
Tablespaces are fully supported and on restore tablespaces can be remapped to any location. It is also possible to remap all tablespaces to one location with a single command which is useful for development restores.
File and directory links are supported for any file or directory in the PostgreSQL cluster. When restoring it is possible to restore all links to their original locations, remap some or all links, or restore some or all links as normal files or directories within the cluster directory.
Compatibility with PostgreSQL >= 8.3
pgBackRest includes support for versions down to 8.3, since older versions of PostgreSQL are still regularly utilized.
About
pgBackRest aims to be a simple, reliable backup and restore system that can seamlessly scale up to the largest databases and workloads. Instead of relying on traditional backup tools like tar and rsync, pgBackRest implements all backup features internally and uses a custom protocol for communicating with remote systems. Removing reliance on tar and rsync allows for better solutions to database-specific backup challenges. The custom remote protocol allows for more flexibility and limits the types of connections that are required to perform a backup which increases security.
Crunchy Data supports the ongoing and active development of pgBackRest as an entirely open source project, released under the BSD-compatible MIT license.
How to Visualize DC/OS
We’re excited to see that DC/OS platform has gone open source. What’s more we’re fortunate enough to have been invited along for the ride! This post will give you a short overview of what’s happening, why it matters, and how Sysdig is involved.
What is DC/OS?
DC/OS (Data Center Operating System) was originally created by Mesosphere. It takes two key open source projects, Mesos and Marathon, and enables you to abstract away distributed resources into one “pool” of memory, compute, and disk. DC/OS bundles additional services such as mesos-dns, tooling like a CLI, a GUI, a repository for the packages that you want to run, and frameworks like Marathon (a.k.a. distributed init), Chronos (a.k.a. distributed cron), and more. The end result is a simple, packaged way to run complex distributed applications with or without containers.
All the power of DC/OS, now open source!
Why does it matter?
As most of you know we’re currently amidst a major platform shift – the move from virtual machines to containers will allow organizations to deliver more functionality, faster. Projects like DC/OS matter because they simplify the process of getting an environment running that can effectively manage and enable containers in the first place. In short, containers are great, but only if you have something like DC/OS to take your containers into production.
But you’ve still got to monitor it all!
It was just a couple weeks back that Sysdig announced its formal partnership with Mesosphere, and more importantly, our technical integration with Mesos, Marathon, and DC/OS.
And because the open sourced DC/OS is full-featured DC/OS, our integration works exactly the same across our open source and commercial products. The link above has an example of deep troubleshooting… instead of recreating that I’ll provide a “getting started” example.
Visualizing DC/OS at Work
Deploying applications with DC/OS is a totally new paradigm, so it can be challenging to wrap your head around what exactly the platform is doing. How is it allocating resources? Where is your application actually running?
Let’s suppose you’re deploying a few applications on top of DC/OS and you’d like to understand:
- What are the applications?
- What resources are they using?
- How are they performing?
Enter Sysdig Cloud.It provides real-time topology mapping that allows you to automatically visualize the physical resources at work. You simply use our one-line command to deploy the Sysdig agent. No additional Sysdig Cloud agent configuration is required when the Mesos master is installed with default settings on the nodes where the Mesos API server runs (“Master” nodes). The Sysdig Cloud agent will look for the process named “mesos-master”. If the process is found at any time, our agent will automatically connect to the local Mesos and Marathon (if available) API servers, to collect cluster configuration and current state metadata in addition to host metrics.
OK, so point-and-click, you’ve pushed out your applications on DC/OS.
Services view within DC/OS
Assuming you’ve instrumented the hosts running DC/OS, you can get a view like this which tells you how the machines are doing from an infrastructure perspective:

Nothing too unusual (or insightful) here… this is just straight infrastructure monitoring. But let’s start to look at relationships of these hosts in a topology:

OK, so this is slightly more interesting. We can see communication between the hosts, request times, and resource usage of the machines themselves all in one place. But how does this relate to your app? And what is DC/OS doing as a part of this? Let’s drill down into these hosts…

And we see small boxes that each represent a container running its own software… it’s spaghetti! And that’s a good thing, it means DC/OS is doing its job. DC/OS is distributing containers across machines in a way that makes the optimal use of underlying resources.
As we mentioned, Sysdig also integrates with the master to collect metadata about your system. We use that data to take physical data, like what you’re seeing above, and create logical picture of what your apps are doing. When you apply the metadata, you get this:

OK, now we’re cooking. We can see a few applications, as well as the relationships between their components, as well as the resources they are using. While the combination of physical and logical topology is especially useful for troubleshooting, it’s also a huge help in understanding the basics of how DC/OS works in the first place.
Just the beginning…
Deploying a containerized application is just a step in your overall process from conceptualizing an application all the way through running it in production. DC/OS makes it simple to get those apps running, and Sysdig is very happy to partner with the DC/OS team to make monitoring just as simple. While in this post we focused on visualizing how an application is deployed on DC/OS, our next post will focus on what your application is doing and how you can troubleshoot it more effectively. Stay tuned!
The post How to Visualize DC/OS appeared first on Sysdig.
5 alternativas ao Microsoft Office para Linux (Parte I)

Ubuntu Insights: HOWTO: Ubuntu on Windows
As announced last week, Microsoft and Canonical have worked together to bring Ubuntu’s userspace natively into Windows 10.
As of today, Windows 10 Insiders can now take Ubuntu on Windows for a test drive! Here’s how…
1) You need to have a system running today’s 64-bit build of Windows 10 (Build 14316).

2) To do so, you may need to enroll into the Windows Insider program here, insider.windows.com.
3) You need to notify your Windows desktop that you’re a Windows Insider, under “System Settings –> Advanced Windows Update options”

4) You need to set your update ambition to the far right, also known as “the fast ring”.
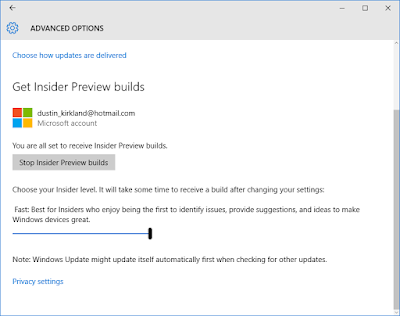
5) You need to enable “developer mode”, as this new feature is very pointedly directed specifically at developers.
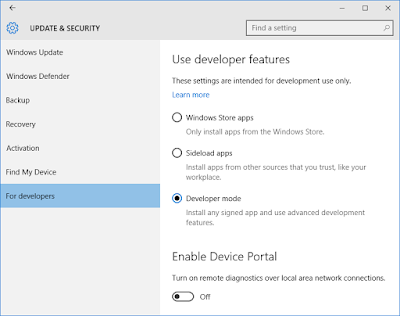
6) You need to check for updates, apply all updates, and restart.
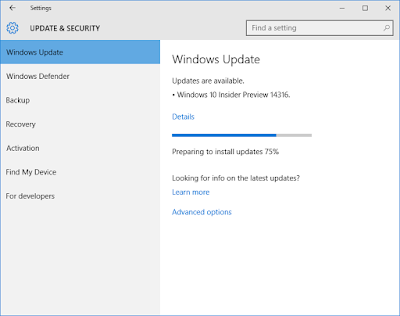
7) You need to turn on the new Windows feature, “Windows Subsystem for Linux (Beta)”. Note (again) that you need a 64-bit version of Windows! Without that, you won’t see the new option.
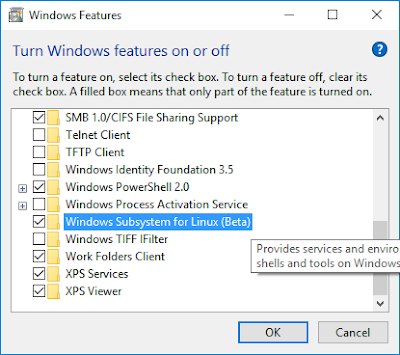
8) You need to reboot again. (Windows sure has a fetish for rebooting!)
9) You press the start button and type “bash”.

10) The first time you run “bash.exe”, you’ll accept the terms of service, download Ubuntu, and then you’re off and running!
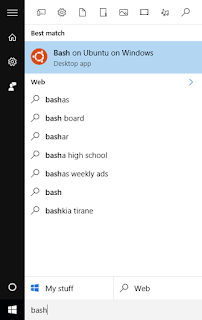
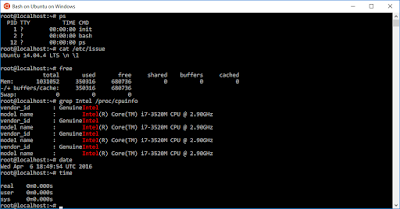
If you screw something up, and you want to start over, simply open a Windows command shell, and run: lxrun /uninstall /full and then just run bash again.
For bonus points, you might also like to enable the Ubuntu monospace font in your console. Here’s how!
a) Download the Ubuntu monospace font, from font.ubuntu.com.
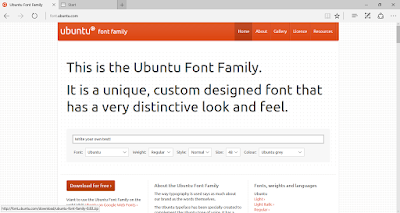
b) Install the Ubuntu monospace font, by opening the zip file you downloaded, finding UbuntuMono-R.ttf, double clicking on it, and then clicking Install.

c) Enable the Ubuntu monospace font for the command console in the Windows registry. Open regedit and find this key: HKEY_LOCAL_MACHINE\SOFTWARE\Microsoft\Windows NT\CurrentVersion\Console\TrueTypeFont and add a new string value name “000” with value data “Ubuntu Mono”

d) Edit your command console preferences to enable the Ubuntu monospace font.

As lágrimas e a graça (Francisco Nunes)
A meu amado Senhor, que não se poupou em Seu amor a um verme como eu.
Não creio no falso evangelho,
aquele que não me serve de espelho:
que não dá nome a meus pecados,
pelo qual os tolos são enganados;
que promete vida fácil, sem dores,
que promete felicidade sem cruz,
que vende tantos favores,
que entrega trevas, e não luz;
que promete bênçãos de Deus em troca de oferta,
oferecidas aos incautos por gente esperta;
que promete para esta vida o que só terei na eternidade,
que faz o homem maior do que Deus. Falsidade!
Eu rejeito o falso evangelho e seu falso Deus!
Eu creio no evangelho da velha Bíblia,
que não esconde que há sofrimento para os que são Seus,
para aqueles que são da divina família.
Creio no que a antiga Bíblia ensina,
e isso é mais do que uma bela doutrina:
que sou um vil pecador;
que nada merecia senão a morte;
que Deus me amou – e que amor! –
e, por amor, mudou minha sorte!
Que Cristo morreu por mim,
pagando a dívida que era minha,
pois eu não podia pagar pelos pecados que eu tinha!
E que Ele estará comigo até o fim!
Ela ensina que a salvação foi dada a mim
por graça, por abundante graça, por graça e nada mais.
E até o final da vida estarei em Cristo assim,
por graça, por abundante graça, por graça e nada mais.
Ela também mui claramente me diz
que ainda não serei totalmente feliz,
mas que até o fim de minha jornada,
carregarei minha cruz, que pode ser bem pesada:
não serei poupado de sofrimento,
enfrentarei dias de muitas lágrimas e tormento;
por vezes andarei sem saber para onde ir,
quase pensando em desistir;
serei atacado por dúvida inclemente,
passarei pelo fogo ardente,
me sentirei sozinho, mesmo cercado pelos meus,
pensarei ter sido esquecido até por Deus!
Serei severamente tentado
e, infelizmente, muitas vezes derrotado.
Mas poderei me erguer e continuar,
se o pecado reconhecer e o abandonar.
Poderei cair muitas vezes,
mas tenho Aquele que por mim sangrou;
Ele é o Deus dos deuses,
Ele é o que desde sempre me amou!
Mas sei – oh, indescritível alegria!
– que naquele assombroso dia,
na glória com meu Senhor,
Ele enxugará de meus olhos toda lágrima,
e esquecerei toda a dor.
Então, olharei para o eterno Cordeiro de Deus
que morreu em meu lugar,
no sublime trono nos céus,
de onde me chama para com Ele estar,
olharei para Suas mãos feridas,
mãos para mim tão queridas,
feridas cruelmente por amor a mim,
e serei eternamente por elas lembrado
– não poderei esquecer jamais:
só estou ali, bem-aventurado,
por graça, por abundante graça, por graça e nada mais.
(scs, 19316)
Toptal's Quick and Practical CSS Cheat Sheet
Tomas Vondra: Tables and indexes vs. HDD and SSD
Although in the future most database servers (particularly those handling OLTP-like workloads) will use a flash-based storage, we’re not there yet – flash storage is still considerably more expensive than traditional hard drives, and so many systems use a mix of SSD and HDD drives. That however means we need to decide how to split the database – what should go to the spinning rust (HDD) and what is a good candidate for the flash storage that is more expensive but much better at handling random I/O.
There are solutions that try to handle this automatically at the storage level by automatically using SSDs as a cache, automatically keeping the active part of the data on SSD. Storage appliances / SANs often do this internally, there are hybrid SATA/SAS drives with large HDD and small SSD in a single package, and of course are solutions to do this at the host directly – for example there’s dm-cache in Linux, LVM also got such capability (built on top of dm-cache) in 2014, and of course ZFS has L2ARC.
But let’s ignore all of those automatic options, and let’s say we have two devices attached directly to the system – one based on HDDs, the other one flash-based. How should you split the database to get the most benefit of the expensive flash? One commonly used pattern is to do this by object type, particularly tables vs. indexes. Which makes sense in general, but we often see people placing indexes on the SSD storage, as indexes are associated with random I/O. While this may seem reasonable, it turns out this is exactly the opposite of what you should be doing.
Let me show you a benchmark …
Let me demonstrate this on a system with both HDD storage (RAID10 built from 4x 10k SAS drives) and a single SSD device (Intel S3700). The system has 16GB of RAM, so let’s use pgbench with scales 300 (=4.5GB) and 3000 (=45GB), i.e. one that easily fits into RAM and a multiple of RAM. Then let’s place tables and indexes on different storage systems (by using tablespaces), and measure the performance. The database cluster was reasonably configured (shared buffers, WAL limits etc.) with respect to the hardware resources. The WAL was placed on a separate SSD device, attached to a RAID controller shared with the SAS drives.
On the small (4.5GB) data set, the results look like this (notice the y-axis starts at 3000 tps):

Clearly, placing the indexes on SSD gives lower benefit compared to using the SSD for tables. While the dataset easily fits into RAM, the changes need to eventually written to disk eventually, and while the RAID controller has a write cache, it can’t really compete with the flash storage. New RAID controllers would probably perform a bit better, but so would new SSD drives.
On the large data set, the differences are much more significant (this time y-axis starts at 0):

Placing the indexes on SSD results in significant performance gain (almost 50%, taking HDD storage as a baseline), but moving tables to the SSD easily beat that by gaining more than 200%. Of course, if you place both tables and index on SSDs, you’ll get improve the performance further – but if you could do that, you don’t need to worry about the other cases.
But why?
Getting better performance from placing tables on SSDs may seems a bit counter-intuitive, so why does it behave like this? Well, it’s probably a combination of several factors:
- indexes are usually much smaller than tables, and thus fit into memory more easily
- the pages in levels of indexes (in the tree) are usually quite hot, and thus remain in memory
- when scanning and index, a lot of the actual I/O is sequential in nature (particularly for leaf pages)
The consequence of this is that a surprising amount of I/O against indexes either does not happen at all (thanks to caching) or is sequential. On the other hand, indexes are a great source of random I/O against the tables.
It’s more complicated, though …
Of course, this was a just a simple example, and the conclusions might be different for substantially different workloads, for example. Similarly, as SSDs are more expensive, systems tend to have more disk space on HDD drives than on SSD drives, so tables may not fit onto the SSD while indexes would. In those cases a more elaborate placement is necessary – for example considering not just the type of the object, but also how often it’s used (and only moving the heavily used tables to SSDs), or even subsets of tables (e.g. by gradually moving old data from SSD to HDD).
A heresia entre os santos (A. W. Tozer)

Essa heresia consiste não tanto em rejeitar, mas em selecionar. O herético simplesmente seleciona as partes das Escrituras que pretende enfatizar e deixa de lado o resto. A etimologia da palavra heresia mostra isso, e também a prática do herético prova o fato.
Certo escritor do século 14 alertou seus leitores no prefácio de um livro: “Cuidado para não adotar alguma coisa de que você gosta, deixando outra de lado, pois é isso que o herético faz. Mas considere tanto uma coisa como a outra.”
O velho escriba sabia muito bem como somos propensos a adotar as partes da verdade que nos agradam e a desconsiderar as outras partes. E isso é heresia.
Quase todo tipo de seita que conhecemos pratica essa arte de selecionar e desconsiderar. As seitas que afirmam não existir inferno, por exemplo, normalmente enfatizam tudo na Bíblia que parece apoiar a posição delas e subestimam ou explicam a seu modo todas as passagens que tratam do castigo eterno.
Mas faremos bem se dermos uma boa olhada naquilo que nós mesmos fazemos. A tendência para a heresia não está restrita às seitas. Por natureza, todos somos heréticos. Nós que nos consideramos doutrinariamente ortodoxos talvez na prática sejamos heréticos de alguma forma. Podemos inconscientemente escolher e dar especial atenção aos textos bíblicos que nos confortam e encorajam e passar por cima dos textos que nos repreendem e alertam. É tão fácil cair nessa armadilha que talvez estejamos nela mesmo sem saber.
Considere por exemplo, uma Bíblia sublinhada. Pode ser uma experiência esclarecedora espiar uma delas às vezes e ver como o dono grifou quase apenas as passagens que o consolam ou que apoiam seus pontos de vista doutrinários.
Em geral, gostamos dos versículos que nos tranquilizam e nos esquivamos daqueles que nos perturbam. Sem dúvida, Deus nos acompanha até onde pode nessa forma deficiente e unilateral de tratar as Sagradas Escrituras, mas Ele não pode agradar-se dessa nossa maneira de agir. Nosso Pai Celestial se agrada de ver-nos desenvolver e crescer espiritualmente. Ele não deseja que vivamos com uma dieta unicamente de coisas doces.
Ele nos dá Isaías 41 para nosso encorajamento, mas também nos dá Mateus 23 e o livro de Judas, e espera que leiamos tudo. O capítulo 8 de Romanos é uma das passagens mais encorajadoras de toda a Bíblia, e sua aceitação por parte de todos é bem merecida; mas nós precisamos também da Segunda Epístola de Pedro, e não deveríamos deixar de lê-la. Quando lemos as epístolas de Paulo, não devemos parar nas seções doutrinárias, mas precisamos avançar, lendo as saudáveis exortações que vêm depois e meditando nelas. Não devemos parar em Romanos 11; o resto da epístola também é importante e, se queremos tratar nossa alma corretamente, temos de dar-lhe a mesma atenção que demos aos primeiros dez capítulos.
Em suma, a saúde de nossa alma requer que consideremos a Bíblia toda como ela é e permitamos que ela faça sua obra em nós. Não podemos ser seletivos com algo tão importante como a Palavra de Deus e nosso próprio futuro eterno.
(Revisado por Francisco Nunes. Este artigo pode ser distribuído e usado livremente, desde que não haja alteração no texto, sejam mantidas as informações de autoria, tradução, revisão e fonte e seja exclusivamente para uso gratuito. Preferencialmente, não o copie em seu sítio ou blog, mas coloque lá um link que aponte para o artigo.)