
Разработчики Microsoft немного переработали код классического файлового менеджера для Windows, адаптировали его для Windows 10 и опубликовали на GitHub под свободной лицензией MIT.

dvstcloud office
dvstlinux security
dvstd-link
dvstandroid antivirus
dvstwifi hotspot
dvstgnuplot

1 2 3 4 5 6 7 8 9 10 11 12 13 14 15 16 17 18 19 20 21 22 23 24 |
#! /usr/bin/gnuplot -persist
 set terminal postscript "NimbusSanL-Regu" eps color enhanced fontfile "/usr/share/texmf-texlive/fonts/type1/urw/helvetic/uhvr8a.pfb"
 set output "./plots/threshold_sparsity.ps"
  set key bottom right
 set xtics 10
 set mxtics 10
 set ytics 10
 set mytics 10

 set yrange [60:100]
  set y2range [60:100]
 set xrange [10**-5:1]
 set style line 1 lt 1 pt 6 ps 1.2
 set style line 2 lt 1 pt 9 ps 1.4
 set logscale x
 set format x "10^{%L}"
 set grid xtics ytics mxtics

 set y2tics 5
  set xlabel  "Threshold value for the matrix" font "NimbusSanL-Regu,18"
 set ylabel  "Matrix sparsity, \% percentage" font "NimbusSanL-Regu,18"
 set y2label "Output disturbance attenuation, \% percentage" font "NimbusSanL-Regu,18"
 plot ".data" using 6:8 title "Percentage of sparsity of the Hessian matrix" with points linestyle 1  lc rgb "blue" axis x1y1 ,
".data" using 6:((1- $4/$2)*100) title "Output disturbance attenuation performance, \% of rejection" with points linestyle 2 lc rgb "dark-red" axis x1y2 |
 set y2range [60:100]
 set y2tics 5
set y2label "Output disturbance attenuation, \% percentage" font "NimbusSanL-Regu,18" |

1 2 3 4 5 6 7 8 9 10 11 12 13 14 15 16 17 18 19 20 21 22 23 24 25 26 27 28 29 30 31 32 33 34 35 36 37 38 39 40 41 42 43 44 45 46 47 48 49 50 51 52 53 54 55 |
#! /usr/bin/gnuplot -persist
 set terminal postscript "NimbusSanL-Regu" eps color enhanced fontfile "/usr/share/texmf-texlive/fonts/type1/urw/helvetic/uhvr8a.pfb"
 set output "./plots/plotOutputDisturbancePlant.ps"
 set lmargin 10
 set rmargin 2
 set grid
 set bmargin 4

 set style line 1 lt 1 pt 5 ps 0.3
 set style line 2 lt 2 pt 7 ps 0.5
 set style line 3 lt 3 pt 9 ps 0.3
 set style line 4 lt 4 pt 11 ps 0.3
 set style line 5 lt 5 pt 13 ps 0.3

 set xrange [300:600]

 set multiplot
 set nokey
   set size 1,0.35
  set xlabel "Sampling instant"
 set ylabel "Control input"
 set origin 0.0,0.0
 set bmargin 3
 set tmargin 0
 plot "./data.data" index 23 using 3 title " " with linespoints  linestyle 1  lc rgb "red",
      "./data.data" index 22 using 3 title " " with linespoints linestyle 2 lc rgb "dark-red",
      "./data.data" index 18 using 3 title " " with linespoints linestyle 3 lc rgb "dark-green",
      "./data.data" index 14 using 3 title " " with linespoints linestyle 4 lc rgb "blue",
      "./data.data" index 12 using 3 title " " with linespoints linestyle 5 lc rgb "green"
 set ylabel "Output disturbance"

 set size 1,0.3
 set origin 0.0,0.39
  set xlabel " "
  set bmargin 0
 set tmargin 1
  set nokey
   plot "./data.data" index 23 using 2 title " " with linespoints linestyle 1 lc rgb "red",
      "./data.data" index 22 using 2 title " " with linespoints linestyle 2 lc rgb "dark-red",
      "./data.data" index 18 using 2 title " " with linespoints linestyle 3 lc rgb "dark-green",
      "./data.data" index 14 using 2 title " " with linespoints linestyle 4 lc rgb "blue",
      "./data.data" index 12 using 2 title " " with linespoints linestyle 5 lc rgb "green"

 set size 1,0.3
 set origin 0.0,0.7
  set bmargin 0.1
 set xlabel " "
  set tmargin 1
  set ylabel "Residual disturbance"
 plot "./data.data" index 23 using 1 title " " with linespoints linestyle 1 lc rgb "red",
      "./data.data" index 22 using 1 title " " with linespoints linestyle 2 lc rgb "dark-red",
      "./data.data" index 18 using 1 title " " with linespoints linestyle 3 lc rgb "dark-green",
      "./data.data" index 14 using 1 title " " with linespoints linestyle 4 lc rgb "blue",
      "./data.data" index 12 using 1 title " " with linespoints linestyle 5 lc rgb "green"
 set nomultiplot
|
на строках 17-22. После этих танцев с бубном строим график:set size 1,0.35 set origin 0.0,0.0 set bmargin 3 set tmargin 0
plot "./data.data" index 23 using 3 title " " with linespoints linestyle 1 lc rgb "red"
Вообще полезно продумать структуру данных для строительства графиков заранее. Например, размещать данные для разных случаев блоками (ряды данных, отбитых двумя пустыми строками), чтобы использовать возможности gnuplot и особенно инструкции index.График, расположенный в середине (строки 32-43 ), строится точно так же, только:
Ну и наконец верхний график в примере это строки 44-54, после чего выключаем multiplot и скармливаем всё gnuplot для графопостроительства. Всё легко и просто :-)set size 1,0.3 set origin 0.0,0.39

1 2 3 4 5 6 7 8 9 10 11 12 13 14 15 16 17 18 19 20 21 22 23 24 25 26 27 28 29 30 31 32 33 34 35 36 37 38 39 40 41 42 43 44 45 46 47 48 49 50 51 |
reset set term png font "Times,15" set output "broken_axes1.png" f(x)=exp(-x)*sin(500*x) #plotting function set yrange [-1:1] #The later two plot have same yrange set sample 400 set tics nomirror set tmargin at screen 0.9 #the later two plots will share this tmargin set bmargin at screen 0.1 #------------------------------------b------ set multiplot #begin multiplot mode #axes broken line set arrow 1 from screen 0.5,0.08 to screen 0.52,0.12 nohead set arrow 2 from screen 0.52,0.08 to screen 0.54,0.12 nohead set arrow 3 from screen 0.5,0.88 to screen 0.52,0.92 nohead set arrow 4 from screen 0.52,0.88 to screen 0.54,0.92 nohead #x,y axis label and title label set label 1 "Time: t(s)" at screen 0.475,0.025 set label 2 "Signal:U(mV)" at screen 0.025,0.44 rotate by 90 set label 3 center "U=exp(-t)sin(500t)" at screen 0.5,0.95 #The left part set border 1+2+4 #the right border is not plotted set lmargin at screen 0.1 #the left-part's location set rmargin at screen 0.51 set xtics 0,0.02,0.08 plot [0:0.1] f(x) w l lt 1 lw 2 notitle #unset the labels and arrows, otherwise they will be plot #for the second time unset label 1 unset label 2 unset label 3 unset arrow 1 unset arrow 2 unset arrow 3 unset arrow 4 #the right part set border 1+4+8 #the left border is not plotted set lmargin at screen 0.53 #the right-part's location set rmargin at screen 0.94 #ytics is not plotted, as the second plot will share it with the first one unset ytics set xtics 0.9,0.02,1.0 plot [0.9:1] f(x) w l lt 1 lw 2 unset multiplot |
#axes broken line set arrow 1 from screen 0.5,0.08 to screen 0.52,0.12 nohead set arrow 2 from screen 0.52,0.08 to screen 0.54,0.12 nohead set arrow 3 from screen 0.5,0.88 to screen 0.52,0.92 nohead set arrow 4 from screen 0.52,0.88 to screen 0.54,0.92 nohead |
Сложность здесь в том, чтобы угадать с полями ( set lmargin и set rmargin ). У японской девушки всё легко и просто, но если нужно построить что-то посложнее, угадывание может отнять время.
и строим левую часть:#unset the labels and arrows, otherwise they will be plot #for the second time unset label 1 unset label 2 unset label 3 unset arrow 1 unset arrow 2 unset arrow 3 unset arrow 4
Всё, выключаем мультиплот unset multiplot и вставляем эффектный график в статью.#the right part set border 1+4+8 #the left border is not plotted set lmargin at screen 0.53 #the right-part's location set rmargin at screen 0.94 #ytics is not plotted, as the second plot will share it with the first one unset ytics set xtics 0.9,0.02,1.0 plot [0.9:1] f(x) w l lt 1 lw 2

1 2 3 4 5 6 7 8 9 10 11 12 13 14 15 16 17 18 19 20 21 22 23 24 25 26 27 28 29 30 31 32 33 34 35 36 37 38 39 40 41 42 43 44 45 46 47 48 49 50 51 52 53 54 55 56 57 58 59 60 61 62 63 64 65 66 |
#! /usr/bin/gnuplot -persist set terminal postscript "NimbusSanL-Regu" eps color enhanced fontfile "/usr/share/texmf-texlive/fonts/type1/urw/helvetic/uhvr8a.pfb" set output "./decoupled.ps" set lmargin 10 set rmargin 2 set grid set bmargin 4 set multiplot set xrange [0.16:0.22] set yrange [0:2000] set xtics 0.005 set grid set key top left set size 1,0.35 set xlabel "Mean computation time, milliseconds" set origin 0.0,0.0 set bmargin 3 set tmargin 0 plot ".data" using ($2*10**3):1 title "No coupling, DM with 4 actuators" with boxes fs pattern 2 lc rgb "blue" set ylabel "Frequency of occurrences (out of 4000 data points)" set size 1,0.3 set origin 0.0,0.39 set bmargin 0 set tmargin 1 set xtics 0.1 set xrange [0.2:1.7] set yrange [0:130] set xlabel "" set grid set key top left plot ".data" using ($2*10**3):1 title "No coupling, DM with 49 actuators" with boxes fs pattern 1 lc rgb "dark-red" set xtics 0.5 set size 1,0.3 set origin 0.0,0.7 set bmargin 0.1 set tmargin 1 set xrange [0:8] set xlabel "" set ylabel "" set arrow 3 from screen 0.52,0.98 to screen 0.50,0.94 nohead set arrow 4 from screen 0.57,0.98 to screen 0.55,0.94 nohead set arrow 1 from screen 0.52,0.72 to screen 0.50,0.68 nohead set arrow 2 from screen 0.57,0.72 to screen 0.55,0.68 nohead set border 1+2+4 set lmargin at screen 0.1 set rmargin at screen 0.51 set xtics 0.1 set yrange [0:80] plot [0.3:1.5] ".data" using ($2*10**3):1 title "No coupling, DM with 100 actuators" with boxes fs pattern 5 lc rgb "dark-green" unset arrow 1 unset arrow 2 unset arrow 3 unset arrow 4 set border 1+4+8 set lmargin at screen 0.56 set rmargin at screen 0.975 set nokey set xtics 0.05 set yrange [0:1000] plot [7:7.5] ".data" using ($2*10**3):1 title " " with boxes fs pattern 5 lc rgb "dark-green" set nomultiplot |
plot [7:7.5] ".data" using ($2*10**3):1
dvstPHP obfuscation
dvstzimbra
dvstMS updates
dvstjava update
dvstd-link
dvstmobile malware
dvstskillz
dvstLUKS
dvstCVS git
dvstTLS/SSL attack
dvstmiktotik
dvstlinux kernel 3.11
dvstsmartphone, CAT
dvstopennebula, cloud, virtualization
dvstNAS
dvstGTD, time management


На самом деле, создание GTD-системы "под себя" - не такая сложная задача, как кажется. Можно использовать LaTeX, как это сделал я, или Markdown, если web-просмотр вам ближе - важно, чтобы язык или программа позволяла легко создавать и менять списки. Список - ядро GTD, поскольку многое в GTD это просто список:Использование готовых программ, хотя и полезно на первых порах, в дальнейшем может привести к трудностям - рано или поздно вы захотите подстроить GTD под себя, и это в сторонней программе может быть нетривиально.
- список проектов
- список активных шагов
- календарь это по сути список событий
- список зон ответственности (areas of focus)


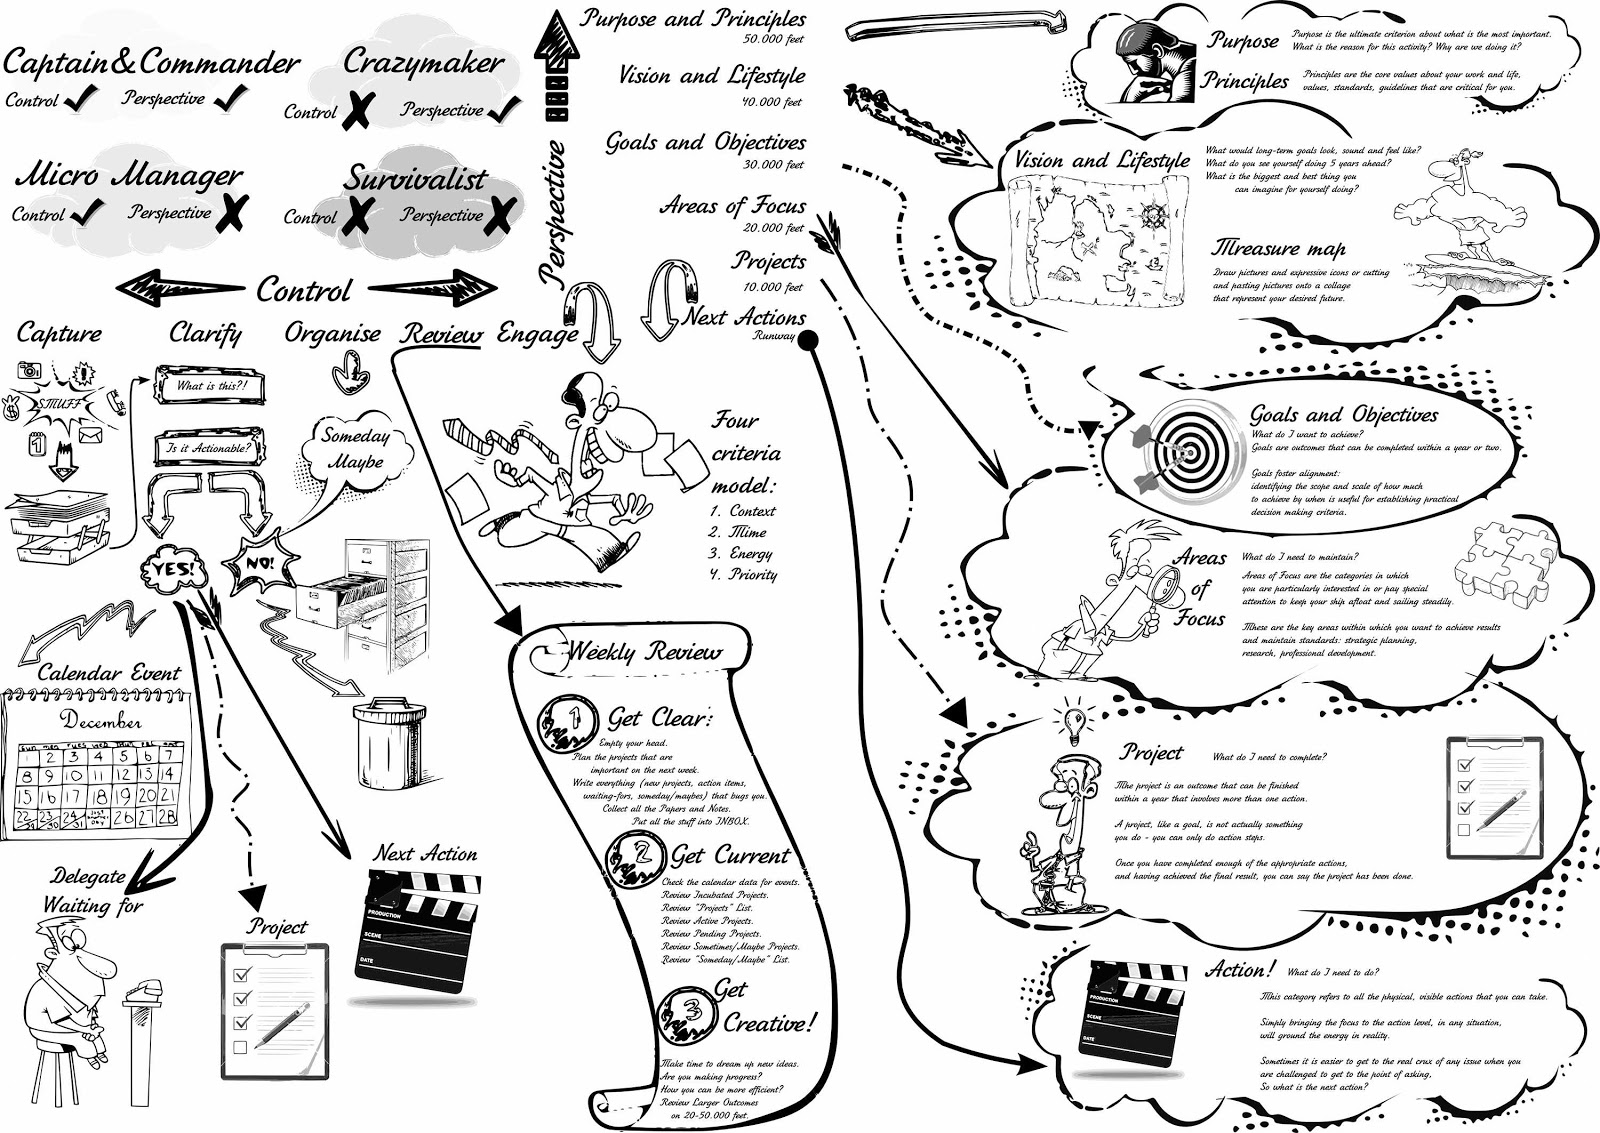 | |
| Вся схема Getting Things Done. Кликабельна, 700кб JPEG |
dvstsmartphones