NMR spectroscopy is an indispensable tool for assigning the structure of organic compounds. One very useful method in the NMR toolbox is the
Heteronuclear
Multiple
Bond
Correlation (HMBC) experiment. HMBC data are
1H detected and provide a 2D correlation map between
1H and
13C similar to HMQC or HSQC except that the correlations are between protons and carbons separated by two, three and sometimes even four bonds. This long range information is very helpful in elucidating chemical structures, especially those with non-protonated carbons. The problem, however with HMBC data is that the correlations depend only on the magnitude of the long-range
1H-
13C coupling constants. Two- or three- bond coupling constants are very similar in magnitude to one another and therefore it is not possible to distinguish between two- and three- bond correlations. Also, since many long range
1H-
13C coupling constants (including two-bond coupling constants) are near zero,
some correlations may be absent. These problems may make structure elucidation frustrating or impossible. The
Heteronuclear
2 Bond
Correlation (H2BC) experiment
1 provides an HMBC-like correlation map with (almost) exclusively two-bond
1H-
13C correlations. Unlike the correlations in the HMBC measurement, which rely exclusively on long range
1H-
13C coupling constants, the
1H-
13C correlations in the H2BC experiment rely on three-bond
3J
H-H coupling between the protons on adjacent carbons. It is a combined HMQC-COSY experiment. The size of the H2BC correlations depends on the magnitude of the
3J
H-H coupling constant. Three-bond
1H-
13C correlations are possible only if four-bond
4J
H-H coupling is significant. One disadvantage to the H2BC experiment is that all correlations between protons and non-protonated carbons are necessarily absent because of the absence of H-H coupling. In general, two-bond
1H-
13C correlations that are weak or absent in HMBC spectra are strong in H2BC spectra and three-bond
1H-
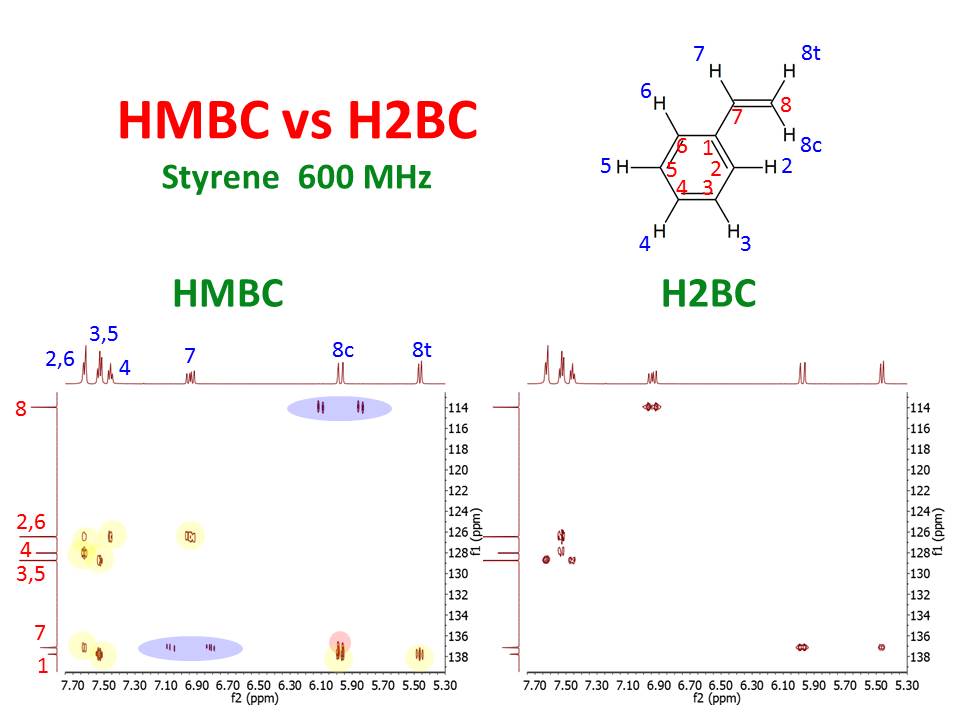
13C correlations which are strong in HMBC spectra are absent or very weak in H2BC spectra. The techniques are very complimentary. The figure below illustrates the complimentary nature of the two methods for styrene.
The HMBC spectrum in the left panel was scaled up until some of the
HMQC artifacts (color coded in blue) were visible. The data show only one 2-bond
1H-
13C correlation (color coded in pink). The three-bond
1H-
13C correlations are color coded in yellow. In comparison, the H2BC spectrum in the right panel shows exclusively two-bond
1H-
13C correlations with the exception of those involving the C1 non-protonated carbon.
1. Nyberg, Duus, Sorensen.
J. Am. Chem. Soc. 127, 6154 (2005).


![Angewandte Chemie International Edition [Fe(H2O)5(NO)]2+, the “Brown‐Ring” Chromophore](https://onlinelibrary.wiley.com/cms/attachment/65881bd3-522d-4ac9-8d01-dd01117dcda3/anie201902374-toc-0001-m.png)