Have you caught Pokémons? Pokémon GO is a popular game played by millions, but it scales extremely well. This blog is a behind-the-scenes look into how the Pokémon GO engineering team manages and maintains the scale. Joining me is James Prompanya, Senior Engineering Manager at Niantic Labs who leads the server infrastructure team for Pokémon GO. Let’s see what he had to say when I asked him about the architecture that powers this extremely popular game. Checkout the video!
Priyanka:What is Pokémon GO?
James: It’s not your typical mobile game. It’s a game that involves walking around to catch these little Pokémon creatures that are appearing all around you in the real world. It encourages you to go outside, explore, and discover things using augmented reality.
A big part of that is the community aspect of it. When the game first came out, we hadn’t built community features into the game yet, but players still met with others in real life, played together, and pointed out when rare, powerful Pokémon would appear. Everyone sees the same Pokémon, and shares the same virtual world, so when someone points out a Pokémon, you’d just see crowds of people running out after it. Nowadays, we make this a major part of the game by hosting regular live events such as community days, raid hours, all culminating in GO Fest, our annual celebration during the summer and our biggest event of the year.
During these events, transactions go from 400K per second to close to a million in a matter of minutes as soon as regions come online.
Priyanka:How does the Pokémon GO backend scale to handle peaks in traffic during events such as Pokémon GO Fest?
James:There are lots of services we scale, but Google Kubernetes Engine and Cloud Spannerare the main ones. Our front end service is hosted on GKE and it's pretty easy to scale the nodes there — Google Cloud provides us with all the tools we need to manage our Kubernetes cluster. The Google Cloud console is easy to use, with detailed monitoring graphs, tools, and logging available to use with just a few clicks. The support we get from Google engineers is top notch, and they’re always able to assist at any given moment, or in preparation for our large events such as Pokémon GO Fest. We had Google engineers (virtually) sitting side by side with us ready to tackle any issues from running such a large scale event - it was like having an extra support team working directly with us.
At any given time, we have about 5000 Spanner nodes handling traffic. We also have thousands of Kubernetes nodes running specifically for Pokémon GO, plus the GKE nodes running the various microservices that help augment the game experience. All of them work together to support millions of players playing all across the world at a given moment. And unlike other massively multiplayer online games, all of our players share a single “realm”, so they can always interact with one another and share the same game state.
Priyanka:Were you always using Spanner? Or did you decide to make that architectural decision as the game got popular?
James:We started off using Google Datastore. It was an easy way to get started without having to worry about managing another piece of infrastructure. As the game matured, we decided we needed more control over the size and scale of the database. We also like the consistent indexing that Cloud Spanner provides, which allows us to use more complex database schemas with primary and secondary keys.
Finally, Datastore is non-relational with Atomic & Durable transactions, but we needed a relational database with full consistency. Spanner provides all of this, plus global ACID transactions.
Priyanka:Let's say I am a player, playing the game right now. I opened the app to catch Pokémon. What is happening behind the scenes - how does the request flow work?
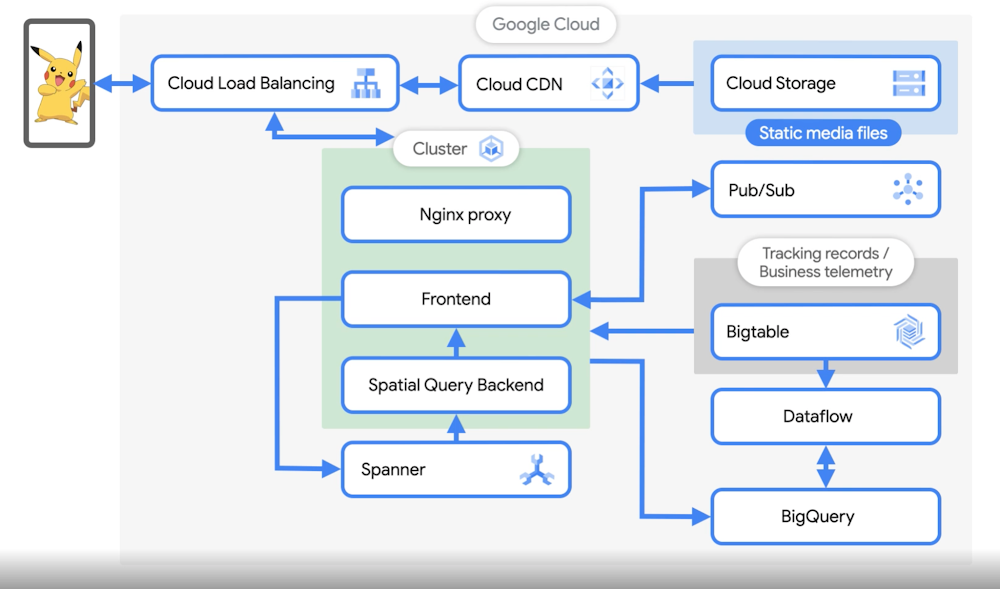
James: When a user catches a Pokémon, we receive that request via Cloud Load Balancing. All static media, which is stored in Cloud Storage, is downloaded to the phone on the first start of the app. We also have Cloud CDN enabled at Cloud Load Balancing level to cache and serve this content. First, the traffic from the user's phone reaches Global Load Balancer which then sends the request to our NGINX reverse proxy. The reverse proxy then sends this traffic to our front-end game service.
The third pod in the cluster is the Spatial Query Backend. This service keeps a cache that is sharded by location. This cache and service then decides which Pokémon is shown on the map, what gyms and PokéStops are around you, the time zone you’re in, and basically any other feature that is location based. The way I like to think about it is the frontend manages the player and their interaction with the game, while the spatial query backend handles the map. The front end retrieves information from spatial query backend jobs to send back to the user.
Priyanka:What happens when I hunt a Pokémon down and catch it?
James: When you catch the Pokémon, we send an event from the GKE frontend to Spanner via the API and when that write request from the frontend to spanner is complete. When you do something to update the map like gyms and PokéStops, that request sends a cache update and is forwarded to the spatial query backend.
Spanner is eventually consistent: once the update is received, the spatial data is updated in memory, and then used to serve future requests from the frontend. Then the frontend retrieves information from the spatial query backend and sends it back to the user. We also write the protobuf representation of each user action into Bigtable for logging and tracking data with strict retention policies. We also publish the message from the frontend to a Pub/Sub topic that is used for the analysis pipeline.
Priyanka:How do you ensure that two people in the same geographic region see the same Pokémon data, and keep that relatively in sync? (Especially for events!)
James: It’s actually pretty interesting! Everything on our servers is deterministic. Therefore, even if multiple players are on different machines, but in the same physical location, all the inputs would be the same and the same Pokémon would be returned to both users. There’s a lot of caching and timing involved however, particularly for events. It’s very important that all the servers are in sync with settings changes and event timings in order for all of our players to feel like they are part of a shared world.
Priyanka:A massive amount of data must be generated during the game. How does the data analytics pipeline work and what are you analyzing?
James:You are correct, 5-10TB of data per day gets generated and we store all of it in BigQuery and BigTable. These game events are of interest to our data science team to analyze player behavior, verify features like making sure the distribution of pokemon matches what we expect for a given event, marketing reports, etc.
We use BigQuery - it scales and is fully managed, we can focus on analysis and build complex queries without worrying too much about the structure of the data or schema of the table. Any field we want to query against is indexed in a way that allows us to build all sorts of dashboards, reports, and graphs that we share across the team. We use Dataflow as our data processing engine, so we run a Dataflow batch job to process the player logs stored in Bigtable.
We also have some streaming jobs for cheat detection, looking for and responding to improper player signals. Also for setting up Pokétops and gyms and habitat information all over the world we take in information from various sources, like OpenStreetMap, the US Geological Survey, and WayFarer, where we crowdsource our POI data, and combine them together to build a living map of the world.
Priyanka:As the events grow and the traffic grows to millions of users per second, how does this system scale?
James: Yes, With the increase in transactions, there is an increase in the load throughout the system like data pipeline (pub sub, BigQuery Streaming and more). The only thing that the Niantic SRE team needs to ensure is that they have the right quota for these events, and since these are managed services, there is much less operational overhead for the Niantic team.
Priyanka:With that much traffic, the health of the system is critical. How do you monitor the health of their system during these massive events?
James: We use Google Cloud Monitoring which comes built in, to search through logs, build dashboards, and fire an alert if something goes critical. The logs and dashboards are very extensive and we are able to monitor various aspects and health of the game in real time.
We just took a behind the scenes tour into Pokémon GO’s architecture. How they use GKE and Spanner for scaling to those peaks and how their data science team works with BigQuery, BigTable, Dataflow & Pub/Sub for data analytics!
What did you think about this story? Tell me more about it on Twitter @pvergadia.
A few nuggets. Re: false claims about AMP performance (p. 90):
After crippling AMP’s compatibility with header bidding, Google
went to market falsely telling publishers that adopting AMP would
enhance page load times. But Google employees knew that AMP only
improves the “median of performance” and AMP pages can actually
load slower than other publisher speed optimization techniques. In
other words, the ostensible benefits of faster load times for a
Google-cached AMP version of a webpage were not true for
publishers that designed their web pages for speed. Some
publishers did not adopt AMP because they knew their pages
actually loaded faster than AMP pages.
The speed benefits Google marketed were also at least partly a
result of Google’s throttling. Google throttles the load time of
non-AMP ads by giving them artificial one-second delays in order
to give Google AMP a “nice comparative boost.” Throttling non-AMP
ads slows down header bidding, which Google then uses to denigrate
header bidding for being too slow. “Header Bidding can often
increase latency of web pages and create security flaws when
executed incorrectly,” Google falsely claimed. Internally, Google
employees grappled with “how to [publicly] justify [Google] making
something slower.”
You can’t justify it.
On using Chrome, the browser, as a workaround for tracking users across the entire web, by conflating logging into Chrome with logging into Google’s own web properties (p. 95):
To get publishers to give Google exclusive access over their ad
inventory, Google set publishers up for a lose/lose scenario.
First, Google started to leverage its ownership of the largest web
browser, Chrome, to track and target publishers’ audiences in
order to sell Google’s advertising inventory. To make this happen,
Google first introduced the ability for users to log into the
Chrome browser. Then, Google began to steer users into doing this
by using deceptive and coercive tactics. For example, Google
started to automatically log users into Chrome if they logged into
any Google service (e.g., Gmail or YouTube). In this way, Google
took the users that choose not to log into Chrome and logged them
in anyways. If a user tried to log out of Chrome in response,
Google punished them by kicking them out of a Google product they
were in the process of using (e.g., Gmail or YouTube). On top
this, through another deceptive pattern, Google got these users to
give the Chrome browser permission to track them across the open
web and on independent publisher sites like The Dallas Morning
News. These users also had to give Google permission to use this
new Chrome tracking data to sell Google’s own ad space, permitting
Google to use Chrome to circumvent reliance on cookie-tracking
technology. The effect of this practice is to rob publishers of
the exclusive use of their audience data (e.g., data on what users
read on The Dallas Morning News), thereby depreciating the value
of publishers’ ad space and benefitting ad sales on Google’s
properties (e.g., YouTube).
My post earlier today about Photoshop for the web going into public beta exemplifies the aspects of Google’s expansive vision for Chrome’s technical capabilities that make many web developers love Chrome and dislike Safari.
The details in this antitrust filing exemplify everything that is wrong — deeply contrary to the intended open nature of the web — about Google controlling the most popular web browser in the world.
Yuhao Du, Jessica Nordell, and Kenneth Joseph used simulations to study the effects of small gender biases at entry level up to executive level. It doesn’t take much to skew the distribution. For NYT Opinion, Yaryna Serkez shows the simulation in action with moving bubbles and stacked area charts for each work level.
The simulation imagines a company where female performance is undervalued by 3 percent. Each dot represents an employee, and they either move up with promotions or stay still. The distribution of men and women start even but end very uneven.
San Jose officially apologizes to Chinese immigrants and their descendants.
Did you know that San Jose, California was once home to five Chinatowns? And then it was home to zero Chinatowns. Because racists burned them down and/or displaced and drove out the city's Chinese residents.
If you know anything about Asian American history -- and honestly, it wouldn't be a surprise if your textbooks conveniently left it out -- this kind of racist violence was a fair.ly common occurrence up and down the west coast during the mid-to-late 1800s. Anti-Chinese sentiment became institutionalized
This week, the city of San Jose unanimously approved a resolution officially apologizing to Chinese immigrants and their descendants, acknowledging its role in nearly a century of violence and discrimination, including the dismantling and destruction of the city's Chinatowns. Yeah, file this one under Too Little Too Late.
Here’s a timely reader question about Series I Bonds. It’s a good question because I predict that Series I Bonds will be soon getting even more media attention soon due to an even higher inflation-linked rate.
Would it be best to wait till November 1st to purchase I bonds? You mentioned the fixed rate will probably confine at 0. but what about the semiannual inflation rate? Do u think it is likely to be more than 3.54%? I’m new to this please educate me.
Series I Bond rates react every 6 months to delayed inflation reports from the Bureau of Labor Statistics. August CPI-U was already reported in mid-September, and September CPI-U will be reported in mid-October. 5 out of 6 months of data are already in the books, leaving only one month of data left. The 12-month trailing inflation rate as of that August CPI-U update was over 5%. Therefore, unless that data contains a significant amount of deflation, we already know that the next inflation rate on Series I Bonds is going to be higher than the 3.54% from May to October 2021. I roughly estimate the range that the next inflation rate will be between as 5% to 7%. That should be enough accuracy to make a purchase timing decision, earlier than my usual practice of waiting until mid-October.
If you buy in September or October 2021, you will receive a total rate of 3.54% for the first six months, then the “new” (estimated 5%-7%) rate for the next 6 months, and then new rates adjusted every six months for inflation onward.
If you buy in November 2021, you will receive the “new” (estimated 5%-7%) rate for the first 6 months, and then new rates adjusted every six months for inflation onward.
The takeaway is that either way, you will earn the “new” rate (estimated 5%-7%) eventually. If you buy in September/October, you’ll just have to wait a bit due to the staggered structure. Given that the current rate of 3.54% is still a higher interest rate than nearly any other savings account or CD is paying, I would personally just invest now if I had the cash ready and waiting. Also remember that Series I Bonds do not allow early withdrawals within the first 12 months after purchase date. As long as you complete your purchase by the end of September, it will count as purchased in September 2021 and you will be able to withdraw as of September 1st, 2022 (though subject to a penalty if held less than 5 years). It may take a little bit to set up your TreasuryDirect account, and it may take a couple business days for the withdrawal and purchase to process, so I wouldn’t wait until the last day.
Annual purchase limits. The annual purchase limit is now $10,000 in online I-bonds per Social Security Number. For a couple, that’s $20,000 per year. You can only buy online at TreasuryDirect.gov, after making sure you’re okay with their security protocols and user-friendliness. You can also buy an additional $5,000 in paper I bonds using your tax refund with IRS Form 8888. If you have children, you may be able to buy additional savings bonds by using a minor’s Social Security Number.
As noted in my previous savings bond posts, these Series I bonds are a unique investment opportunity in that they are only available to individuals and are subject to purchase limits. Even if the real yield (fixed rate) is set at zero, that is still significantly higher than that of TIPS that trade on the open market (well negative across the board!). If institutional investors like pension funds or endowments could buy I bonds like you and me, they would buying billions of them.
I plan to purchase up to my annual purchase limit for 2021 as part of my asset allocation to inflation-linked bonds, although you can start with as little as $25. I guarantee that there will be many more articles about Series I bonds in mainstream personal finance sites in November after the new rate is officially announced.
“The editorial content here is not provided by any of the companies mentioned, and has not been reviewed, approved or otherwise endorsed by any of these entities. Opinions expressed here are the author's alone. This email may contain links through which we are compensated when you click on or are approved for offers.”
If you visit Japan’s Niigata Prefecture during the region’s annual rice harvest, you’re likely to find enormous tarantulas, eagles, and dinosaur-like creatures stalking the bucolic landscape. The towering sculptures are part of the Wara Art Festival, a summertime event that displays massive animals and mythical creations fashioned from the crop’s leftover straw.
Traditionally, the byproduct is used as livestock feed, for compost that revitalizes the soil, and to craft household goods like zori sandals, although farmers increasingly have found themselves with a surplus as agricultural technology and culture changes. This shift prompted a partnership between the people of the former Iwamuro Village, which is now Nishikan Ward, and Tokyo’s Musashino Art University (known colloquially as Musabi) in 2006. At the time, Department of Science of Design professor Shingo Miyajima suggested that the unused straw be used in a collaborative art project between the university and local farmers, resulting in the first Wara Art Festival in 2008.
Today, students design the oversized characters—you can see previous year’s creations in this gallery—and artisans from Nishikan Ward construct the wooden armature and thatched bodies. The monumental figures stand as high as 30 feet, looming over the green landscape in a playful celebration of local culture.
Although the festival paused in 2020 because of the ongoing COVID-19 pandemic, it’s back for its 13th edition at Uwasekigata Park. This year’s motley cast includes insects, animals, and even legendary monsters like the Amabie, all on view through October 31. (via Hyperallergic)
Europe has plenty of people who distrust the shots and their governments, but vaccine resistance in the United States is more widespread and vehement, particularly among conservatives, and falls more sharply along partisan lines. The E.U. vaccination effort has slowed recently, but not like the U.S. drive, which has declined more than 80 percent.
Also of interest: NYT managed to squeeze in a bar chart race, a Marimekko chart, and a beeswarm chart all in the same article. That’s gotta be a record for them.
We had to do a lot more from home in 2020. Based on the American Time Use Survey, we spent about 62% of our waking time at home. In contrast, we only spent about 50% in 2019. Here is the breakdown by activity on a weekday.
For each year, I counted the total minutes for each activity and divided by total waking time to estimate percentages. For privacy reasons, the where is not provided for when respondents were sleeping, grooming, or doing personal activities. I suspect the total percentage of time spent at home for both years would increase if these times were included.
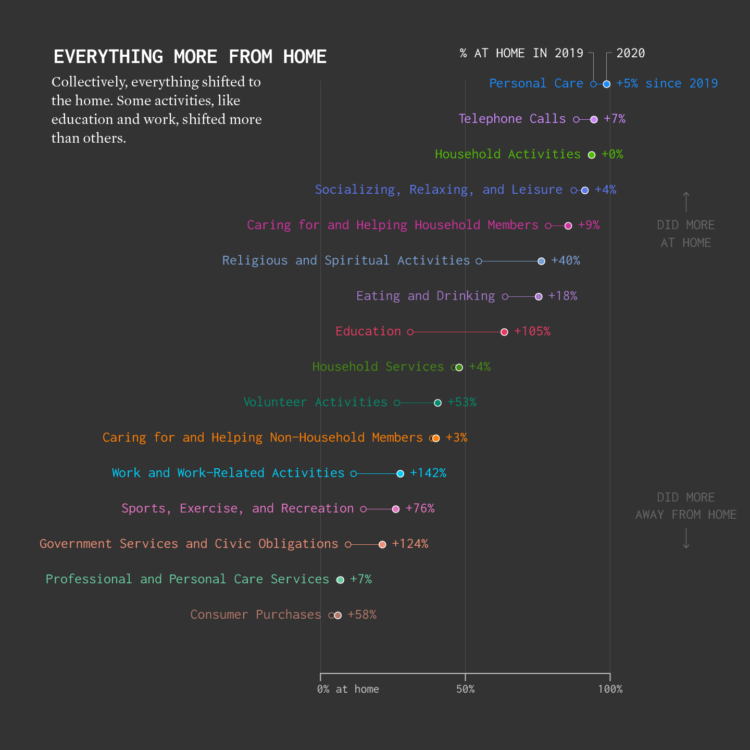
For a better sense of how everything shifted, here’s a different view that shows the percentage of time spent at home, by activity, on a weekday.
With the exception of household activities, which already happened mostly at home, there was an increase in every category. Work from home went up 142%. Education at home more than doubled. Good times.
In the context of the attacks and bullying of Asian Americans that has gone on during the pandemic, Sesame Street has recently released this video of a song they created. Proud of Your Eyes talks about one of the most common things that bullies and haters use to pick on Asian Americans. Analyn talks to Alan (long time owner of Hooper’s Store, played by Alan Muraoka) and Wes about an incident that happened to her.
The non-profit behind Sesame Street, the Sesame Street Workshop, has a specific focus on racial justice. They have prepared other videos designed to be watched by the whole family. “Meet the Lee Family” talks about a Asian American family whose parents are the children of immigrants and whose entire family has been born in the US. I liked that focus, working to debunk the perpetual foreigner notion.
Before we leave the subject of eyes, I would suggest watching the short film Beautiful Sisters by one of our former 8Asians writers. The racist camera is another take on Asian eyes.
The following is an excerpt from the Designer Notes for Old World. The game, a historical 4X set in classical antiquity, released on July 1, 2021, and is available for purchase here.
I’m not sure where the idea that every game piece should be able to move exactly once per turn first originated. I suspect it came from hex-based tabletop wargames before video games even existed, but it became the default state for many games, largely unquestioned. Empire and then Civilization itself both followed this pattern, which then extended to all their 4X descendants. The problem with every-unit-moves (EUM) in 4X games is that it only creates the illusion of tactical and strategic decision making. (I am taking the prerogative to coin an acronym for this to draw attention to the fact that employing EUM is an intentional design choice, just like using one-unit-per-tile is a choice.) Each turn, the player is evaluating the most effective single move for each of their units, which is often a very straightforward and often even boring decision, without any tradeoffs, with no reason to NOT take an action. In Civilization, there is never a reason not to build another mine or not to take another shot with an archer. These decisions quickly become rote as the number of units in the game grows. Players ask to automate their Workers because they no longer want to make these boring decisions but are still aware that they are going to perform worse if they don’t at least do something with their Workers each turn. Much has been made about Civ being a game of guns-or-butter, but that choice only really happens during city production. With EUM, once the units are built, it’s guns-AND-butter.
The Orders system of Old World came from an unlikely place, the so-called “social games” of Facebook circa-2010, which seemed to be taking over gaming for one strange little moment. (Indeed, for a brief period of time, three former Civilization designers – Bruce Shelley, Brian Reynolds, and myself – were all working at Zynga, and Sid Meier himself was building a version of Civ for Facebook.) One specific design mechanic stuck out to me from this era, which I first noticed in Brian’s FrontierVille – the “energy” system that was built to give players a limited number of actions each time they logged in, with of course the option to buy more if they got impatient.
I wasn’t particularly interested in the microtransaction side of the mechanic – as I discovered at EA and Zynga, it takes a very different designer than myself to master the dark arts of mixing business and design required for free-to-play games – but I was interested in how energy systems could multiply the strategic possibilities for older genres with a only a small amount of additional complexity. (Of course, ideas like this always have multiple sources, and perhaps also in the back of my mind was my favorite wargame from my childhood, Eric Lee Smith’s The Civil War, which used an interesting alternating initiative system that did not follow the EUM default.)
I hoped that taking a standard 4X game and overlaying an Orders system on top of it would instantly make the game more interesting, so our first step with Old World was to make the game work in multiplayer to see if this was true. We discovered we were onto something special immediately; not only were we making actual guns-or-butter decisions every turn, but the strategic space was blown open so wide that it felt like a completely fresh experience. Every tactical situation now had hundreds of possible approaches based on which units the players wanted to spend their orders moving. Courageous flanking gambits were now possible as were tactical retreats to better terrain. Is it better to spend all your Orders to get your best units in the right location to maximize their damage, or is it better to spread the Orders out to hit the enemy from more positions? Or, is it better to have the discipline during a war to reserve some Orders to spend on Workers to make sure your economy doesn’t fall behind. We discovered in MP that the victorious teams were often not the ones spending the most Orders on military victories but those who didn’t neglect their economy (and especially those who connected their front line to their core via Roads to reduce Orders from moving troops).
The early prototypes tried a number of crazy ideas – there was a turnless mode where every unit had an individual cooldown timer after attacking, there was a version where Orders could be bought just like Food or Iron (and which can still be seen in the game via Coin Debasement), and there was a mode where stockpiling Orders between turns was an important mechanic. Each of these systems was hotly debated, and other base assumptions from 4X design were modified – for example, units now have an absurdly large visibility radius to ensure that they can actually see their own potential movement range (and also so that enemies moving from far away are less likely to look like magically transporting units).
However, the most contentious question by far was whether units should have unlimited movement – in other words, if the only limitation on whether a unit could continue moving was if there were still Orders left to use. With enough Orders, a single unit could theoretically cross the entire map in one turn. I don’t like to add extra rules to a game unless absolutely necessary as each rule in a game adds an extra burden on the player, and “every move costs one Order” without any other restrictions was a very simple rule to describe to players. Further, I was convinced that allowing any one unit a perhaps ridiculous movement range was not actually a problem for game balance; a player could move one unit perhaps thirty times in one turn but only by suffering the huge opportunity cost of not moving any other units.
The team, however, felt quite differently, sometimes vehemently. After months of debate, a mutinous internal mod suddenly appeared that put a hard cap of three moves per turn on each unit. I agreed to give it a fair shake, and although I tried to keep an open mind, I absolutely hated it; we had discovered gameplay magic with the Orders system but were afraid to let it loose. However, I had to admit that perhaps I was pushing the game outside of the comfort zone of most players. At the very least, giving units a soft movement cap would help guide players who would be confused why they could just keep moving their Scout over and over and over again; unlimited Orders certainly increased the risk that players would spend their Orders in the wrong place without considering all their other Units.
Thus, we adopted a fatigue system where most units got three moves each turn but could extend their range by spending 100 Training once on a “Force March” and then double Orders per move thereafter. My fear was that we were adding complexity that would be mandatory to understand to play the game, but I trusted the response the team had to completely unlimited Orders. As a bonus, fatigue gave me one more knob to turn for nations and traits and promotions. (Roman units, for example, could get +1 fatigue to represent their military discipline.) Nonetheless, the promise of the Orders system was still intact, and the variety of moves available to players each turn, especially if they unlock unlimited movement with a Force March, is almost impossible to calculate.
Superman Smashes the Klan is really, really good. So, I thought of posting the scene where Clark gets inspired to create a secret identity :)
I've read a bunch of "Superman origin" stories that show how Clark chose his costume, and I think this one is my favourite: I love the way it emphasises that posture, attitude and presentation DO change people's perception of your identity, to the point that paper-thin disguises actually do work (this is true btw, there is a famous anecdote of Marilyn Monroe pulling it off).
To measure drought in the present day, we use data from sensors that constantly record environmental conditions, such as soil moisture, precipitation, and snow water content. But to measure drought thousands of years ago, researchers can use tree rings. Alvin Chang for The Guardian shows how the researchers line up old rings to gather historical data and then do that across a region.
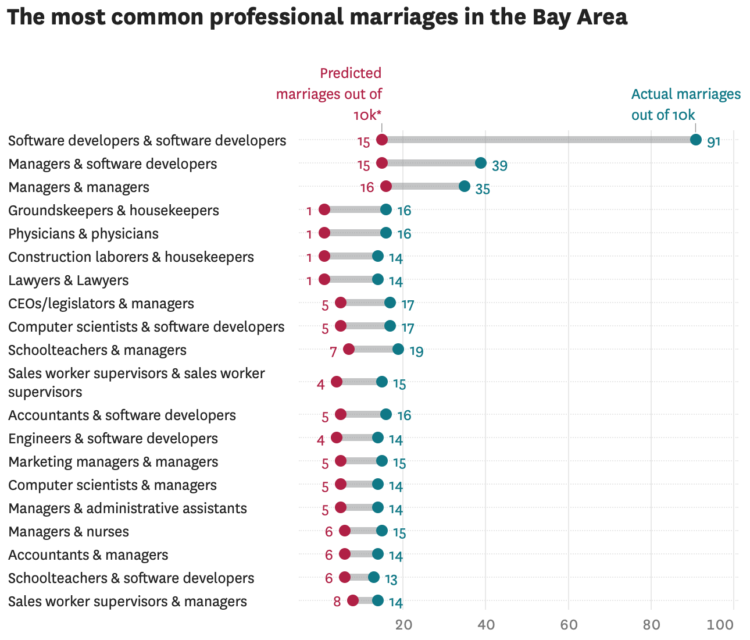
Perhaps unsurprisingly, the most common union between two professionals here is between a computer programmer and … another computer programmer. Our estimates show that an estimated 1% of all marriages in the region are between two software developers — specifically developers of applications and systems software. For the U.S. overall, software developer unions make up less than one-tenth of a percent of all marriages.
While my April 2021 portfolio asset allocation is designed for total return, I also track the income produced. Stock dividends are the portion of profits that businesses have decided they don’t need to reinvest into their business. The dividends may suffer some short-term drops, but over the long run they have grown faster than inflation. Here is the historical growth of the S&P 500 absolute dividend (source):
This is true despite the fact that the S&P 500 yield percentage are again near historical lows, along with interest rates (source):
I track the “TTM” or “12-Month Yield” from Morningstar, which is the sum of the trailing 12 months of interest and dividend payments divided by the last month’s ending share price (NAV) plus any capital gains distributed over the same period. I prefer this measure because it is based on historical distributions and not a forecast. Below is a rough approximation of my portfolio (2/3rd stocks and 1/3rd bonds).
Asset Class / Fund
% of Portfolio
Trailing 12-Month Yield (Taken 4/11/21)
Yield Contribution
US Total Stock
Vanguard Total Stock Market Fund (VTI, VTSAX)
Trailing 12-month yield history. Here is a chart showing how this 12-month trailing income rate has varied since I started tracking it in 2014.
Portfolio value reality check. One of the things I like about using this number is that when stock prices drop, this percentage metric usually goes up – which makes me feel better in a bear market. When stock prices go up, this percentage metric usually goes down, which keeps me from getting too euphoric during a bull market.
The true investor… will do better if he forgets about the stock market and pays attention to his dividend returns and to the operating results of his companies.
This quarter’s trailing income yield of 1.73% is the lowest ever since 2014. This is nearly a full 1% lower than what it was in late 2018. At the same time, my portfolio value is also bigger than ever. If you retired back in say, 2015, your absolute income from dividends and interest is much higher in 2021, even though your yield percentage is lower. You had a good run right after retirement.
However, this is not necessarily good news if you are retiring today. There are countless articles debating this topic, but I historically support a 3% withdrawal rate as a reasonable target for planning purposes if you want to retire young (before age 50) and a 4% withdrawal rate as a reasonable target if retiring at a more traditional age (closer to 65). However, nobody is guaranteeing these numbers and flexibility may be required if there is a bad stock run right after retirement. The “good ole’ days” included the ability to put your money in a CD or high-quality bond and still keep up with inflation…
If you are not close to retirement, there is not much use worrying about it now. Your time is better spent focusing on earning potential via better career moves, investing in your skillset, and/or looking for entrepreneurial opportunities where you own equity in a business asset.
How we handle this income. Our dividends and interest income are not automatically reinvested. I treat this money as part of our “paycheck”. Then, as with a real paycheck, we can choose to either spend it or invest it again. Even if still working, you could use this money to cut back working hours, pursue new interests, start a new business, travel, perform charity or volunteer work, and so on.
“The editorial content here is not provided by any of the companies mentioned, and has not been reviewed, approved or otherwise endorsed by any of these entities. Opinions expressed here are the author's alone. This email may contain links through which we are compensated when you click on or are approved for offers.”
Windows Authentication is now supported on Cloud SQL for SQL Server. We’ve launched seamless integration with Google Cloud’s Managed Service for Microsoft Active Directory (AD), now in public preview. This capability is a critical requirement to simplify identity management and streamline the migration of existing SQL Server workloads that rely on AD for access control. This release is the latest milestone in Google Cloud’s ongoing commitment to enterprise customers to meet you where you are. We are focused on offering low-effort, highly compatible, lift-and-shift destinations in the cloud. Google Cloud provides a complete portfolio of services to support your organization’s Microsoft and .NET workloads, and the integration between these two services makes it simpler than ever to set up a compatible environment for your business-critical databases.
Since its initial release just last year, Cloud SQL for SQL Server has provided a managed database solution that reduces customers’ operational toil and risk while maintaining compatibility and providing a flexible and high-performing platform. AD integration complements these benefits by ensuring continued security and compliance for your organization’s workloads. For customers utilizing AD on-premises, you can easily set up Google Cloud’s Managed Service for Microsoft Active Directory in a trust relationship with your existing AD deployment. This will allow you to continue using your existing identities for Cloud SQL for SQL Server as well as any workloads that may not yet be migrated to the cloud.
Setting up Windows Authentication
Getting started with a new Cloud SQL for SQL Server instance just takes a few quick steps, or you can enable Windows Authentication on any existing instances as well. Just make sure you meet the prerequisites outlined here, then proceed with the following steps.
4. Enter a name for the instance. Do not include sensitive or personally identifiable information in your instance name; it is externally visible. You do not need to include the project ID in the instance name. This is created automatically where appropriate (for example, in the log files).
7. Under Configuration options, set your desired options (but wait until the next step for the authentication options).
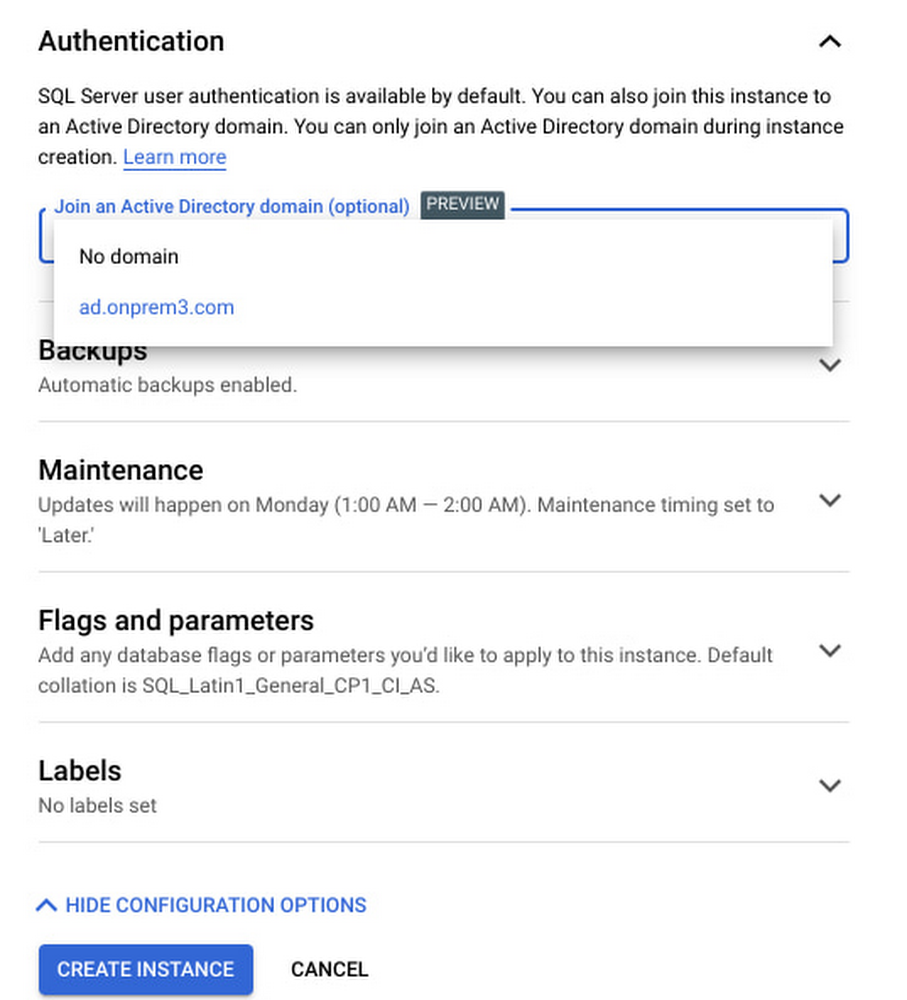
8. Click Authentication. The dropdown menu for joining a managed Active Directory domain lists any Managed Microsoft AD domains that previously were added in your project.
9. From the dropdown menu for joining a managed Active Directory domain, select a domain.
10. When you are finished selecting your configuration options, click Create. Cloud SQL automatically creates a Per-Product, Per-Project Service account for you. If the account doesn't have the appropriate role, you are prompted to grant the managedidentities.sqlintegrator role.
Getting started
Windows Authentication for Cloud SQL for SQL Server is available in preview for all customers today! Learn more and get started.


![[personal profile]](https://www.dreamwidth.org/img/silk/identity/user.png) janegray
janegray
 comments