Irregular Trading Hours Data?? You’ve probably heard about Regular Trading Hours Data? But, what about data with ‘Irregular Trading Hour’ patterns? Say if you wanted daily bars where the OHLC data points are somewhere not usual — away from the crowd mentality — what then? How can you optimise your trading edge in a more exotic timeframe?
Listen to Arthur Maddock chat about the relevance of Irregular Trading Hours Data; this exciting new way to create intraday and daily bars for backtesting. Discover edges between the sessions where no one else tends to look…
Overnight Daily Bars
Several funds have approached Portara about the ability to create daily bars (from intraday data, of course) that span across an overnight session. Think about it! Imagine — as one random example — the Canadian Dollar… if you could create OHLC Daily Bar data that began at 2200h Monday evening Chicago and completed 0600h Tuesday morning, i.e. the following day? Imagine now that you run off this OVERNIGHT DAILY DATA back to market inception, or as far as bars were available. Then envisage knitting the contracts together into a backadjusted continuous stream for testing. What edges would you find in there? What benefits could your quant team discover with this type of flexibility?
Portara has this functionality built into its modelling as standard. You have to wonder why hedge funds are asking Portara for this stuff?
Overnight Intraday Bars
In the same manner as described above, Portara allows you to create overnight intraday bars as well. Whether its 1 minute, 5 minute or 60 minute bars you are working with you can create DYNAMIC SESSION-BASED DATA across the midnight back through history, regardless of what the characteristics of the data displayed in the past. Whether you work with exchange-based timestamps or locally-based timestamps, Portara provides the flexibility to give you exactly what you want.
This presentation “History of corn exchanges” takes a look at the rise and fall of the Corn Exchanges in the UK and the rest of the world and the beautiful architecture that was left behind. As a data supplier to the industry and ex trader I am amazed by the enterprise and innovative solutions that capitalism through the ages has influenced. Both, upon our impetus to ameliorate as a species and as a driving catalyst to the limitless human imagination.
Join me for a look at the rapid expansion and demise of the UK Corn Exchanges throughout a short 30 year period towards the end of the 19th century. The one big difference with this demise compared to countless others in history is that it has left us with a legacy of magnificent architecture that is still an important part of UK heritage.
You can purchase Corn futures from multiple exchanges by contacting Portara.
In our latest article – How To Create Continuous Futures Data – We cover what continuous futures data is, how to create continuous data and why continuous data is important. We also cover some of the potential issues you may encounter when creating continuous 1 min data. Below is a short summary from the article:
To be successful at trading futures it is imperative that you fully understand how to create continuous futures data properly. You need to consider what significant mechanisms are at play and how to use and integrate them. But even more importantly, what pitfalls lie in store for you if you get it wrong and why.
If you are new to trading and are considering a purchase of continuous daily futures data or continuous intraday futures data then this is the place to start. If you are a veteran trader CTA or fund, then at least you will appreciate many of the concepts below. I have outlined some basic concepts first and then continued with more advanced discussions.
How to Roll Futures Data
If you read several of the blogs on the internet about how to create continuous futures data or how to roll futures data then yes it’s usually informative and yes, most of what they say does add up. However, it is usually written by an academic or person who is not actively engaged in seeking out profits through the physical act of trading. They miss out the key discussion areas ‘which are relevant to traders‘ when trying to determine how to roll futures data successfully. A lot of what they say can be interesting but not usually trader-prescriptive.
“The basic mechanism of how to roll futures data is to get a collection of individual futures contracts and join them together at specific key dates throughout history.”
Arthur Maddock – CEO
Below, you will learn why you can’t just choose a one-fits-all method to roll data. All commodities have their own roll nuances, and by what sometimes can appear to be whimsical convention, each have their optimal sweetspot.
Why Do We Need To Create Continuous Futures Data?
We need to create continuous futures data because if we compare any two futures contracts, then at any shared date (or timestamp) TWO prices exist1 — one price in the expiring contract and the other price in the new contract. If you look at the prices for both dates and match the timestamp, the two prices are NOT the same, they differ. If they are the same it’s pure coincidence. Futures contracts are mutually exclusive and are fully independent from one another.
Thinking further, the fact that you may need to exit your current position from an expiring contract and enter a new position in the next available contract as liquidity falls towards the old contract’s expiration date means that any historical data created that spans across the two contracts will require thought and consideration as to what it should take account of.
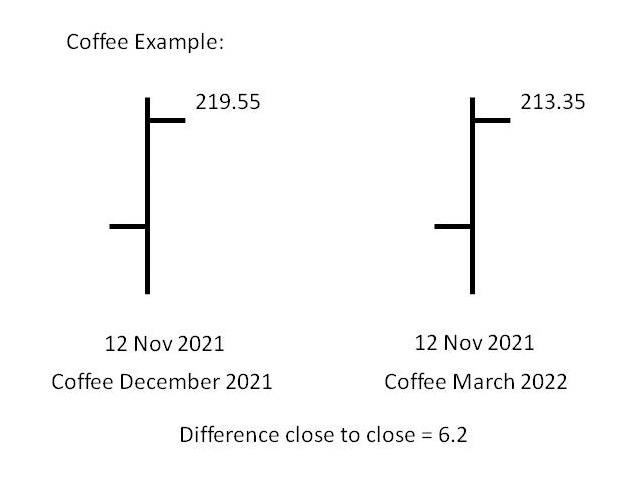
For example, the commodity Coffee trades in the months of March (H), May (K), July, (N), September (U) and December (Z)2. CQG’s data reach is extensive and for Coffee there are 253 individual contracts from 1973 to now that need to be spliced together into a single file to represent the continuous futures data. Once ready, the continuous futures data file can be imported into a backtester or trading platform in order to conduct research, or to trade off.
Types of Futures Data Adjustments
There are several ways in which individual futures contracts can be spliced together. Each roll type is useful in some areas but not in others. The way you trade has an important impact on what type of continuous futures data mechanism you opt for. The most common adjustments are:
What is Backadjusted Futures Data?
If you are a medium or long term trend follower then you are probably going to require continuous futures data that has been backadjusted.
Backadjusted futures data is by far the most popular adjustment mechanism for medium to long term trading strategies. If you hold positions for several days in the markets rather than get flat at the end of each day this is normally the best choice. The objective of the method, in fact any continuous data method (apart from zero adjust) is to:
Remove the ‘gaps’ that form at the roll spot.
Join all the individual data files together into one file containing all the data3
So, in the example, we need to adjust the BACK month, i.e. make the 12 November close in December 2021 Coffee 213.55 too. We do this by removing 6.20 from the open, high, low and close for that specific bar. This is where the word backadjusted derives from. This opens up several considerations:
We have adjusted the one bar at the roll date. However, we now need to adjust ALL the data in the December 2021 contract by 6.20 too. That should make sense, right?
Next we need to consider that we have 253 individual files in which we need to apply the same process. So, if we move backwards to the next contract, in this case it would have been September Coffee moving into the December Coffee, the adjustment close to close might turn out to be 4.80. So now it’s a matter of adjusting the data in the September Coffee by a factor of 11.00 (6.20 + 4.80). The point to remember here is that the adjustment method is CUMULATIVE. So, with each progression backwards you need to adjust by the cumulative amount each time. In this case it is 11.00 made up od two numbers, backwards further will consist of 3 numbers etc.
What are the benefits of backadjusted data?
To answer the question of what is the point of backadjusted data you need to return to your trading methodology. For long term trend followers the continuous futures data now adopts an intuitive ‘shape’. This means that entering a position on September 2021 Coffee and exiting a position in March 2022 Coffee when looking at backtest results, does not skew the profits or losses of that position as it has accounted for the ‘gaps’ between different and mutually exclusive futures contracts.
What are the drawbacks of backadjusted data?
No continuous roll method comes without drawbacks. Here are a few:
The only contract that aligns with the individual contract history is the final contract in the series. All other contracts have been backadjusted by the cumulative value.
For this reason you may need to view the individual contracts too.
Any indicators that you apply to the data may need consideration. If for instance, you have a 200 day moving average and apply that to the backadjusted data then that may look and behave very different in real time when comparing it to your individual contract’s 200 day moving average when placing trades. The issue is that an individual contract may only have 90 days of data in it. If you require 200 days of data to form the moving average you may only be capable of doing that in the continuous data series. This is why the moving average may differ enormously when contrasting data shape.
If the adjustment each cumulative increment backwards always leads to prices falling at some point the data may go negative. Although valid, backadjusted data may not be compatible with current backtesting software. You need a data supplier who understands these issues and can offer alternatives to suit your setup.
Can I Backadjust Data in an Excel Spreadsheet?
This question gets asked a lot. The answer I tend to give is that it depends. If you are a wiz with Excel, especially areas of datetime, and you are looking at daily data the yes, it may be worth a go. However, you do need to understand the gotchas associated with this method, they are very real so to be extremely careful is key!!
If you are looking at anything above daily data then the answer is a big NO. It’s a waste of time and effort to consider intraday data with the method. Excel wasn’t designed to deal with big data issues. You will require programming knowledge to make that happen or an expert that provides continuous futures data who can do the job for you.
Another word of caution too… never buy data, any data for that matter, but especially ‘ready-made’ continuous data from the online bucketshop suppliers. The bucket-shop route is a guaranteed ticket to the poor house.
What is Forward Adjusted Data?
I have been around the data world for a long time. I have only ever created forward adjusted data for one client. It is obscure and not used much. The premise is that it is the opposite way around to backadjusted data. It is the most historic contract that remains identical to the individual contract. The cumulative adjustments are traversed forwards through the data contracts from most historic to current. Does forward adjusted continuous data provide any benefits? I am uncertain. I can’t think of any off the top of my head, but maybe you can? Let me know…
What is Ratio Adjusted Futures Data?
who This is the adjustment method that requires the most caution. Ratio adjusted data is often used when looking at VAR (Value At Risk) across a portfolio and position sizing. It is specialized and in the wrong hands can be disastrous. If you know what you are doing then fine. However, if you are new to trading in any way and are in the curious mode for what this represents, don’t just dive in without making sure you understand the mathematics behind it. I did a blog post on ratio adjusted methods with a quant group called Cabestan Research, who are based in London, several years ago and created a white paper on ratio adjusted methods. It is technical but the fundamentals of the method are outlined. The main difference between forward and back adjust algorithms compared to ratio adjust algorithms is the fact that the former are additive and the latter are multiplicative.
What is Zero Adjusted Futures Data?
This is perhaps the easiest concept to understand. Zero adjusted data is either 1 minute futures data or daily futures data which has been joined together to form a continuous series. However, with this method there is no adjustment that gets applied. The gaps are left ‘as-is’. This way, you get the benefit of continuous futures data showing the actual prices of what occurred in the market and the data all in one file. This method is good for traders who still want the advantage of having long lookback periods in their data stretching across multiple contracts. This way they are only interested in the most liquid parts of all conjoined contracts but where they do not hold positions for long periods of time or across roll dates. Traders using this style of data would tend to be more short-term. Day traders often use this methodology.
Continuous Intraday Futures Data Problems and Solutions
When we create continuous daily data the moving parts are much less than when we wish to create continuous intraday data. Once timestamps, rather than just dates are included, things become more complex. Also, the close is not just the settlement anymore, it can now be interpreted according to the trader’s needs. This needs more explanation.
CQG data is known by everyone worth their mettle as being the best provider of intraday data globally. This is the reason Portara and CQG service so many funds with their data. Have you ever wondered why that is the case?
Problem 1 | Solution 1– Robust Data Sets
One of the reasons why, is that CQG has a huge data integrity department that makes sure the data is clean. They look and correct this stuff 24/5. There are hundreds of staff in 12 countries at the time of writing. What that means is the data is ROBUST. It is no good purchasing data that purports to offer data cleaning. How do you know what they are doing is even correct? There is a whole ethos surrounding do’s and don’ts of data collection and cleaning that is decades old. Robust historical data sets are the most important resource that a trader can invest in. Otherwise it ends up being a classic case of ‘Garbage In Garbage Out’ (GIGO).
Problem 2 | Solution 2 – Requirement for settlement price in intraday and tick data
CQG data sets provide the settlement price timestamped into the intraday data as standard. Why do we do that? Because if you don’t do that how are you going to form a roll that follows the daily data set? If you try to use the intraday data price points to form a roll you are faced with the following issues:
Continuous intraday data will be completely different to the continuous daily data it should try to emulate. The data shapes will not match. You now have a data set of apples trying to be a data set of oranges.
If you do purchase continuous intraday data from data suppliers who do not include the settlement then all you will achieve is data sets based upon non-settlement roll methods!
Further, if you create continuous intraday futures data based on any type of non-settlement roll methods and contrast the differences to the daily data set, any backtest that does contain both data sets will be skewed and out of alignment.
Problem 3 | Solution 3 – Fixed Roll Methods ‘No thank you!’
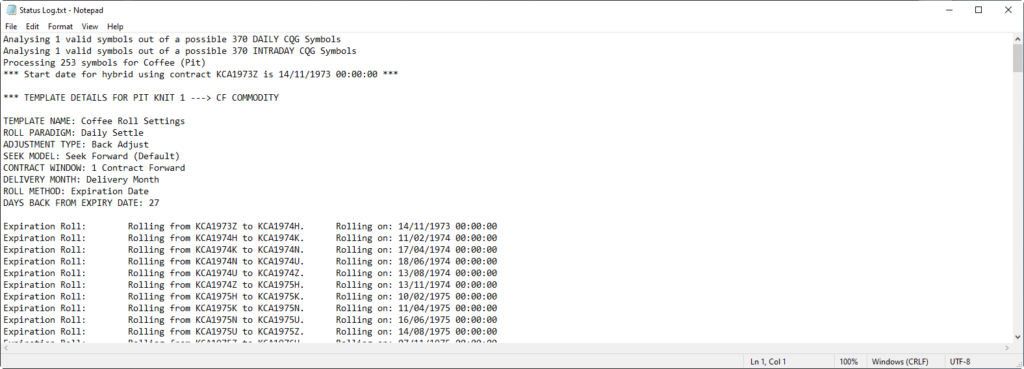
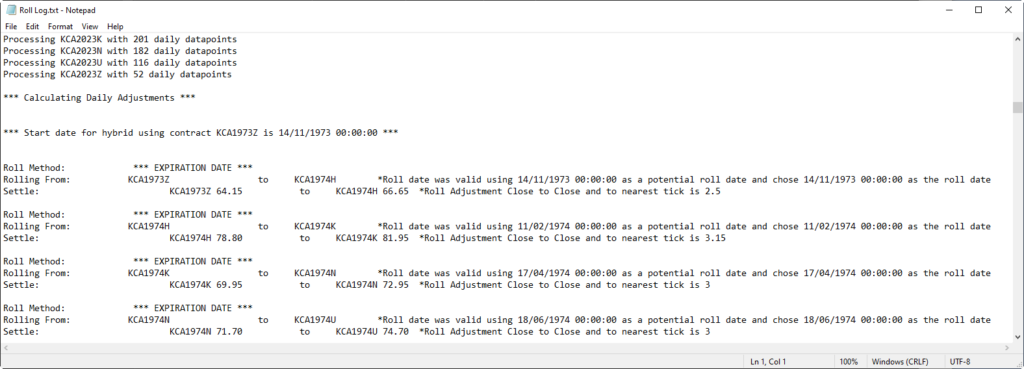
It is no good purchasing continuous intraday futures data from a supplier offering ‘fixed’ roll methods. As how do you know what they are and why they are there? You wouldn’t give investment money to someone with a black box where you didn’t know the rules, or at least understand what’s inside it. So what’s the difference here? If you are purchasing continuous data to make investment decisions you need to have a data audit trail of where the rolls took place and why. Going forward because continuous data is always changing at the next roll, if you have data updates then you need to be assured that the data is the same or follows the same set of rules. Below is an example of a data audit trail of daily and continuous futures data that has been run for Coffee from 1974 to now. Click the images to study the Roll Audit Log and the Status Audit Log. In summary you will see:
An appraisal of what contracts and delivery months were chosen.
In this case a calculation of the DAILY settlement adjustments to apply to the intraday 1 minute data streams.
Potential v actual roll dates when there are holidays.
The spread and cumulative spread values showing any contract backwardation and contango values (good trading edges to be found in here).
Calendar date roll summaries.
Roll model and methods used.
Contract Window: Usually for STIR and other advanced roll methods where the liquidity can be much further forward than the nearest future.
*Click to view the full text file
*Click to view the full text file
Problem 4 | Solution 4 – Do not roll in illiquid areas
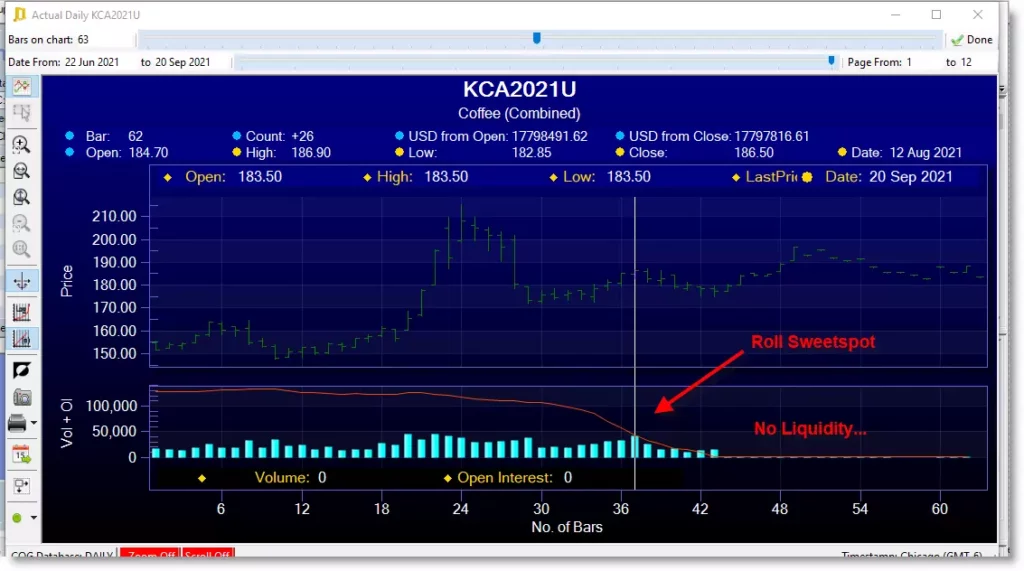
A common mistake when creating 1 minute continuous futures data is the potential of creating rolls in illiquid areas. If you do not understand the nuances of the particular commodity it is easy to purchase continuous futures data containing this fundamental mistake. All commodities behave differently. There is no magic wand or rule to follow with the creation of continuous data. For example, with Coffee, notice the 27 days prior to expiry rule in the Roll Log. The reason that value was chosen is because by trading convention the liquidity in coffee contracts traded on NYI exchange falls off way before the expiry date as published by the exchange.
In the image above, looking at September 2021 Coffee, we can see one potential roll sweetspot at 26 days prior to the contract’s expiry. (27 days prior being just as good). What is important to notice however, is the falloff in liquidity after this time. Notice in the last 3 weeks where the contract was still open; it offered little in the way of liquidity except ‘traps’ for the unwary trader. If your continuous data isn’t created without taking this into account, you may find what appear at first site to be valid rolls are in fact absolutely not. Make sure you insist on a data audit trail of historical roll behaviour from your data supplier every time!
Problem 5 | Solution 5 – Thin markets and poor data suppliers AVOID!
In futures markets in general, liquidity needs to ‘build’ during the early stages of a contract’s life for the contract to be a good candidate for rolling. Sometimes however, the commodity may just remain thin . Apart from Problem 2 above, If you try to create a roll with intraday data or tick data that is thin it can lead to absurd choices for where to calculate the adjustment value. There may be huge gaps spanning days that make the whole stream a mess. Intraday or tick data that doesn’t include the settle price may produce continuous data that is wildly different to anything deemed as sesible. This is because there is no ‘central mechanism’ at play in which to match back with. What can initially appear to be valid data at first can result in consternation further on down the line. If there are no trades or there are little amounts of trades present or there are vast swathes of patchy data the watch out. If the data looks absurd then this will potentially be the reason. You need a supplier who handles these type of scenarios as standard.
Problem 6 | Solution 6 – Purchase data from veteran suppliers with LONG data reaches
Why do you think that only one or perhaps two companies in the world provide long-reach intraday and tick data prior to 2007/2010?
The reason is deep historical futures data is not like data today. Many of the futures markets that traded back then that still trade today were originally fractional based and not decimal. For instance, Soybeans trades in 0.25 increments today. That was known as quarters in the past i.e. ¼s. In the 1960’s and very early 1970s it even traded in 1/8s.
The cost of hard drive space in the 1980’s was very expensive. Hard drives of that era were only available in capacities of a few megabytes! For the few data collection services that existed then it was common to try to limit data collection by the use of a flag state. So a price of 10 and a quarter was recorded as 10.2 (dropping the 5 for space reasons). 10 and three quarters would be 10.7 etc. It was then a matter of interpolation to convert back. The fun begins when creating continuous data. 10.7 can easily become 10.8 or 10.1! What do you do then? We have seen suppliers sell data like this without even realizing its flag-based data and needs a conversion.
Problem 7 | Solution 7 – Continuous data tick size issues over time
Tick sizes throughout history often change. And little known to most are that tick sizes between the most active contract and less active contracts under certain conditions differ. This is true today not just historically. You need continuous data whereby the complete stream is homogenous to the tick size through the ENTIRE history not just sections of it. If you don’t you will be backtesting on tick sizes that don’t exist. Roll algorithms and data import tools in backtesters are unforgiving as far as situations like this are concerned. Don’t find out the hard way!
Problem 8 | Solution 8 – Use a data provider that can tailor the service to you personally
My data won’t import into my backtester or code! This is a common scenario we encounter when people tell us the have purchased cheap data. You need data that is guaranteed to parse into any backtester under all circumstances. There are many reasons why parsing can fail. Problem 7 above is a great example however, the other problems discussed in this guide are just as relevant. Outlined below are some of the more common ones I have seen; the list is not exhaustive:
Data is non-contiguous, i.e. future timestamps behind past timestamps.
Double timestamps reported for the same increment of data4
Data decimalisation inconsistent.
Delimiters incorrect, this can be via delimiter alignment, too many of them, not the correct type etc…
Nulls, int and double max and mins and divide by zero issues painted all over the data sets.
There are many others but you get the idea!
Summary
As you can see, there are many moving parts in knowing how to create continuous futures data streams robustly. If you once believed it’s just a matter of purchasing ‘ready-made’ continuous intraday futures data from cheap providers at the lowest price, then you got lucky by reading this first! Quality data from a reputable supplier is the most important decision prior to entry and exit rule considerations.
Arthur Maddock was a trader at Galt Capital and traded his own fund in the UK up to 2008. He has been the CEO of Portara using CQG’s superior data sets since 2008. You may reach out to him for discussions at any time.
1Disregarding all open contracts to keep the example simple 2Once in 1974 we even have data where it traded a November contract! 3With tick, the continuous single file containing all the data may need to be split into smaller files due to OS constraints 4Not applicable with tick data
Hang Seng Index (HSI) is generally a free realtime index for Hong Kong Stock Exchange but you will need to purchase historical Heng Seng Index data as a separate product from a reputable supplier. The HSI is calculated based on the price movements of over 200 stocks traded in the Hong Kong Stock Exchange.
The index is calculated based on the closing prices of 30 stocks listed on the Hong Kong Stock Exchange.
The HSI is calculated using the following formula:
The HSI is then divided into three subindices:
The CSI 300 Index – A composite index composed of the largest companies listed on the Hong Kong Exchange.
The HSI Small Cap Index – An index composed of small cap stocks with high liquidity.
The HSI MidCap Index – An index composed mainly of midcap stocks.
The HSI has been published since January 1, 1990. In addition to being used as a trading tool, the HSI is also used as a benchmark for other markets such as the Shanghai Composite Index (SCI).
Hang Seng Index Chart
The HSI is calculated using the average closing prices of 30 stocks listed on the Hong Kong Stock Exchange. These 30 stocks represent approximately 80% of the total market capitalization of the Hong Kong Stock Exchange, making the index a good representation of the entire market.
Hang Seng Index Technical Analysis
The HSI has been trending higher since its low point in early January. This trend was broken when the index fell below the 50 day moving average line. Since then, the index has bounced back above the 50 day moving average.
The index is calculated based on the price movements of over 200 stocks listed on the Hong Kong Stock Exchange.
The HSI is often referred to as the “Shanghai Composite” because it tracks the performance of the Shanghai Stock Exchange. However, the HSI does not directly reflect the performance of the Shanghai exchange. Instead, it reflects the performance of the entire Chinese stock market.
In this PRESENTATION – How To Ratio Adjust Futures Data – we learn the steps necessary for rolling futures contracts using the RATIO ADJUST mechanism. NOTE: You can follow the video presentation and also download the original whitepaper below. I have included a transcript so that you can follow through the examples I have chosen for the detailed explanations. How To Ratio Adjust Futures Data explains the concepts behind this fairly obscure rolling methodology. If you need to know How To Ratio Adjust Futures Data then look no further, it is all fully explained below.
How To Ratio Adjust Futures Data
Many people who trade futures for a living don’t fully understand the differences between the various roll options available to them, and more importantly, when and how to use them. What is dangerous is to simply rely upon the continuous data provided by a typical data vendor without knowing what is happening behind the scenes. If you make assumptions here without knowing the implications then as a trader you may be risking more than just surprises.
In this short presentation we look at a little known way to roll based on the RATIO ADJUST mechanism. We will explore both back ratio adjust and forward ratio adjust methods and how to calculate them.
The fundamental difference between forward and back adjust algorithms when rolling data compared with forward ratio and backward ratio adjust algorithms is the fact that the former are additive and the latter are multiplicative. Some of you may understand this straight off the bat, but some may not.
I will do another presentation at a later time on the more common additive adjustments, but for this presentation we shall concentrate on multiplicative rolls.
Cabestan Research in London gave me a great white paper explaining the concept which I have used in this presentation, so a big thanks to those guys.
Looking at table 2, the ratio back adjust, and working from the bottom row, towards the top we can see t1 and t0 as the roll dates across three contracts of the S&P. The prices are the closes and I have labelled p, q and r with the respective contract names to make it easier to interpret the maths.
Now look what’s happening. At t1 on the 13th June we are dividing SPU17 by SPM17. In other words dividing the most forward month by its nearest back month. This gives us the ratio of 0.99918033 in which to MULTIPLY all data points, ie the open high low and close prior to that roll.
So does it work? If you get a calculator and follow through the maths you will see still on row 3 that 0.99918033 x the unadjusted close of 2440 is 2438, rounded. On row 4 applying the same ratio, we see the unadjusted close of 2428.5 multiplied by 0.99918033 is 2426.5 rounded, so the logic works.
Now repeat the process until we reach the final roll at t0 on 14th March. Things become more complex. So, let’s strip back the complexity and explain it. Here we now need to look at dividing SPM17 by SPH17, in the same manner as before. 2363.1 divided by 2366.4 is 0.99860547. but what about the ratio we had before we reached this second roll. The point is you must MULTIPLY this new ratio of 0.99860547 by the old ratio of 0.99918033 to give us the cumulative adjustment of 0.99778695. It is this figure that we use to multiply the data by in each and every case. We can see that if we do that, we see that at t0 the unadjusted close was 2366.4. If we multiply this by the cumulative value of 0.99778695 we do indeed get 2361.2. Now it’s a simple case of rinse and repeat as the algorithm is clearly defined and programmable either in code or by manual design in a spreadsheet.
Note, to cross check and verify the final results, ideally, if we kept tabs on the cumulative ratios all the way through history the cumulative value in the first row multiplied by close should bring you back to the unadjusted close in that contract. I have used Portara to run off a simple example of 1 minute bar of the S&P back to inception and I have included a cumulative adjustments and unadjusted close as columns in the series to make this helpful. If we look at the results we can see that the cumulative adjustment of 1.546855533 multiplied by the unadjusted close of 331.0 does indeed verify the close of 331.0. And, thus, we can determine that the data is proportionately correct.
A quick note if we decide to reverse direction and go with a forward ratio adjust, we must be careful to get the direction of the division in the correct order as it is not the same way around. If we look at Table 1, in this case, using the forward method, all the mathematical nuances are the same however, logically the division must be the reverse of the back ratio adjust and in this way on the 14th March roll date at t0 the SPH17 is divided by SPM17 to arrive at the forward ratio adjust of 1.001396471.
Lastly, a cautionary note on utilising ratio adjusted data in your backtesting. If you don’t fully understand this method, don’t use it to predict results! Ratio methods are useful for certain types of testing but if you don’t know what you are doing the results can be very misleading. By design, data is never negative using ratio adjust. It may appear squeezed compared to backadjusted additive methods as the intuitive shape gets distorted. But, you can measure the volatility of returns in terms of percentages, avoiding negativity and very small numbers close to zero, which would distort your percentage ratios. Or, even zero itself, and possibly a divide by zero exception if you have decided to build your algorithms with divisions instead of multiplicative factors! For example a good use for ratio adjusted data is if you were trading two contracts such as Bund and Gold; you could in theory compute a volatility ratio between the two and use that to risk adjust your positions.
The Dow Jones Industrial Average (DJIA) is an index that tracks the price movements of 30 large American companies. These companies represent nearly half of all stocks traded on the New York Stock Exchange.
How does it work?
The Dow Jones Industrial average is based on the prices of 30 large companies listed on the New York Stock Exchange. Each company is given a weighting factor based on its market capitalization. This means that each company is assigned a percentage value based on how much money it is worth. Companies with more shares outstanding will receive a higher weighting than those with fewer shares.
What does it measure?
The Dow Industrial average was first published in 1896 by Charles Dow and Edward Jones as a simple average of the prices of thirty leading industrial corporations. In 1928, the Dow Jones & Co. changed its name to Dow Jones & Company Inc., and in 1988, the company became part of News Corporation.
Why is it important?
The Dow Jones index has been used as an indicator of the state of the American economy since 1896. It is calculated using the price changes of 30 large publicly traded U.S. companies. These companies make up the Industrial Dow Jones Average. The DJIA is considered a good measure of the general direction of the U.S. economy because it reflects the performance of the largest companies in the United States.
When should I use it?
The DJI index is used by investors as an indicator of the general direction of the stock market. Investors use the Dow Jones Industrial Average (DJIA) to determine whether to buy or sell stocks. If the Dow Jones rises above 14,000, then the investor knows that the stock market is going up. Conversely, when the Dow Jones falls below 7,500, the investor knows that the market is heading down.
Dow Jones Derivatives
There are E-Mini and Micro derivatives of the Dow Jones Index:
Hang Seng Indices are a widely followed stock market indices that tracks the performance of Hong Kong’s main stock exchange. The Hang Seng Indexes are often just referred to as “the Hang Seng” because the first was created in 1968 by the Hang Seng Bank.
What are The Hang Seng Indices?
The HSI is composed of the top companies that represent approximately 80% of the total value of the Hong Kong Stock Exchange. These companies are chosen based on their liquidity, size, and market capitalization.
Hang Seng Market, a leading multi-asset class exchange in Asia, provides investors access to Hang Seng Index Futures (HSI) which offer an efficient way to gain exposure to the Hong Kong equity market.
The HSI futures contracts are based on the flagship stock index of Hong Kong, comprising of 50 stocks listed on the Stock Exchange of Hong Kong.
The Hang Seng Index today is all electronic!
HSI Futures offer investors a cost-efficient approach to diversify their financial portfolios and capitalize on opportunities in the Hong Kong equity market. Furthermore, these futures contracts provide traders with greater liquidity and increased leveraged exposure compared to stock trading. With its impressive track record, HSI Futures have become an important instrument for active traders and investors who seek to capitalize on short-term market movements.
Trading Hang Seng Index Futures is a great way for investors to benefit from the growth potential of the Hong Kong equity market while managing risk and preserving capital. With its high liquidity, low transaction costs, and exceptional flexibility in trading, HSI Futures are a great tool for any investor looking to capitalize on short-term market movements.
Why Do Investors Care About Hang Seng Indexes?
The HSI is one of the most popular tools used by investors because it provides a snapshot of the stock market at any given moment. It also helps investors understand how the markets are performing compared to other countries.
How Does The Hang Seng Index Work?
The HSI is calculated using data collected from the Hong Kong Stock Exchange. This includes the prices of shares traded, as well as the volume of trades. The index is then adjusted based on the number of trading days in each month.
The Hang Seng Tech Index was launched in November 2020 to track the performance of 40 companies that are related to technology, such as software, internet and telecommunications. The index tracks the share prices of these companies on the Hong Kong Exchange. It is designed to provide investors with a benchmark for tracking the performance of tech stocks in Hong Kong.
The Hang Seng Index is one of the oldest and most widely used stock market indexes in Asia. It was first compiled in 1969, making it one of the oldest indices on the Hong Kong stock market. Over its history, the index has provided investors with a good indication of overall market performance for stocks traded on the exchange. The Hang Seng Index is currently composed of Asian stocks, being the largest stock index in Hong Kong.
The Hang Seng Tech Index includes some of the most prominent technology stocks listed in Hong Kong. These include Tencent, Alibaba and Xiaomi, as well as smaller companies such as ByteDance and Meituan-Dianping. The index companies representing various sectors such as energy, finance and real estate.
The Hang Seng Live Index is also available to investors who wish to track the performance of their investments in real time. The index provides up-to-date information on stocks listed on the exchange, including market capitalization, price movements and other key financial data. Investors.
How Can I Invest In Stocks Based On Hang Seng Indexes
If you’re interested in investing in stocks, you might be wondering how you can use Hang Seng Indices to help you decide what to invest in. You can use the HSI to figure out whether or not you should purchase a stock. It will also give you an idea of when you should sell a stock.
For those looking for ETFs that track the Hang Seng Index, there are a variety of options available. The iShares Hang Seng Index ETF (2823.HK) is one of the most popular and has been around since 2001. It offers investors exposure to 40 of the largest and most liquid stocks listed in Hong Kong, including HSBC, Tencent, and AIA. With a low expense ratio of 0.10%, it’s an attractive option for long-term investors.
In addition to ETFs, Hang Seng Index futures contracts are also available on the Hong Kong Futures Exchange (HKFE). These allow traders to speculate on the future direction of the index, enabling them to benefit from both rising and falling markets. Futures contracts are heavily leveraged, though, so they should only be used by experienced traders who understand the risks involved.
The Hang Seng Index today is hovering around 27,900 points. It has been on a general uptrend since mid-March 2020 when it bottomed out at 21,819 points. The index has yet to recovered its pre-2020 highs of 30,904 points but it is slowly inching closer. Investors should keep an eye on the Hang Seng Index and consider investing in ETFs or futures contracts if they believe the market has further room to rise.
What Companies are in the Hang Seng?
There are three main indexes that make up the Hang Seng Index: the Mainboard, the Mid-Cap Index, and the Small Cap Index. Each index has its own rules and regulations, so it’s important that you understand these before using them as a guide for your investments.
Finally, it is important to take into account the relationship between Hang Seng and Nikkei when investing in the Hong Kong stock market. The Nikkei 225 is an index of the top 225 companies listed on the Tokyo Stock Exchange. is is closely correlated with the Hang Seng Index.. By tracking both indices , investors can gain a better understanding of the overall performance of the Hong Kong stock market.
It’s no secret that the stock market has been on a roller coaster ride this year. Some days are down, some days are up, and it seems like anything can happen at any time. For those of us who trade or work in the financial industry, it can be tough to keep up with all the changes. But one thing that hasn’t changed is the importance of following the S&P 500 index (ES Futures).
E-mini S&P 500 Futures and Contracts
E-mini S&P 500 futures are one of the most popular financial instruments for traders, offering precise access to the direction of the wider S&P 500 Index. If the spx futures move in the anticipated direction, then traders stand to reap large rewards from their corresponding position in contract size. These e-mini contracts allow speculative traders to capitalize on smaller size positions without having to put up as much equity and risk as regular spx contracts. In addition, they have all the same features that standard spx options can offer, including liquidity and leverage so that you can maximize your profitability potential over a short period of time.
The Benefits of Trading ES Futures
Trading ES futures can provide investors with a number of favorable outcomes. For example, given that ES futures trade close to the S&P 500 return, investors can enjoy nearly the same returns as investing directly in the S&P 500 index. An added benefit is that the stock price has less of an impact when trading these futures, meaning any swings due to daily news or other fluctuations won’t have a necessarily noticeable effect on their investments. As such, trading ES futures offers investors a simple and effective way to invest without having to constantly monitor their investment portfolio as they would with traditional stock market investments.
How to Get Started Trading ES Futures
If you are interested in how to get started trading ES futures, you need a comprehensive understanding of how the ES Futures market works and how prices move. That is why it’s critical to familiarize yourself with both a fundamental and technical analysis of the underlying market as well as an analysis of the ES futures chart before you start trading. Carefully study how certain news events and trade dialogues create price movements around specific levels on the chart. Learn how stop losses, take profit points, entry points, risk management strategies, and proper money-management plan can protect your capital from market turbulence. With a sound knowledge of how the market operates and insight into how each investment can impact your overall portfolio, you’re ready to begin trading ES Futures with confidence.
The Risks of Trading ES Futures
Trading ES futures involves a level of risk that is not present when trading stocks. Before entering this market, individuals should be aware of the s&p 500 sectors and the potential returns associated with their investment. Knowing when the futures market is open can also be important – given that the price of a futures contract changes over different market hours. Academic research has shown that following a few fundamental principles greatly reduces the risks involved in trading ES futures. It is therefore advised for individuals to educate themselves on these principles before investing any money.
What Companies are in the S&P 500 Index?
The S&P 500 Index is a benchmark for companies in the United States, boasting the top 501 companies based on capitalization and liquidity. This list of companies is regularly monitored; companies are added to or removed from the index as needed. Some companies make their way onto the list for their sheer size, like Amazon and Microsoft, while others are added for specific industry relevance, such as Abbott Laboratories in healthcare or Ford Motors within automotive. Each company included in the S&P 500 has been carefully chosen to ensure accuracy and relevance; The S&P 500 companies list contains some of the most successful organizations from across all sectors which makes it an excellent place to look when researching investment opportunities. When looking into companies that could potentially be part of your portfolio, consider starting your research with those found on the S&P 500 companies list.
These derivatives are smaller in size, which make it easier and more affordable for smaller investors start trading the index.
Why Invest in the S&P 500 Index Funds/ETFs
Investing in e-mini S&P 500 index funds/ETFs is an attractive option for many investors, given the unparalleled opportunities for long-term growth and diversity. e-mini S&P (ES) and S&P 500 (SPX) futures offer investors high liquidity, relatively low fees, and access to a wide range of stocks representing the largest corporations in the U.S. This means minimizing your risk while maximizing potential gains. Furthermore, e-mini S&P 500 index funds/ETFs provide numerous advantages when compared to other investments, particularly with their tax efficiency and relative ease of investing through exchange-traded funds (ETFs). Ultimately, e-mini S&P 500 index funds/ETFs are sound investments that can help you establish significant wealth over time.
Investing in the S&P 500 index is a smart way to get exposure to large, stable companies that have a history of weathering economic storms. While there are some risks associated with trading ES futures, these can be mitigated by working with an experienced broker and using stop-loss orders. If you’re interested in researching ES futures, reach out to us at Portara for more information. We can help you get started with data and resources you need to make informed decisions about your investments.
The rise of bitcoin has been one of the most talked about financial stories in recent years. However, it’s not just bitcoin that has been on the rise. Futures contracts for the NASDAQ 100 index, known as NQ futures, have also been gaining in popularity. This is due in part to the increasing number of companies listing on NASDAQ, including many tech firms. In this blog post, we’ll take a look at what NQ futures are and how they can be traded profitably.
1. What are ENQ (NQ) Futures and Why Should You Care?
Nasdaq futures also known as nq futures are contracts derived from the Nasdaq 100 index, offering investors access to tech behemoths such as Apple, Microsoft and Amazon. Over the past decade or so, the Nasdaq has outperformed the S&P 500, most notably with Baidu’s meteoric rise on the exchange in 2015. Understanding Nasdaq’s potential benefits is key when developing an investment strategy.
2. How to Test Your Strategy with Historical Data
To test your strategy, there are many options to access historical market data and examine how a potential trade could have performed. But you must take care to find a data provider with quality data. So be warned. Bucketshop data providers, and there are many out there, offer little else other than general headaches and false hope. Remember you get what you pay for, Garbage In = Garbage Out. Quality historical data from a reputable supplier can help you refine your strategy so you can make better informed trades. Following an effective strategy over time should lead to increased returns that will benefit your overall portfolio.
3. Why Backtesting NQ futures is Important
Backtesting is an invaluable tool for automated trading. It allows traders to try out different strategies and test them against a wide variety of data, such as nasdaq futures, before committing to the strategy in a live trading environment. A backtester can help traders identify areas of risk within their strategies, allowing them to make adjustments before engaging in real trades. C# based backtesters or online solutions from Portara and CQG can be some of the most popular options, offering powerful features like customizable charting and price simulation. By running different simulations using different parameters, backtesting can help traders determine which strategies work best for their goals. Ultimately, backtesting is essential for any trader looking to maximize their return on investment.
4. How to Get Started Backtesting NASDAQ
Backtesting can provide critical insights for traders, but before you start, you must be aware of all the Nasdaq chart and Nasdaq 100 nuances that can present themselves. Familiarizing yourself with what’s happening in the emini Nasdaq today rather than just looking at history in isolation is the first step towards successful backtesting of the emini Nasdaq futures market. Additionally, make sure to analyse different market conditions to build a robust strategy – successes and failures in your backtesting should help you adjust your strategy as needed. Finally, adjustments to asset allocations may be necessary depending on whether there is an overall bull or bear market. Following these steps will get you well on your way to becoming a successful trader.
5. The Benefits of Backtesting NQ
Backtesting is an invaluable tool for nq futures and emini Nasdaq traders when it comes to optimizing strategy efficiency. Forecasting what will happen in the markets can be a daunting task but with backtesting, you can use historical data and identify patterns that could give you an advantage. Backtesting also allows micro Nasdaq investors to assess the viability of their strategies while avoiding the risk associated with trading before understanding the full implications of their decisions. Ultimately, taking advantage of backtesting can provide many benefits, from easing investor peace-of-mind to providing insight into how strategies may or may not work.
6. How to Optimize Your Strategy
Optimizing your stock market and futures market investment strategy can seem like a difficult endeavor, however with the right tools and knowledge it can easily become a more manageable experience. One powerful tool within stock market investing is understanding when to use nasdaq versus s&p 500 investments in order to make more informed decisions. It’s important to gain an understanding of when each technique can make the most sense, such as nasdaq having over 3,000 stocks compared to 500 stocks in the S&P 500 index. Additionally, looking into Micro NQ investing gives traders an edge by providing the opportunity to invest small amounts of money at a time while still making wise decisions with their investments. By utilizing nasdaq versus s&p 500 investments as well as taking advantage of NQ Micro investing strategies, traders are able to optimize their strategies for maximum success in the stock market.
Backtesting is a critical component of any trading strategy. By historical data testing your strategy, you can iron out errors and optimize for profitability. The process may seem daunting at first, but it’s worth taking the time to learn how to do it properly. Plus, once you get started backtesting you may find that you enjoy analyzing data and finding new ways to improve your trading results. If you need quality futures data to test your strategies, reach out to Portara – we’re happy to help!
The VIX Volatility Index or Vix for short is a measure of expected volatilty in the US stock market, and is used by traders to determine when to enter and exit markets. This article, looks at the pros and cons of using the Vix Index as a trading tool so you can decide if it’s right for your own trading strategy.
What Is The VIX Index?
The VIX Index is a measure of expected volatility in the US stock market, calculated by the Chicago Board Options Exchange (CBOE). It’s based on real-time prices of options on the S&P 500 index and provides a useful gauge of investor sentiment. It’s also referred to as the “investor fear gauge” since it tends to move up when markets are unstable or uncertain.
Why Trade The Vix Index?
Trading the VIX Index can offer a variety of advantages. It provides an opportunity to take advantage of market volatility quickly and easily, as well as a chance to speculate on the future direction of the S&P 500. Additionally, it is often used as an indicator for future stock movements because it is derived from S&P 500 option prices, allowing you to accurately gauge investor confidence. Finally, trading with the VIX is relatively low cost and easy to learn.
Analyze the Pros and Cons of Trading With The Vix Index.
Trading with the VIX Index can be lucrative, but it also comes with substantial risks. Investors should weigh both the pros and cons carefully before trading with this index. On the pro side, VIX options usually have high liquidity and are relatively inexpensive to trade. The index is also highly responsive to market movements, so traders can receive up-to-date information about prevailing volatility in real time. On the con side, however, you need to understand that implied volatilities can change rapidly and prices of VIX options are known to be more erratic than regular stocks or ETFs. In addition, options trading carries a higher level of risk compared to other investments due to their complexity and the fact that they’re subject to rapid price changes.
How to Read The Vix Charts.
Before trading with the VIX, it’s important to understand how to read the charts. The VIX chart shows the implied volatility of a group of options for a particular expiration date. These figures are typically derived from S&P 500 option prices and reflect the level of investor sentiment involved in that particular index. The chart also displays a moving average line that can be used to interpret long-term trends in sentiment. Familiarizing yourself with these charts can help you make more informed decisions when trading with the VIX Index.