Shared posts

30 May 02:08

A data-driven exploration of the evolution of chess: Game lengths and outcomes

by Randy Olson

For the second in my series of blog posts exploring a data set of over 650,000 chess tournament games ranging back to the 15th century, I wanted to look at how chess has changed over time. Nobility and scholars alike have played chess for over 1500 years, and chess has changed considerably since its inception in the 6th century AD. Since I only have reliable data on chess games from 1850-2014, I’ll start this analysis at 1850.

Chess has been revolutionized several times since 1850. 1851 marked the first international chess tournament in London, leaving the German Adolf Anderssen as the official best chess player in Europe at the time. The 20th century saw several breakthroughs in chess theory as chess players began to treat chess as a science more than a pastime. With the advent of computers in the mid-1900s, chess players started analyzing games and writing computer opponents to hone their craft. Then in the 1990s, the widespread adoption of the Internet allowed players to play chess games with anyone in the world online.

Magnus Carlsen represents the newest breed of chess players to revolutionize the chess world.

Magnus Carlsen represents the newest breed of chess players to revolutionize the chess world.

That leaves us to wonder: How has chess changed in that timespan? In this post, I’ll look at game lengths and outcomes over time. In future posts, I’ll look at how openings and strategies have grown and waned in popularity over time.

Distribution of recorded chess games

We’ll start again with some diagnostics. Unsurprisingly, this data set contains far more games from the past 20 years than for the rest of time. It’s becoming easier and easier to keep long-lasting records of chess games now, so we can only expect this trend to continue. Sadly, this means that many games in the 20th century and earlier are lost to us — but we’ll work with what we have. Despite these shortcomings, this data set includes many of the most famous games in chess history, including The Immortal Game and Fischer’s Game of the Century.

chess-year-distribution

Chess games are getting longer

The first thing I wanted to look at is whether games have changed in length. My assumption was that due to their extra practice with computers and solid training in chess theory, modern chess players would be much more efficient at closing a game early. The data shows the exact opposite: 21st century chess games are longer than 19th century games. Chess games have in fact steadily become longer since 1970, increasing from 75 ply (37 moves) per game in 1970 to a whopping 85 ply (42 moves) per game in 2014. Furthermore, if the current trend holds, chess games will only keep getting longer as time goes on.

(Note: In all of the following plots, the white line is the mean and the shaded blue area is the 95% confidence interval.)

chess-number-ply-over-time

This trend could possibly be telling us that defensive play is becoming more common in chess nowadays. Even the world’s current best chess player, Magnus Carlsen, was forced to adopt a more defensive play style (instead of his traditional aggressive style) to compete with the world’s elite.

The first-move advantage has always existed

In my previous post, I discovered that the first-move advantage becomes more pronounced the more skilled the chess players are. When we look at the ratio of White:Black wins in non-drawn games over time, we find that there has always been a first-move advantage: White consistently wins 56% and Black only 44% of the games every year between 1850 and 2014.

chess-white-wins-over-time

It’s quite interesting that despite 150+ years of revolutions and refinement of chess, the first-move advantage has effectively remained untouched. The only way around it is to make sure that competitors play an even number of games as White and Black.

Draws are much more common nowadays

Since the early 20th century, chess experts have feared that the over-analysis of chess will lead “draw death,” where experts will become so skilled at chess that it will be impossible to decisively win a game any more. The plot below seems to support their fears: Only 1 in 10 games ended in a draw in 1850, whereas 1 in 3 games ended in a draw in 2013. The small dip in draws since 1980 looks promising, but it could very well just be noise.

chess-win-type-over-time

Former World Chess Champion José Raúl Capablanca proposed a more complex variant of chess to help prevent “draw death,” but it never really seemed to catch on in the tournaments. We’re now only left to see whether the computer-aided analysis of chess will push us ever further into a sea of drawn games.

So there we have it. This post has given us a high-level look at how chess has evolved since 1850. The first-move advantage has always been an unfair advantage in chess, and chess games are taking longer to conclude and ending in draws more often than 100 years ago. It will be interesting to check in on the state of chess a decade from now to see how these trends hold up.


What else can we learn from this data set? Leave your suggestions and explain why it’d be an interesting analysis in the comments.

30 May 01:58

Can we do better than R-squared?

30 May 01:57

Similarity Measures for Text Document Clustering (2012) [pdf]

30 May 01:53

Laverna: Self-hosted Evernote alternative

30 May 01:53

Interesting Data Sets for Statistics

26 Jun 14:33

A Model for Stock Returns and Volatility

by Tao Ma, R. A. Serota
We prove that Student's t-distribution provides one of the better fits to returns of S&P component stocks and the generalized inverse gamma distribution best fits VIX and VXO volatility data. We further argue that a more accurate measure of the volatility may be possible based on the fact that stock returns can be understood as the product distribution of the volatility and normal distributions. We find Brown noise in VIX and VXO time series and explain the mean and the variance of the relaxation times on approach to the steady-state distribution.
26 Jun 14:32

Multiperiod portfolio selection with transaction and market-impact costs

by Víctor de Miguel, Xiaoling Mei, Francisco J. Nogales
We carry out an analytical investigation on the optimal portfolio policy for a multiperiod mean-variance investor facing multiple risky assets. We consider the case with proportional, market impact, and quadratic transaction costs. For proportional transaction costs, we find that a buy-and-hold policy is optimal: if the starting portfolio is outside a parallelogram-shaped no-trade region, then trade to the boundary of the no-trade region at the first period, and hold this portfolio thereafter. For market impact costs, we show that the optimal portfolio policy at each period is to trade to the boundary of a state-dependent movement region. Moreover, we find that the movement region shrinks along the investment horizon, and as a result the investor trades throughout the entire investment horizon. Finally, we show numerically that the utility loss associated with ignoring transaction costs or investing myopically may be large
26 Jun 14:32

Cross-Sectional Distribution of GARCH Coefficients across S&P 500 Constituents: Time-Variation over the Period 2000-2012

by David Ardia, Lennart F. Hoogerheide
We investigate the time-variation of the cross-sectional distribution of asymmetric GARCH model parameters over the S&P 500 constituents for the period 2000-2012. We find the following results. First, the unconditional variances in the GARCH model obviously show major time-variation, with a high level after the dot-com bubble and the highest peak in the latest financial crisis. Second, in these more volatile periods it is especially the persistence of deviations of volatility from is unconditional mean that increases. Particularly in the latest financial crisis, the estimated models tend to Integrated GARCH models, which can cope with an abrupt regime-shift from low to high volatility levels. Third, the leverage effect tends to be somewhat higher in periods with higher volatility. Our findings are mostly robust across sectors, except for the technology sector, which exhibits a substantially higher volatility after the dot-com bubble. Further, the financial sector shows the highest volatility during the latest financial crisis. Finally, in an analysis of different market capitalizations, we find that small cap stocks have a higher volatility than large cap stocks where the discrepancy between small and large cap stocks increased during the latest financial crisis. Small cap stocks also have a larger conditional kurtosis and a higher leverage effect than mid cap and large cap stocks.
26 Jun 14:31

What Central Bankers Need to Know about Forecasting Oil Prices

by Christiane Baumeister, Lutz Kilian
Forecasts of the quarterly real price of oil are routinely used by international organizations and central banks worldwide in assessing the global and domestic economic outlook, yet little is known about how best to generate such forecasts. Our analysis breaks new ground in several dimensions. First, we address a number of econometric and data issues specific to real-time forecasts of quarterly oil prices. Second, we develop real-time forecasting models not only for U.S. benchmarks such as West Texas Intermediate crude oil, but we also develop forecasting models for the price of Brent crude oil, which has become increasingly accepted as the best measure of the global price of oil in recent years. Third, we design for the first time methods for forecasting the real price of oil in foreign consumption units rather than U.S. consumption units, taking the point of view of forecasters outside the United States. In addition, we investigate the costs and benefits of allowing for time variation in vector autoregressive (VAR) model parameters and of constructing forecast combinations. We conclude that quarterly forecasts of the real price of oil from suitably designed VAR models estimated on monthly data generate the most accurate forecasts among a wide range of methods including forecasts based on oil futures prices, no-change forecasts and forecasts based on regression models estimated on quarterly data.
26 Jun 14:31

Forecasting using a large number of predictors: Bayesian model averaging versus principal components regression

by Rachida Ouysse
We study the performance of Bayesian model averaging as a forecasting method for a large panel of time series and compare its performance to principal components regression (PCR). We show empirically that these forecasts are highly correlated implying similar mean-square forecast errors. Applied to forecasting Industrial production and in ation in the United States, we find that the set of variables deemed informative changes over time which suggest temporal instability due to collinearity and to the of Bayesian variable selection method to minor perturbations of the data. In terms of mean-squared forecast error, principal components based forecasts have a slight marginal advantage over BMA. However, this marginal edge of PCR in the average global out-of-sample performance hides important changes in the local forecasting power of the two approaches. An analysis of the Theil index indicates that the loss of performance of PCR is due mainly to its exuberant biases in matching the mean of the two series especially the in ation series. BMA forecasts series matches the first and second moments of the GDP and in ation series very well with practically zero biases and very low volatility. The fluctuation statistic that measures the relative local performance shows that BMA performed consistently better than PCR and the naive benchmark (random walk) over the period prior to 1985. Thereafter, the performance of both BMA and PCR was relatively modest compared to the naive benchmark.
26 Jun 10:27

Portfolio selection models based on characteristics of return distributions

by Paweł Wnuk Lipinski
This article concerns the problem of optimal portfolio selection. The objective of this paper is to indicate the best method and criteria for optimal portfolio selection. In order to achieve the objective six models including such optimization criteria as mean, variance, skewness, kurtosis and transaction costs are analyzed. The method of fuzzy multi-objective programming is used to transform multiple conflicting criteria into a single objective problem and to find optimal portfolios. In order to indicate the best portfolio selection model a simulation based on five years data from January 1, 2007 to December 31, 2011 was conducted. The portfolios were constructed from WIG20 stocks and WIBID 3M as risk-free asset.
07 Jun 04:45

Impact of the RapidMiner + R First Tutorial

by a Physicist


The first tutorial of RapidMiner and R extension has been a success. The most impotant blogs of this topic have links to a physicist in wallstreet blog.


Rapid - I - RapidMiner and R for Trading


NeuralMarketTrends


http://www.analyticbridge.com/


Thanks to all I hope to have the same impact in the coming entries.

07 Jun 04:45

Genetic optimization for Trading Strategies using Rapidminer and R

by a Physicist
That is the second tutorial of Rapidminer and R extension for Trading and the first in Video. In the last example the ROC obtained is not as good as it should be to make money in this business, To improve the strategy we will try to optimize the trading strategy. Different methods of optimization and objective functions for trading can be studied in the literature, Finally we will use a genetic non-multiobjetive to optimize our simple strategy.

The simple strategy defined is the following:
  • The symbol used is “IBM” (you can use any other symbol)
  • A SVM (Support Vector Machine) predicts the close value of the next day, and when the value is mayor than the previous day, we obtain a buy signal and otherwise a shell signal.
  • The training data used are historical prizes (close, high, volumen) from 2006 to 2009
  • The validation is done with historical information from 2010
  • It is calculated the following indicators RSI, EMA 7, EMA 50, EMA 200, MACD y ADX.
  • It is created a two days delay temporal window for all historical values.
For the optimization of the strategy it is used a genetic algorithm. The genetic algorithm will modify the input data by removing any entries (for example indicators) in order to maximize the ROC of the strategy . You can watch in the video the model generated:


The results are: Initial ROC of the past tutorial

  clip_image002


 The trading % win in the past strategy:

  clip_image004

 Evolving feature selection in 40 generation, the final ROC performance is improved.  

clip_image006
The ROC funtion improved is the following:
  clip_image008

 The % win trades is also improved

  clip_image010

It is possible to select other kind of optimization algorithm and to maximize or minimize other value like drawdown or other type of ratios like Kelly or sharpen ratio. In the next tutorial, I will improve the trading operation in order to make as real as possible and to incorporate as XML configuration files the symbols.

PayPal - The safer, easier way to pay online!DOWNLOAD FILES  2$ < clip_image014TO IMPROVE THE BLOG


07 Jun 04:41

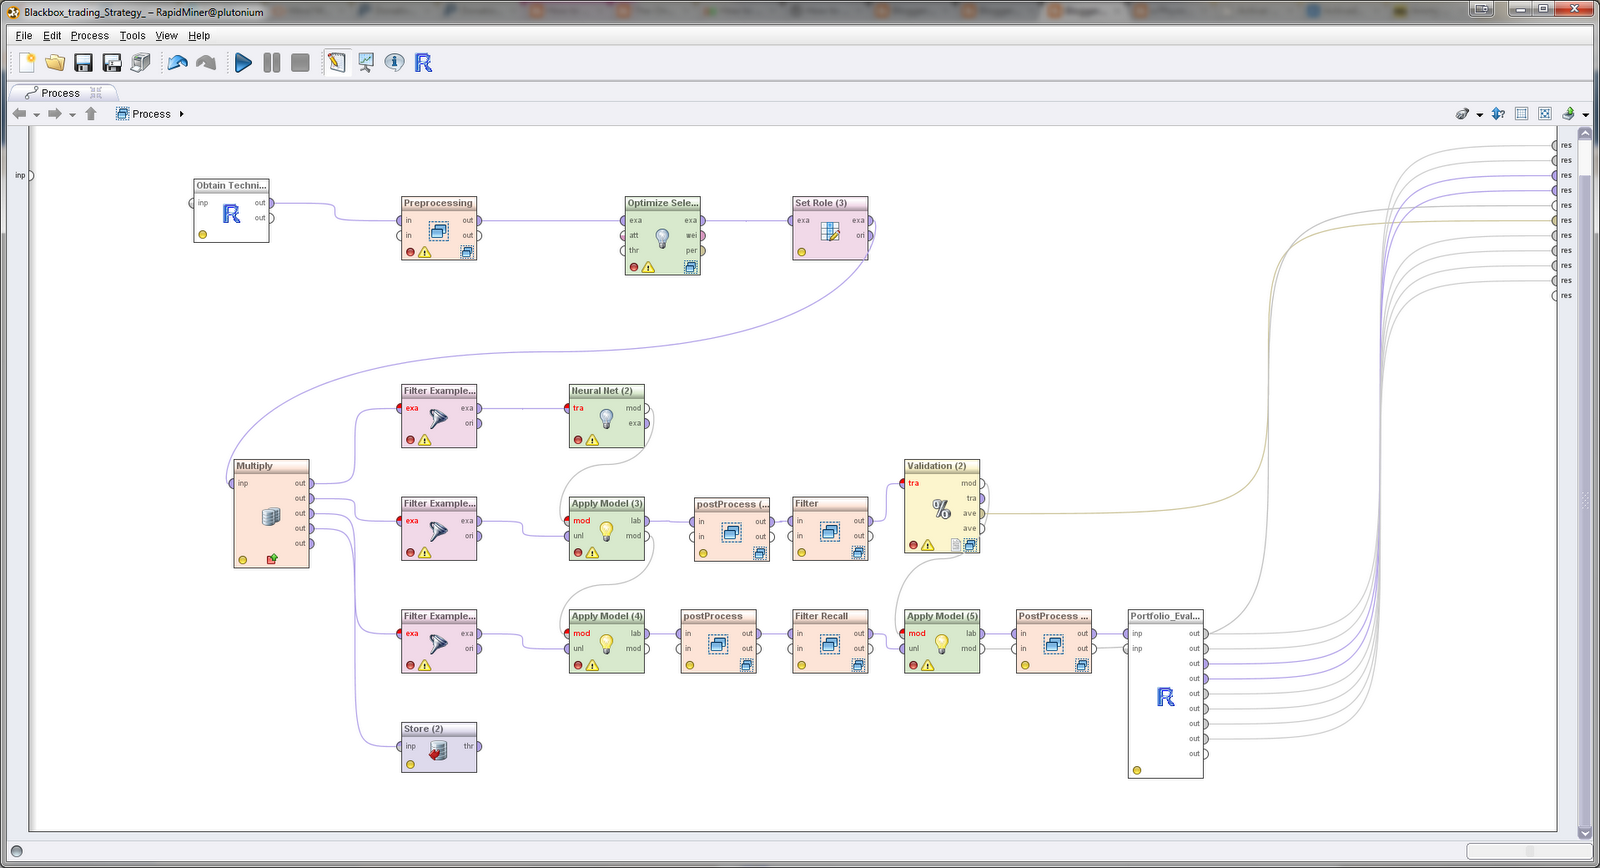
Blackbox trading Strategy using Rapidminer and R II

by a Physicist
Alexander Didenko

must read and replicate


Long time without updating the blog for lack of time (again) due to new professional and personal challenges. Continuing with the strategy of Black Box, thanks to recommendations made by several readers and the lack of time to make a good tutorial of the model, I’m going to make available the file with a new version expecting new interesting and rewarding comments in order to improve the model. Actually the main problems in the strategy (commented by the users) are:

  • -          The overlapping between test, and evaluation, (solution, avoid this overlapping reduce test time)
  • -          The function maximization is based on profits (other possibilities are possible, working on it)
  • -          Risk management (related)
  • -          You cannot  select in an easy way the stock name (working on it)
  • -          No portfolio management
  • -          Low success in the prediction.

The archive can be downloaded free in this link. Please send me your comments, your modifications and suggestion …

Publicar entrada
07 Jun 04:40

5 Interesting Free Books for R from beginner to experts

by a Physicist
Always new software language in one technical activity is difficult, normally a good documentation can help, these are three book to use R software for beginner and for experts:
·         “Introduction to the R Project for Statistical Computing for Use at the ITC by David Rossiter (PDF, 2010-11-21).

·         “R for Beginners” by Emmanuel Paradis (PDF,10 pages).

·         A Little Book of R for Multivariate Analysis (pdf, 49 pages) is a simple introduction to multivariate analysis using the R statistics software. It covers topics such as reading and plotting multivariate data, principal components analysis, and linear discriminant analysis.

·         A Little Book of R for Biomedical Statistics (pdf, 33 pages) is a simple introduction to biomedical statistics using the R statistics software, with sections on relative risks and odds ratios, dose-response analysis, clinical trial design and meta-analysis.

·         A Little Book of R for Time Series (pdf, 71 pages) is a simple introduction to time series analysis using the R statistics software (have you spotted the pattern yet?). It includes instruction on how to read and plot time series, time series decomposition, forecasting, and ARIMA models.

All books are free to use, share and remix under a Creative Commons license, and are available:
UPDATE: I updated the title, that's only five free books that I think interesting for R, Also there is another one that I forgot  Matlab for R programmer  I used Matlab from university till now (for me is always easier Matlab, but it is not free), both languages are similar but you always need a help (small tips).
via: Revolutions
07 Jun 04:39

How Pro-Poor Growth Affects the Demand for Energy

by Paul Gertler, Orie Shelef, Catherine Wolfram, Alan Fuchs
Most of the future growth in energy use is forecast to come from the developing world. Understanding the likely pace and specific location of this growth is essential to inform decisions about energy infrastructure investments and to improve greenhouse gas emissions forecasts. We argue that countries with pro-poor economic growth will experience larger increases in energy demand than countries where growth is more regressive. When poor households’ incomes go up, their energy demand increases along the extensive margin as they buy energy-using assets for the first time. We also argue that the speed at which households come out of poverty affects their asset purchase decisions. We provide empirical support for these hypotheses by examining the causal impact of increases in household income on asset accumulation and energy use in the context of Mexico’s conditional cash transfer program. We find that transfers had a large effect on asset accumulation among the low-income program beneficiaries, and the effect is greater when the cash is transferred over a shorter time period. We apply lessons from the household analysis to aggregate energy forecast models using country-level panel data. Our results suggest that existing forecasts could grossly underestimate future energy use in the developing world.
07 Jun 04:39

'Lucas' In The Laboratory

by Elena Asparouhova, Peter Bossaerts, Nilanjan Roy, William Zame
This paper reports on experimental tests of an instantiation of the Lucas asset pricing model with heterogeneous agents and time-varying private income streams. Central features of the model (infinite horizon, perishability of consumption, stationarity) present difficult challenges and require a novel experimental design. The experimental evidence provides broad support for the qualitative pricing and consumption predictions of the model (prices move with fundamentals, agents smooth consumption) but sharp differences from the quantitative predictions emerge (asset prices display excess volatility, agents do not hedge price risk). Generalized Method of Moments (GMM) tests of the stochastic Euler equations yield very different conclusions depending on the instruments chosen. It is suggested that the qualitative agreement with and quantitative deviation from theoretical predictions arise from agents' expectations about future prices, which are almost self-fulfilling and yet very different from what they would need to be if they were exactly self-fulfilling (as the Lucas model requires).
07 Jun 04:38

Has the Basel II Accord Encouraged Risk Management During the 2008-09 Financial Crisis?

by Michael McAleer, Juan-Angel Jimenez-Martin, Teodosio Pérez-Amaral
Alexander Didenko

использовать как референс для ROBES

The Basel II Accord requires that banks and other Authorized Deposit-taking Institutions (ADIs) communicate their daily risk forecasts to the appropriate monetary authorities at the beginning of each trading day, using one or more risk models to measure Value-at-Risk (VaR). The risk estimates of these models are used to determine capital requirements and associated capital costs of ADIs, depending in part on the number of previous violations, whereby realised losses exceed the estimated VaR. In this paper we define risk management in terms of choosing sensibly from a variety of risk models, discuss the selection of optimal risk models, consider combining alternative risk models, discuss the choice between a conservative and aggressive risk management strategy, and evaluate the effects of the Basel II Accord on risk management. We also examine how risk management strategies performed during the 2008-09 financial crisis, evaluate how the financial crisis affected risk management practices, forecasting VaR and daily capital charges, and discuss alternative policy recommendations, especially in light of the financial crisis. These issues are illustrated using Standard and Poor’s 500 Index, with an emphasis on how risk management practices were monitored and encouraged by the Basel II Accord regulations during the financial crisis.
07 Jun 04:37

Exchange Rate Predictability and a Monetary Model with Time-varying Cointegration Coefficients

by Cheolbeom Park, Sookyung Park
Many studies have pointed out that the underlying relations and functions for the monetary model (e.g. the PPP relation, the money demand function, monetary policy rule, etc.) have undergone parameter instabilities and that the relation between exchange rates and macro fundamentals are unstable due to the shift in the economic models in foreign exchange traders¡¯ views or the scapegoat effect in Bacchetta and van Wincoop (2009). Facing this, we consider a monetary model with time-varying cointegration coefficients in order to understand exchange rate movements. We provide statistical evidence against the standard monetary model with constant cointegration coefficients but find favorable evidence for the time-varying cointegration relationship between exchange rates and monetary fundamentals. Furthermore, we demonstrate that deviations between the exchange rate and fundamentals from the time-varying cointegration relation have strong predictive power for future changes in exchange rates through in-sample analysis, out-of-sample analysis, and directional accuracy tests.
07 Jun 04:37

Worldwide equity Risk Prediction

by David Ardia, Lennart F. Hoogerheide
Various GARCH models are applied to daily returns of more than 1200 constituents of major stock indices worldwide. The value-at-risk forecast performance is investigated for different markets and industries, considering the test for correct conditional coverage using the false discovery rate (FDR) methodology. For most of the markets and industries we find the same two conclusions. First, an asymmetric GARCH specification is essential when forecasting the 95% value-at-risk. Second, for both the 95% and 99% value-at-risk it is crucial that the innovations’ distribution is fat-tailed (e.g., Student-t or – even better – a non-parametric kernel density estimate). Then we discuss two applications. First, we use normal Entropy Pooling to estimate a market distribution consistent with the CAPM equilibrium, which improves on the “implied returns” a-la-Black and Litterman (1990) and can be used as the starting point for portfolio construction. Second, we use normal Entropy Pooling to process ranking signals for alpha-generation.
07 Jun 04:36

Bayesian Forecasting with a Factor-Augmented Vector Autoregressive DSGE model

by Stelios D. Bekiros, Alessia Paccagnini
In this paper we employ advanced Bayesian methods in estimating dynamic stochastic general equilibrium (DSGE) models. Although policymakers and practitioners are particularly interested in DSGE models, these are typically too stylized to be taken directly to the data and often yield weak prediction results. Very recently, hybrid models have become popular for dealing with some of the DSGE model misspecifications. Major advances in Bayesian estimation methodology could allow these models to outperform well-known time series models and effectively deal with more complex real-world problems as richer sources of data become available. This study includes a comparative evaluation of the out-of-sample predictive performance of many different specifications of estimated DSGE models and various classes of VAR models, using datasets from the US economy. Simple and hybrid DSGE models are implemented, such as DSGE-VAR and tested against standard, Bayesian and Factor Augmented VARs. In this study we focus on a Factor Augmented DSGE model that is estimated using Bayesian approaches. The investigated period spans 1960:Q4 to 2010:Q4 for the real GDP, the harmonized CPI and the nominal short-term interest rate. We produce their forecasts for the out-of-sample testing period 1997:Q1-2010:Q4. This comparative validation can be useful to monetary policy analysis and macro-forecasting with the use of advanced Bayesian methods.
07 Jun 04:36

Hypothesis Assessment and Inequalities for Bayes Factors and Relative Belief Ratios

by (author unknown)
Zeynep Baskurt, and Michael Evans
07 Jun 03:54

Inflation fan charts, monetary policy and skew normal distribution

by Wojciech Charemza, Carlos Diaz Vela, Svetlana Makarova
Issues related to classification, interpretation and estimation of inflationary uncertainties are addressed in the context of their application for constructing probability forecasts of inflation. It is shown that confusions in defining uncertainties lead to potential misunderstandings of such forecasts. The principal source of such confusion is in ignoring the effect of feedback from the policy action undertaken on the basis of forecasts of inflation onto uncertainties. In order to resolve this problem a new class of skew normal distributions (weighted skew normal, WSN) have been proposed and its properties derived. It is shown that parameters of WSN distribution can be interpreted in relation to the monetary policy strength and symmetry. It has been fitted to empirical distributions of inflation multi-step forecast errors of inflation for 34 countries, alongside others distributions already existing in the literature. The estimation method applied is using the minimum distance criteria between the empirical and theoretical distributions. Results lead to some constructive conclusions regarding the strength and asymmetry of monetary policy and confirm the applicability of WSN to producing probabilistic forecasts of inflation.
07 Jun 03:49

Exchange Rate Predictability

by Barbara Rossi
The main goal of this article is to provide an answer to the question: “Does anything forecast exchange rates, and if so, which variables?†It is well known that exchange rate fluctuations are very difficult to predict using economic models, and that a random walk forecasts exchange rates better than any economic model (the Meese and Rogoff puzzle). However, the recent literature has identified a series of fundamentals/methodologies that claim to have resolved the puzzle. This article provides a critical review of the recent literature on exchange rate forecasting and illustrates the new methodologies and fundamentals that have been recently proposed in an up- to-date, thorough empirical analysis. Overall, our analysis of the literature and the data suggests that the answer to the question: "Are exchange rates predictable?" is, "It depends" –on the choice of predictor, forecast horizon, sample period, model, and forecast evaluation method. Predictability is most apparent when one or more of the following hold: the predictors are Taylor rule or net foreign assets, the model is linear, and a small number of parameters are estimated. The toughest benchmark is the random walk without drift.
07 Jun 03:49

Forecast Evaluations for Multiple Time Series: A Generalized Theil Decomposition

by Wolfgang Polasek
The mean square error (MSE) compares point forecasts or a location parameter of the forecasting distribution with actual observations by the quadratic loss criterion. This paper shows how the Theil decomposition of the MSE error into a bias, variance and noise component which was proposed for univariate time series can be used to evaluate and compare multiple time series forecasts. Thus, for multivariate time series the ordinary and the alternative Theil decomposition is applied to decompose the MSE matrix. As an alternative we propose the average predictive ordinate criterion (APOC) which evaluates the ordinates of the predictive distribution for comparing forecasts of volatile time series. The multivariate Theil decomposition for the MSE and APOC criterion is used to compare and evaluate 3-dimensional VAR-GARCH-M time series forecasts for stock indices and exchange rates.
07 Jun 03:44

Evaluating Predictive Densities of U.S. Output Growth and Inflation in a Large Macroeconomic Data Set

by Barbara Rossi, Tatevik Sehkposyan
We evaluate conditional predictive densities for U.S. output growth and inflation using a number of commonly used forecasting models that rely on a large number of macroeconomic predictors. More specifically, we evaluate how well conditional predictive densities based on the commonly used normality assumption fit actual realizations out-of-sample. Our focus on predictive densities acknowledges the possibility that, although some predictors can improve or deteriorate point forecasts, they might have the opposite effect on higher moments. We find that normality is rejected for most models in some dimension according to at least one of the tests we use. Interestingly, however, combinations of predictive densities appear to be correctly approximated by a normal density: the simple, equal average when predicting output growth and Bayesian model average when predicting inflation.
07 Jun 03:41

A bootstrap test for additive outliers in non-stationary time series

by Sam Astill, David I. Harvey, A. M. Robert Taylor

In this paper we propose a new procedure for detecting additive outliers in a univariate time series based on a bootstrap implementation of the test of Perron and Rodríguez (, Journal of Time Series Analysis 24, 193-220). This procedure is used to test the null hypothesis that a time series is uncontaminated by additive outliers against the alternative that one or more additive outliers are present. We demonstrate that the existing tests of, inter alia, Vogelsang (, Journal of Time Series Analysis 20, 237–52) Perron and Rodríguez () and Burridge and Taylor (, Journal of Time Series Analysis 27, 685–701) are unable to strike a balance between size and power when the order of integration of a time series is unknown and the time series is driven by innovations drawn from an unknown distribution. We show that the proposed bootstrap testing procedure is able to control size to such an extent that its size properties are comparable with the robust test of Burridge and Taylor () when the distribution of the innovations is not assumed known, whilst maintaining power in the Gaussian environment close to that of the test of Perron and Rodríguez ().

07 Jun 03:39

DISENTANGLING DEMAND AND SUPPLY SHOCKS IN THE CRUDE OIL MARKET: HOW TO CHECK SIGN RESTRICTIONS IN STRUCTURAL VARS

by Helmut Lütkepohl, Aleksei NetŠunajev

SUMMARY

Sign restrictions have become increasingly popular for identifying shocks in structural vector autoregressive (SVAR) models. So far there are no techniques for validating the shocks identified via such restrictions. Although in an ideal setting the sign restrictions specify shocks of interest, sign restrictions may be invalidated by measurement errors, data adjustments or omitted variables. We model changes in the volatility of the shocks via a Markov switching (MS) mechanism and use this device to give the data a chance to object to sign restrictions. The approach is illustrated by considering a small model for the market of crude oil. Earlier findings that oil supply shocks explain only a very small fraction of movements in the price of oil are confirmed and it is found that the importance of aggregate demand shocks for oil price movements has declined since the mid 1980s. Copyright © 2013 John Wiley & Sons, Ltd.

07 Jun 03:37

STRATEGIC ASSET ALLOCATION FOR LONG-TERM INVESTORS: PARAMETER UNCERTAINTY AND PRIOR INFORMATION

by Roy P. P. M. Hoevenaars, Roderick D. J. Molenaar, Peter C. Schotman, Tom B. M. Steenkamp

SUMMARY

We study the effect of parameter uncertainty on the long-run risk for three asset classes: stocks, bills and bonds. Using a Bayesian vector autoregression with an uninformative prior we find that parameter uncertainty raises the annualized long-run volatilities of all three asset classes proportionally with the same factor relative to volatilities that are conditional on maximum likelihood parameter estimates. As a result, the horizon effect in optimal asset allocations is much weaker compared to models in which only equity returns are subject to parameter uncertainty. Results are sensitive to alternative informative priors, but generally the term structure of risk for stocks and bonds is relatively flat for investment horizons up to 15 years. Copyright © 2013 John Wiley & Sons, Ltd.

07 Jun 03:36

Quantile Double AR Time Series Models for Financial Returns

by Yuzhi Cai, Gabriel Montes-Rojas, Jose Olmo

ABSTRACT

We develop a novel quantile double autoregressive model for modelling financial time series. This is done by specifying a generalized lambda distribution to the quantile function of the location-scale double autoregressive model developed by Ling (2004, 2007). Parameter estimation uses Markov chain Monte Carlo Bayesian methods. A simulation technique is introduced for forecasting the conditional distribution of financial returns m periods ahead, and hence any for predictive quantities of interest. The application to forecasting value-at-risk at different time horizons and coverage probabilities for Dow Jones Industrial Average shows that our method works very well in practice. Copyright © 2013 John Wiley & Sons, Ltd.