Shared posts

15 Jun 22:23

NIH Preprint Pilot Launched

On June 9, 2020, NLM launched the NIH Preprint Pilot. During the pilot, NLM will make preprints resulting from research funded by the National Institutes of Health (NIH) available via PubMed Central (PMC) and, by extension, PubMed. The pilot aims to explore approaches to increasing the discoverability of early NIH research results. The pilot will run for a minimum of 12 months. Lessons learned during that time will inform future NLM efforts with preprints.

To learn more about the pilot, see:

To find preprints in PMC, you can search: preprint[filter]. You can exclude preprints from search results by using the Boolean NOT, e.g., covid-19 NOT preprint[filter]. For additional information on filtering preprints in PMC and PubMed see the FAQ.

Regular updates on the pilot status will be posted to the NLM Technical Bulletin. We encourage you to send your feedback to pmc-preprints@ncbi.nlm.nih.gov.

02 Mar 05:42

Down-to-Earth Introductions to Systems Thinking: A Few Favorites

by lbs

I’m constantly on the look out for down-to-earth introductions to systems thinking.  Recently, I had a chance to work with David Macaulay (of “How Things Work”) and the Donella Meadows Institute to create a short introduction to systems video for folks we think of as young change-makers — high school and college students and people in their first job —  really anyone who wants to understand and transform systems.Screen Shot 2016-02-24 at 1.10.41 PM

If you’re an educator, consultant, manager, organizational leader or someone who uses systems thinking in your work, we invite you to GIVE US FEEDBACK on the video.  Really!  The video is a work-in-progress and is about 1/3 of an online learning initiative we hope to eventually offer these emerging leaders.

In my research for the “In a World of Systems” video, I was happy to discover a host of other  terrific introductions to systems thinking.    Here are a few of my favorites (in no particular order):

Beth Sawin:  What is a System?  Beth Sawin and Drew Jones are gifted teachers and master practitioners in the field of systems thinking.  Here Beth starts from the beginning with the question: What is a system?  And what is one system’s insight you can use right away.  This is the first of eleven videos with a particular focus on climate change but equally effective with other complex challenges.  To see the other videos, enroll here.

Chris Soderquist: This is a wonderful introduction to applied systems thinking, using a healthcare example. Stock and flows center stage!

Donella Meadows:  The matriarch+ of applied systems thinking and system dynamics. Here is an inspirational piece from her 1994 talk “Down to Earth” about systems and sustainability.

Linda Booth Sweeney:  I had a lot of fun shooting this one  — What are systems? — for a systems literacy collection I developed with PBS Learning Media. Short and sweet!  Scroll through the collection for introductory systems thinking modules for teachers and students (grades 9-12).

Peter Senge (About 2 minutes):   A brief, compelling introduction from Peter, one of the founders of the field.

Russ Ackoff:   Wharton professor, organizational theorist and systems thinker – probably the best, most thoughtful (and funniest) thought leader on the subject of systems thinking.  He passed away before TED talks became popular but if he had lived, these two talks here and here — would have been run-away hits.

BEE environmental communication. A Systems Story: a simple, compelling explanation of a systems approach. Excellent for viewers of all ages.

Ecotipping Points Projects:  This is a real treasure trove of case studies that focus on positive, systemic change, written by talented journalists.  Look at any of the resources but here’s a good place to start:. Watch this video about Apo Island. Then read about the “ingredients” to success here.

Complexity Academy:  a comprehensive, diverse and refreshingly global collection of systems/complexity

Ken Webster (head of innovation, Ellen MacArthur Foundation): Here is a brilliant rationale for systems thinking education to support the growth of circular economies. For more on systems thinking + circular economy, see my recent blog post.

Creative Learning Exchange and The Waters Foundation:  Both organizations offer web-ed tutorials focused on systems thinking for educators.  You can also look here at a collection of the Creative Learning Exchange videos

Finally, it’s hard to keep a lid on my excitement about Nicky Case and his innovative work.  To start, check out his Simulating the World with Emojis. Then keep clicking!

This is just a partial list.  There are of course many more.  If you have your own favorites (especially more from outside the U.S.), I’d love to hear from you.

Screen Shot 2016-02-24 at 1.11.39 PM

Living in a World of Systems

Dana Meadows Down to Earth -- 1994

Dana Meadows Down to Earth — 1994

Student Module - PBS Learning Media

Student Module – PBS Learning Media

Complexity Academy

Complexity Academy

Simulating the World (in Emoji) – Nicky Case

25 Jan 00:56

Introducing Kaggle Datasets [No Data Feudalism Here]

by Patrick Durusau

Introducing Kaggle Datasets

From the post:

At Kaggle, we want to help the world learn from data. This sounds bold and grandiose, but the biggest barriers to this are incredibly simple. It’s tough to access data. It’s tough to understand what’s in the data once you access it. We want to change this. That’s why we’ve created a home for high quality public datasets, Kaggle Datasets.

Kaggle Datasets has four core components:

  • Access: simple, consistent access to the data with clear licensing
  • Analysis: a way to explore the data without downloading it
  • Results: visibility to the previous work that’s been created on the data
  • Conversation: forums and comments for discussing the nuances of the data

Are you interested in publishing one of your datasets on kaggle.com/datasets? Submit a sample here.

Unlike some medievalists who publish in the New England Journal of Medicine, Kaggle not only makes the data sets freely available, but offers tools to help you along.

Kaggle will also assist you in making your datasets available as well.

25 Jan 00:54

A Practical Guide to Graph Databases

by Patrick Durusau

A Practical Guide to Graph Databases by Matthias Broecheler.

Slides from Graph Day 2016 @ Austin.

If you notice any of the “trash talking” on social media about graphs and graph databases, you will find slide 15 quite amusing.

Not everyone agrees on the relative position of graph products. ;-)

I haven’t seen a video of Matthias’ presentation. If you happen across one, give me a ping. Thanks!

25 Jan 00:39

Clojure Distilled

by Patrick Durusau

Clojure Distilled by Dmitri Sotnikov.

From the post:

The difficulty in learning Clojure does not stem from its syntax, which happens to be extremely simple, but from having to learn new methods for solving problems. As such, we’ll focus on understanding the core concepts and how they can be combined to solve problems the functional way.

All the mainstream languages belong to the same family. Once you learn one of these languages there is very little effort involved in learning another. Generally, all you have to do is learn some syntax sugar and the useful functions in the standard library to become productive. There might be a new concept here and there, but most of your existing skills are easily transferable.

This is not the case with Clojure. Being a Lisp dialect, it comes from a different family of languages and requires learning new concepts in order to use effectively. There is no reason to be discouraged if the code appears hard to read at first. I assure you that the syntax is not inherently difficult to understand, and that with a bit of practice you might find it to be quite the opposite.

The goal of this guide is to provide an overview of the core concepts necessary to become productive with Clojure. Let’s start by examining some of the key advantages of the functional style and why you would want to learn a functional language in the first place.

Dmitri says near the end, “…we only touched on only a small portion of the overall language…,” but it is an impressive “…small portion…” and is very likely to leave you wanting to hear more.

The potential for immutable data structures in collaborative environments is vast. I’ll have something longer to post on that next week.

Enjoy!

25 Jan 00:37

Street-Fighting Mathematics – Free Book – Lesson For Semanticists?

by Patrick Durusau

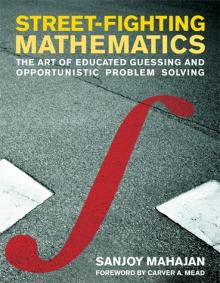
Street-Fighting Mathematics: The Art of Educated Guessing and Opportunistic Problem Solving by Sanjoy Mahajan.

From the webpage:

street-fighting

In problem solving, as in street fighting, rules are for fools: do whatever works—don’t just stand there! Yet we often fear an unjustified leap even though it may land us on a correct result. Traditional mathematics teaching is largely about solving exactly stated problems exactly, yet life often hands us partly defined problems needing only moderately accurate solutions. This engaging book is an antidote to the rigor mortis brought on by too much mathematical rigor, teaching us how to guess answers without needing a proof or an exact calculation.

In Street-Fighting Mathematics, Sanjoy Mahajan builds, sharpens, and demonstrates tools for educated guessing and down-and-dirty, opportunistic problem solving across diverse fields of knowledge—from mathematics to management. Mahajan describes six tools: dimensional analysis, easy cases, lumping, picture proofs, successive approximation, and reasoning by analogy. Illustrating each tool with numerous examples, he carefully separates the tool—the general principle—from the particular application so that the reader can most easily grasp the tool itself to use on problems of particular interest. Street-Fighting Mathematics grew out of a short course taught by the author at MIT for students ranging from first-year undergraduates to graduate students ready for careers in physics, mathematics, management, electrical engineering, computer science, and biology. They benefited from an approach that avoided rigor and taught them how to use mathematics to solve real problems.

I have just started reading Street-Fighting Mathematics but I wonder if there is a parallel between mathematics and the semantics that everyone talks about capturing from information systems.

Consider this line:

Traditional mathematics teaching is largely about solving exactly stated problems exactly, yet life often hands us partly defined problems needing only moderately accurate solutions.

And re-cast it for semantics:

Traditional semantics (Peirce, FOL, SUMO, RDF) is largely about solving exactly stated problems exactly, yet life often hands us partly defined problems needing only moderately accurate solutions.

What if the semantics we capture and apply are sufficient for your use case? Complete with ROI for that use case.

Is that sufficient?

25 Jan 00:34

Awesome Deep Learning – Value-Add Curation?

by Patrick Durusau

Awesome Deep Learning by Christos Christofidis.

Tweeted by Gregory Piatetsky as:

Awesome Curated #DeepLearning resources on #GitHub: books, courses, lectures, researchers…

What will you find there? (As of 28 December 2015):

  • Courses – 15
  • Datasets – 114
  • Free Online Books – 8
  • Frameworks – 35
  • Miscellaneous – 26
  • Papers – 32
  • Researchers – 96
  • Tutorials – 13
  • Videos and Lectures – 16
  • Websites – 24

By my count, that’s 359 resources.

We know from detailed analysis of PubMed search logs, that 80% of searchers choose a link from the first twenty “hits” returned for a search.

You could assume that out of “23 million user sessions and more than 58 million user queries” PubMed searchers and/or PubMed itself or both transcend the accuracy of searching observed in other contexts. That seems rather unlikely.

The authors note:


Two interesting phenomena are observed: first, the number of clicks for the documents in the later pages degrades exponentially (Figure 8). Second, PubMed users are more likely to click the first and last returned citation of each result page (Figure 9). This suggests that rather than simply following the retrieval order of PubMed, users are influenced by the results page format when selecting returned citations.

Result page format seems like a poor basis for choosing search results, in addition to being in the top twenty (20) results.

Eliminating all the cruft from search results to give you 359 resources is a value-add, but what value-add should added to this list of resources?

What are the top five (5) value-adds on your list?

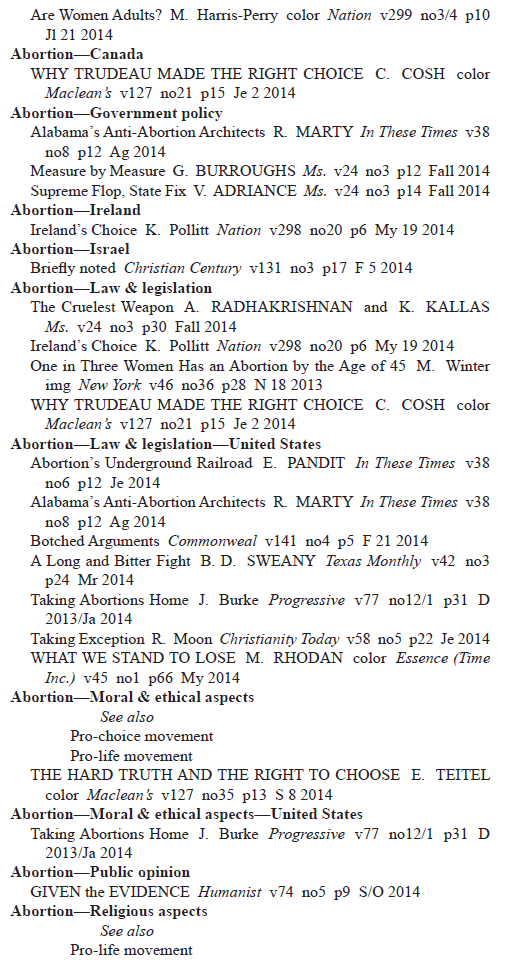
Serious question because we have tools far beyond what were available to curators in the 1960’s but there is little (if any) curation to match of the Reader’s Guide to Periodical Literature.

There are sample pages from the 2014 Reader’s Guide to Periodical Literature online.

Here is a screen-shot of some of its contents:

readers-guide-abortion

If you can, tell me what search you would use to return that sort of result for “abortion” as a subject.

Nothing come to mind?

Just to get you started, would pointing to algorithms across these 359 resources be helpful? Would you want to know more than algorithm N occurs in resource Y? Some of the more popular ones may occur in every resource. How helpful is that?

So I repeat my earlier question:

What are the top five (5) value-adds on your list?

Please forward, repost, reblog, tweet. Thanks!

25 Jan 00:33

‘Picard and Dathon at El-Adrel’

by Patrick Durusau

Machines, Lost In Translation: The Dream Of Universal Understanding by Anne Li.

From the post:

It was early 1954 when computer scientists, for the first time, publicly revealed a machine that could translate between human languages. It became known as the Georgetown-IBM experiment: an “electronic brain” that translated sentences from Russian into English.

The scientists believed a universal translator, once developed, would not only give Americans a security edge over the Soviets but also promote world peace by eliminating language barriers.

They also believed this kind of progress was just around the corner: Leon Dostert, the Georgetown language scholar who initiated the collaboration with IBM founder Thomas Watson, suggested that people might be able to use electronic translators to bridge several languages within five years, or even less.

The process proved far slower. (So slow, in fact, that about a decade later, funders of the research launched an investigation into its lack of progress.) And more than 60 years later, a true real-time universal translator — a la C-3PO from Star Wars or the Babel Fish from The Hitchhiker’s Guide to the Galaxy — is still the stuff of science fiction.

How far are we from one, really? Expert opinions vary. As with so many other areas of machine learning, it depends on how quickly computers can be trained to emulate human thinking.

The Star Trek Next Generation episode Darmok was set during a five-year mission that began in 2364, some 349 years in our future. Faster than light travel, teleportation, etc. are day to day realities. One expects machine translation to have improved at least as much.

As Li reports exciting progress is being made with neural networks for translation but transposing words from one language to another, as illustrated in Darmok, isn’t a guarantee of “universal understanding.”

In fact, the transposition may be as opaque as the statement in its original language, such as “Darmok and Jalad at Tanagra,” leaves the hearer to wonder what happened at Tanagra, what was the relationship between Darmok and Jalad, etc.

In the early lines of The Story of the Shipwrecked Sailor, a Middle Kingdom (Egypt, 2000 BCE – 1700 BCE) story, there is a line that describes the sailor returning home and words to the effect “…we struck….” Then the next sentence picks up.

The words necessary to complete that statement don’t occur in the text. You have to know that mooring boats on the Nile did not involve piers, etc. but simply banking your boat and then driving a post (the unstated subject of “we struck”) to secure the vessel.

Transposition from Middle Egyptian to English leaves you without a clue as to the meaning of that passage.

To be sure, neural networks may clear away some of the rote work of transposition between languages but that is a far cry from “universal understanding.”

Both now and likely to continue into the 24th century.

25 Jan 00:31

Regular Expression Crossword Puzzle

by Patrick Durusau

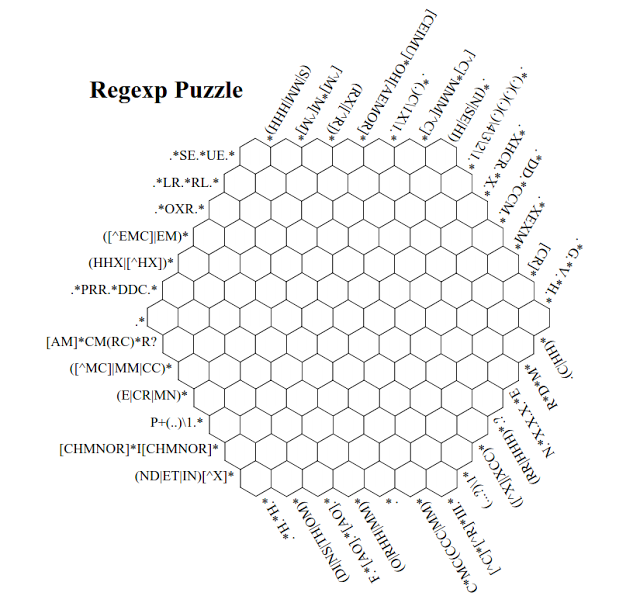
Regular Expression Crossword Puzzle by Greg Grothaus.

From the post:

If you know regular expressions, you might find this to be geek fun. A friend of mine posted this, without a solution, but once I started working it, it seemed put together well enough it was likely solvable. Eventually I did solve it, but not before coding up a web interface for verifying my solution and rotating the puzzle in the browser, which I recommend using if you are going to try this out. Or just print it out.

It’s actually quite impressive of a puzzle in it’s own right. It must have taken a lot of work to create.

regexpuzzle

The image is a link to the interactive version with the rules.

Other regex crossword puzzle resources:

RegHex – An alternative web interface to help solve the MIT hexagonal regular expression puzzle.

Regex Cross­word – Starting with a tutorial, the site offers 9 levels/types of games, concluding with five (5) hexagonal ones (only a few blocks on the first one and increasingly complex).

Regex Crosswords by Nikola Terziev – Generates regex crosswords, only squares at the moment.

In case you need help with some of the regex puzzles, you can try: Awesome Regex – A collection of regex resources.

If you are really adventuresome, try Constraint Reasoning Over Strings (2003) by Keith Golden and Wanlin Pang.

Abstract:

This paper discusses an approach to representing and reasoning about constraints over strings. We discuss how many string domains can often be concisely represented using regular languages, and how constraints over strings, and domain operations on sets of strings, can be carried out using this representation.

Each regex clue you add is a constraint on all the intersecting cells. Your first regex clue is unbounded, but every clue after that has a constraint. Wait, that’s not right! Constraints arise only when cells governed by different regexes intersect.

Anyone interested in going beyond hexagons and/or 2 dimensions?

I first saw this in a tweet by Alexis Lloyd.

25 Jan 00:02

10 Best Data Visualization Projects of 2015 [p-hacking]

by Patrick Durusau

10 Best Data Visualization Projects of 2015 by Nathan Yau.

From the post:

Fine visualization work was alive and well in 2015, and I’m sure we’re in for good stuff next year too. Projects sprouted up across many topics and applications, but if I had to choose one theme for the year, it’d have to be teaching, whether it be through explaining, simulations, or depth. At times it felt like visualization creators dared readers to understand data and statistics beyond what they were used to. I liked it.

These are my picks for the best of 2015. As usual, they could easily appear in a different order on a different day, and there are projects not on the list that were also excellent (that you can easily find in the archive).

Here we go.

As great selection but I would call your attention to Nathan’s Lessons in statistical significance, uncertainty, and their role in science.

It is a review of work on p-hacking, that is the manipulation of variables to get a low enough p-value to merit publication in a journal.

A fine counter to the notion that “truth” lies in data.

Nothing of the sort is the case. Data reports results based on the analysis applied to it. Nothing more or less.

What questions we ask of data, what data we choose as containing answers to those questions, what analysis we apply, how we interpret the results of our analysis, are all wide avenues for the introduction of unmeasured bias.

25 Jan 00:00

D3 Maps without the Dirty Work

by Patrick Durusau

D3 Maps without the Dirty Work by

From the post:

For those like me who aren’t approaching mapping in D3 with a GIS background in tow, you may find the propretary goe data structures hard to handle. Thankfully, Scott Murray lays out a simple process in his most recent course through JournalismCourses.org. By the time you are through reading this post you’ll have the guide post needed from mapping any of the data sets found on Natural Earths website in D3.

First in a series of posts on D3 rendering for maps. Layers of D3 renderings is coming up next.

Enjoy!

24 Jan 23:55

Clojure Design Patterns

by Patrick Durusau

Clojure Design Patterns by Mykhailo Kozik (Misha).

From the webpage:

Quick overview of the classic Design Patterns in Clojure.

Disclaimer: Most patterns are easy to implement because we use dynamic typing, functional programming and, of course, Clojure. Some of them look wrong and ugly. It’s okay. All characters are fake, coincidences are accidental.

In many places this is the last weekend before Christmas, which means both men and women will have lots of down time waiting on others in shopping malls.

That is the one time when I could see a good-sized mobile device being useful, assuming the mall had good Wifi.

In case yours does and you have earplugs for the background music/noise, you may enjoy pulling this up to read.

I first saw this in a tweet by Atabey Kaygun.

24 Jan 23:49

20 Big Data Repositories You Should Check Out [Data Source Checking?]

by Patrick Durusau

20 Big Data Repositories You Should Check Out by Vincent Granville.

Vincent lists some additional sources along with a link to Bernard Marr’s original selection.

One of the issues with such lists is that they are rarely maintained.

For example, Bernard listed:

Topsy http://topsy.com/

Free, comprehensive social media data is hard to come by – after all their data is what generates profits for the big players (Facebook, Twitter etc) so they don’t want to give it away. However Topsy provides a searchable database of public tweets going back to 2006 as well as several tools to analyze the conversations.

But if you follow http://topsy.com/, you will find it points to:

Use Search on your iPhone, iPad, or iPod touch

With iOS 9, Search lets you look for content from the web, your contacts, apps, nearby places, and more. Powered by Siri, Search offers suggestions and updates results as you type.

That sucks doesn’t it? Expecting to be able to search public tweets back to 2006, along with analytical tools and what you get is a kiddie guide to search on a malware honeypot.

For a fuller explanation or at least the latest news on Topsy, check out: Apple shuts down Twitter analytics service Topsy by Sam Byford, dated December 16, 2015 (that’s today as I write this post).

So, strike Topsy off your list of big data sources.

Rather than bare lists, what big data needs is a curated list of big data sources that does more than list sources. Those sources need to be broken down to data sets to enable big data searchers to find all the relevant data sets and retrieve only those that remain accessible.

Like “link checking” but for big data resources. Data Source Checking?

That would be the “go to” place for big data sets and as bad as I hate advertising, a high traffic area for advertising to make it cost effective if not profitable.

24 Jan 23:48

Readings in Database Systems, 5th Edition (Kindle Stuffer)

by Patrick Durusau

Readings in Database Systems, 5th Edition, Peter Bailis, Joseph M. Hellerstein, Michael Stonebraker, editors.

From the webpage:

  1. Preface [HTML] [PDF]
  2. Background introduced by Michael Stonebraker [HTML] [PDF]
  3. Traditional RDBMS Systems introduced by Michael Stonebraker [HTML] [PDF]
  4. Techniques Everyone Should Know introduced by Peter Bailis [HTML] [PDF]
  5. New DBMS Architectures introduced by Michael Stonebraker [HTML] [PDF]
  6. Large-Scale Dataflow Engines introduced by Peter Bailis [HTML] [PDF]
  7. Weak Isolation and Distribution introduced by Peter Bailis [HTML] [PDF]
  8. Query Optimization introduced by Joe Hellerstein [HTML] [PDF]
  9. Interactive Analytics introduced by Joe Hellerstein [HTML] [PDF]
  10. Languages introduced by Joe Hellerstein [HTML] [PDF]
  11. Web Data introduced by Peter Bailis [HTML] [PDF]
  12. A Biased Take on a Moving Target: Complex Analytics
    by Michael Stonebraker [HTML] [PDF]
  13. A Biased Take on a Moving Target: Data Integration
    by Michael Stonebraker [HTML] [PDF]

Complete Book: [HTML] [PDF]

Readings Only: [HTML] [PDF]

Previous Editions: [HTML]

Citations to the “reading” do not present themselves as hyperlinks but they are.

If you are giving someone a Kindle this Christmas, consider pre-loading Readings in Database Systems, along with the readings as a Kindle stuffer.

24 Jan 23:48

35 Lines XQuery versus 604 of XSLT: A List of W3C Recommendations

by Patrick Durusau

Use Case

You should be familiar with the W3C Bibliography Generator. You can insert one or more URLs and the generator produces correctly formatted citations for W3C work products.

It’s quite handy but requires a URL to produce a useful response. I need authors to use correctly formatted W3C citations and asking them to find URLs and to generate correct citations was a bridge too far. Simply didn’t happen.

My current attempt is to produce a list of correctly W3C citations in HTML. Authors can use CTRL-F in their browsers to find citations. (Time will tell if this is a successful approach or not.)

Goal: An HTML page of correctly formatted W3C Recommendations, sorted by title (ignoring case because W3C Recommendations are not consistent in their use of case in titles). “Correctly formatted” meaning that it matches the output from the W3C Bibliography Generator.

Resources

As a starting point, I viewed the source of http://www.w3.org/2002/01/tr-automation/tr-biblio.xsl, the XSLT script that generates the XHTML page with its responses.

The first XSLT script imports two more XSLT scripts, http://www.w3.org/2001/08/date-util.xslt and http://www.w3.org/2001/10/str-util.xsl.

I’m not going to reproduce the XSLT here, but can say that starting with <stylesheet> and ending with </stylesheet>, inclusive, I came up with 604 lines.

You will need to download the file used by the W3C Bibliography Generator, tr.rdf.

XQuery Script

I have used the XQuery script successfully with: BaseX 8.3, eXide 2.1.3 and SaxonHE-6-07J.

Here’s the prolog:

declare default element namespace "http://www.w3.org/2001/02pd/rec54#";
declare namespace rdf = "http://www.w3.org/1999/02/22-rdf-syntax-ns#";
declare namespace dc = "http://purl.org/dc/elements/1.1/"; 
declare namespace doc = "http://www.w3.org/2000/10/swap/pim/doc#";
declare namespace contact = "http://www.w3.org/2000/10/swap/pim/contact#";
declare namespace functx = "http://www.functx.com";
declare function functx:substring-after-last
($string as xs:string?, $delim as xs:string) as xs:string?
{
if (contains ($string, $delim))
then functx:substring-after-last(substring-after($string, $delim), $delim)
else $string
};

Declaring the namespaces and functx:substring-after-last from Patricia Walmsley’s excellent FunctX XQuery Functions site and in particular, functx:substring-after-last.

<html>
<head>XQuery Generated W3C Recommendation List</head>
<body>
<ul class="ul">

Start the HTML page and the unordered list that will contain the list items.

{
for $rec in doc("tr.rdf")//REC
    order by upper-case($rec/dc:title)

If you sort W3C Recommendations by dc:title and don’t specify upper-case, rdf:PlainLiteral: A Datatype for RDF Plain Literals,
rdf:PlainLiteral: A Datatype for RDF Plain Literals (Second Edition), and xml:id Version 1.0, appear at the end of the list sorted by title. Dirty data isn’t limited to databases.

return <li class="li">
  <a href="{string($rec/@rdf:about)}"> {string($rec/dc:title)} </a>, 
   { for $auth in $rec/editor
   return
   if (contains(string($auth/contact:fullName), "."))
   then (concat(string($auth/contact:fullName), ","))
   else (concat(concat(concat(substring(substring-before(string($auth/\
   contact:fullName), ' '), 0, 2), ". "), (substring-after(string\
   ($auth/contact:fullName), ' '))), ","))}

Watch for the line continuation marker “\”.

We begin by grabbing the URL and title for an entry and then confront dirty author data. The standard author listing by the W3C creates an initial plus a period for the author’s first name and then concatenates the rest of the author’s name to that initial plus period.

Problem: There is one entry for authors that already has initials, T.V. Raman, so I had to account for that one entry (as does the XSLT).

{if (count ($rec/editor) >= 2) then " Editors," else " Editor,"}
W3C Recommendation, 
{fn:format-date(xs:date(string($rec/dc:date)), "[MNn] [D], [Y]") }, 
{string($rec/@rdf:about)}. <a href="{string($rec/doc:versionOf/\
@rdf:resource)}">Latest version</a> \
available at {string($rec/doc:versionOf/@rdf:resource)}.
<br/>[Suggested label: <strong>{functx:substring-after-last(uppercase\
(replace(string($rec/doc:versionOf/@rdf:resource), '/$', '')), "/")}\
</strong>]<br/></li>} </ul></body></html>

Nothing remarkable here, except that I snipped the concluding “/” off of the values from doc:versionOf/@rdf:resource so I could use functx:substring-after-last to create the token for a suggested label.

Comments / Omissions

I depart from the XSLT in one case. It calls http://www.w3.org/2002/01/tr-automation/known-tr-editors.rdf here:

<!-- Special casing for when we have the name in Original Script (e.g. in \
Japanese); currently assume that the order is inversed in this case... -->

&lt:xsl:when test="document('http://www.w3.org/2002/01/tr-automation/\
known-tr-editors.rdf')/rdf:RDF/*[contact:lastNameInOriginalScript=\
substring-before(current(),' ')]">

But that refers to only one case:

<REC rdf:about="http://www.w3.org/TR/2003/REC-SVG11-20030114/">
<dc:date>2003-01-14</dc:date>
<dc:title>Scalable Vector Graphics (SVG) 1.1 Specification</dc:title>

Where Jun Fujisawa appears as an editor.

Recalling my criteria for “correctness” being the output of the W3C Bibliography Generator:

svg-cite-image

Preparing for this post made me discover at least one bug in the XSLT that was supposed to report the name in original script:

&lt:xsl:when test=”document(‘http://www.w3.org/2002/01/tr-automation/\
known-tr-editors.rdf’)/rdf:RDF/*[contact:lastNameInOriginalScript=\
substring-before(current(),’ ‘)]”>

Whereas the entry in http://www.w3.org/2002/01/tr-automation/known-tr-editors.rdf reads:

<rdf:Description>
<rdf:type rdf:resource=”http://www.w3.org/2000/10/swap/pim/contact#Person”/>
<firstName>Jun</firstName>
<firstNameInOriginalScript>藤沢 淳</firstNameInOriginalScript>
<lastName>Fujisawa</lastName>
<sortName>Fujisawa</sortName>
</rdf:Description>

Since the W3C Bibliography Generator doesn’t produce the name in original script, neither do I. When the W3C fixes its output, I will have to amend this script to pick up that entry.

String

While writing this query I found text(), fn:string() and fn:data() by Dave Cassels. Recommended reading. The weakness of text() is that if markup is inserted inside your target element after you write the query, you will get unexpected results. The use of fn:string() avoids that sort of surprise.

Recommendations Only

Unlike the W3C Bibliography Generator, my script as written only generates entries for Recommendations. It would be trivial to modify the script to include drafts, notes, etc., but I chose to not include material that should not be used as normative citations.

I can see the usefulness of the bibliography generator for works in progress but external to the W3C, citing Recommendations is the better course.

Contra Search

The SpecRef project has a searchable interface to all the W3C documents. If you search for XQuery, the interface returns 385 “hits.”

Contrast that with using CNTR-F with the list of recommendations generated from the XQuery script, controlling for case, XQuery produced only 23 “hits.”

There are reasons for using search, but users repeatedly mining results of searches that could be captured (it was called curation once upon a time) is wasteful.

Reading

I can’t recommend Patricia Walmsley’s XQuery 2nd Edition strongly enough.

There is one danger to Walmsley’s book. You will be so ready to start using XQuery after the first ten chapters it’s hard to find the time to read the remaining ones. Great stuff!

You can download the XQuery file, tr.rdf and the resulting html file at: 35LinesOfXQuery.zip.

24 Jan 23:43

Data Science Lessons [Why You Need To Practice Programming]

by Patrick Durusau

Data Science Lessons by Shantnu Tiwari.

Shantnu has authored several programming books using Python and has a series of videos (with more forthcoming) on doing data science with Python.

Shantnu had me when he used data from the Hubble Space telescope in his Introduction to Pandas with Practical examples.

The videos build one upon another and new users will appreciate that not very move is the correct one. ;-)

If I had to pick one video to share, of those presently available, it would be:

Why You Need To Practice Programming.

It’s not new advice but it certainly is advice that needs repeating.

This anecdote is told about Pablo Casals (world famous cellist):

When Casals (then age 93) was asked why he continued to practice the cello three hours a day, he replied, “I’m beginning to notice some improvement.”

What are you practicing three hours a day?

24 Jan 23:42

Data Science Learning Club

by Patrick Durusau

Data Science Learning Club by Renee Teate.

From the Hello and welcome message:

I’m Renee Teate, the host of the Becoming a Data Scientist Podcast, and I started this club so data science learners can work on projects together. Please browse the activities and see what we’re up to!

What is the Data Science Learning Club?

This learning club was created as part of the Becoming a Data Scientist Podcast [coming soon!]. Each episode, there is a “learning activity” announced. Anyone can come here to the club forum to get details and resources, participate in the activity, and share their results.

Participants can use any technology and any programming language to do the activities, though I expect most will use python or R. No one is “teaching” how to do the activity, we’ll just share resources and all do the activity during the same time period so we can help each other out if needed.

How do I participate?

Just register for a free account, and start learning!

If you’re joining in a “live” activity during the 2 weeks after a podcast episode airs (the original “assignment” period listed in the forum description), then you can expect others to be doing the activity at the same time and helping each other out. If you’re working through the activities from the beginning after the original assignment period is over, you can browse the existing posts for help and you can still post your results. If you have trouble, feel free to post a question, but you may not get a timely response if the activity isn’t the current one.

  • If you are brand new to data science, you may want to start at activity 00 and work your way through each activity with the help of the information in posts by people that did it before you. I plan to make them increase in difficulty as we go along, and they may build on one another. You may be able to skip some activities without missing out on much, and also if you finish more than 1 activity every 2 weeks, you will be going faster than new activities are posted and will catch up.
  • If you know enough to have done most of the prior activities on your own, you don’t have to start from the beginning. Join the current activity (latest one posted) with the “live” group and participate in the activity along with us.
  • If you are more advanced, please join in anyway! You can work through activities for practice and help out anyone that is struggling. Show off what you can do and write tutorials to share!

If you have challenges during the activity and overcome them on your own, please post about it and share what you did in case others come across the same challenges. Once you have success, please post about your experience and share your good results! If you write a post or tutorial on your own blog, write a brief summary and post a link to it, and I’ll check it out and promote the most helpful ones.

The only “dues” for being a member of the club are to participate in as many activities as possible, share as much of your work as you can, give constructive feedback to others, and help each other out as needed!

I look forward to this series of learning activities, and I’ll be participating along with you!

Renee’s Data Science Learning Club is due to go live on December 14, 2015!

With the various free courses, Stack Overflow and similar resources, it will be interesting to see how this develops.

Hopefully recurrent questions will develop into tutorials culled from discussions. That hasn’t happened with Stack Overflow, not that I am aware of, but perhaps it will happen here.

Stop by and see how the site develops!

24 Jan 23:39

d3.compose [Charts as Devices of Persuasion]

by Patrick Durusau

d3.compose

Another essential but low-level data science skill, data-driven visualizations!

From the webpage:

Composable

Create small and sharp charts/components that do one thing one well (e.g. Bars, Lines, Legend, Axis, etc.) and compose them to create complex visualizations.

d3.compose works great with your existing charts (even those from other libraries) and it is simple to extend/customize the built-in charts and components.

Automatic Layout

When creating complex charts with D3.js and d3.chart, laying out and sizing parts of the chart are often manual processes.
With d3.compose, this process is automatic:

  • Automatically size and position components
  • Layer components and charts by z-index
  • Responsive by default, with automatic scaling

Why d3.compose?

  • Customizable: d3.compose makes it easy to extend, layout, and refine charts/components
  • Reusable: By breaking down visualizations into focused charts and components, you can quickly reconfigure and reuse your code
  • Integrated: It’s straightforward to use your existing charts or charts from other libraries with d3.compose to create just the chart you’re looking for

Don’t ask me why but users/executives are impressed by even simple charts.

(shrugs) I have always assumed that people use charts to avoid revealing the underlying data and what they did to it before making the chart.

That’s not very charitable but I have never been disappointed in assuming either incompetence and/or malice in chart preparation.

People prepare charts because they are selling you a point of view. It may be a “truthful” point of view, at least in their minds but it is still an instrument of persuasion.

Use well-constructed charts to persuade others to your point of view and be on guard for the use of charts to persuade you. Both of those principles will serve you well as a data scientist.

24 Jan 23:38

Cleaning CSV Data… [Interview Questions?]

by Patrick Durusau

Cleaning CSV Data Using the Command Line and csvkit, Part 1 by Srini Kadamati.

From the post:

The Museum of Modern Art is one of the most influential museums in the world and they have released a dataset on the artworks in their collection. The dataset has some data quality issues, however, and requires cleanup.

In a previous post, we discussed how we used Python and Pandas to clean the dataset. In this post, we’ll learn about how to use the csvkit library to acquire and explore tabular data.

Why the command line?

Great question! When working in cloud data science environments, you sometimes only have access to a server’s shell. In these situations, proficiency with command line data science is a true superpower. As you become more proficient, using the command line for some data science tasks is much quicker than writing a Python script or a Hadoop job. Lastly, the command line has a rich ecosystem of tools and integration into the file system. This makes certain kinds of tasks, especially those involving multiple files, incredibly easy.

Some experience working in the command line is expected for this post. If you’re new to the command line, I recommend checking out our interactive command line course.

csvkit

csvkit is a library optimized for working with CSV files. It’s written in Python but the primary interface is the command line. You can install csvkit using pip:

pip install csvkit

You’ll need this library to follow along with this post.

If you want to be a successful data scientist, may I suggest you follow this series and similar posts on data cleaning techniques?

Reports vary but the general figure is 50% to 90% of the time of a data scientist is spent cleaning data. Report: Data scientists spend bulk of time cleaning up

Being able to clean data, the 50% to 90% of your future duties, may not get you past the data scientist interview.

There are several 100+ data scientist interview question sets that don’t have any questions about data cleaning.

Seriously, not a single question.

I won’t name names in order to protect the silly but can say that SAS does have one data cleaning question out of twenty. Err, that’s 5% for those of you comparing to the duties of a data scientist at 50% to 90%. Of course the others I reviewed, had 0% out of 50% to 90% so they were even worse.

Oh, the SAS question on data cleaning:

Give examples of data cleaning techniques you have used in the past.

You have to wonder about a data science employer who asks so many questions unrelated to the day to day duties of data scientists.

Maybe when asked some arcane question you can ask back:

An when in the last six (6) months has your average data scientist hire used that concept/technique?

It might not land you a job but do you really want to work at a firm that can’t apply data science to its own hiring process?

Data science employers, heal yourselves!

PS: I rather doubt most data science interviewers understand the epistemological assumptions behind most algorithms so you can memorize a bit of that for your interview.

Will convince them customers will believe your success is just short of divine intervention in their problem.

It’s an old but reliable technique.

24 Jan 23:19

XQuery, 2nd Edition, Updated! (A Drawback to XQuery)

by Patrick Durusau

XQuery, 2nd Edition, Updated! by Priscilla Walmsley.

The updated version of XQuery, 2nd Edition has hit the streets!

As a plug for the early release program at O’Reilly, yours truly appears in the acknowledgments (page xxii) from having submitted comments on the early release version of XQuery. You can too. Early release participation is yet another way to contribute back to the community.

There is one drawback to XQuery which I discuss below.

For anyone not fortunate enough to already have a copy of XQuery, 2nd Edition, here is the full description from the O’Reilly site:

The W3C XQuery 3.1 standard provides a tool to search, extract, and manipulate content, whether it’s in XML, JSON or plain text. With this fully updated, in-depth tutorial, you’ll learn to program with this highly practical query language.

Designed for query writers who have some knowledge of XML basics, but not necessarily advanced knowledge of XML-related technologies, this book is ideal as both a tutorial and a reference. You’ll find background information for namespaces, schemas, built-in types, and regular expressions that are relevant to writing XML queries.

This second edition provides:

  • A high-level overview and quick tour of XQuery
  • New chapters on higher-order functions, maps, arrays, and JSON
  • A carefully paced tutorial that teaches XQuery without being bogged down by the details
  • Advanced concepts for taking advantage of modularity, namespaces, typing, and schemas
  • Guidelines for working with specific types of data, such as numbers, strings, dates, URIs, maps and arrays
  • XQuery’s implementation-specific features and its relationship to other standards including SQL and XSLT
  • A complete alphabetical reference to the built-in functions, types, and error messages

Drawback to XQuery:

You know I hate to complain, but the brevity of XQuery is a real drawback to billing.

For example, I have a post pending on taking 604 lines of XSLT down to 35 lines of XQuery.

Granted the XQuery is easier to maintain, modify, extend, but all a client will see is the 35 lines of XQuery. At least 604 lines of XSLT looks like you really worked to produce something.

I know about XQueryX but I haven’t seen any automatic way to convert XQuery into XQueryX. Am I missing something obvious? If that’s possible, I could just bulk up the deliverable with an XQueryX expression of the work and keep the XQuery version for production use.

As excellent as I think XQuery and Walmsley’s book both are, I did want to warn you about the brevity of your XQuery deliverables.

I look forward to finish reading XQuery, 2nd Edition. I started doing so many things based on the first twelve or so chapters that I just read selectively from that point on. It merits a complete read. You won’t be sorry you did.

01 Jan 21:04

Eleven Albums I Loved in 2015 And Nineteen More I Thought Were Worthy

by Erik Loomis

I don’t know how people really come up with definitive Top 10 album lists. But everyone loves them. Even the AARP has one! I listen to a ton of music, at almost every waking moment, and unless you are dedicated strictly to listening to new music in order to produce a list like this, I don’t see how you can come up with anything definitive. The number of albums compared to, say, the number of films released in American theaters makes the latter a possible task and the former impossible. Plus I still buy a lot of older albums as well (for whatever reason most of the new jazz I got in the last year is actually 2-5 years old so that’s really underrepresented here) In any case, here are my 10 favorite 2015 albums, a list that will probably look way different a year from now when I listen to a lot more 2015 albums in between listening to 2016 albums and all my older albums.

1) Sleater-Kinney, No Cities to Love. A perfect comeback album for one of the 10 best rock bands to ever exist. Let’s just embed an entire show.

2) Torres, Sprinter. I thought this was just great. MacKenzie Scott has a tremendous amount of emotion in every note of her voice. I’ve heard her songs described as storms because of that voice. A really powerful album.

3) Courtney Barnett, Sometimes I Sit and Think and Sometimes I Just Sit. On everyone’s list and deservedly so. “Pedestrian at Best” was my most listened to 2015 song.

4) Ibeyi, Ibeyi. This is hard to describe. These are twin sisters, daughters of a famous Cuban musician, who sing in English and Yoruba using fairly sparse and often minimal instrumentation. And it’s just great.

5) Bomba Estéreo, Amanecer. This is a Colombian band combining elements of hip-hop, electronics, and traditional Colombian folk music, including a lot of traditional instruments. Really glad I ran across this.

6) Alabama Shakes, Sound and Color. I like the first Alabama Shakes album OK, but thought this was a huge artistic jump, with a serious move into psychedelic music.

7) Waxahatchee, Ivy Tripp. Call it whiny hipster music if you want. The problem you’ll face is that Katie Crutchfield is really good at what she does.

8) Tal National, Zoy Zoy. This band from Niger is another of my favorite finds of 2015. Incredibly enjoyable music

9) Kurt Vile, B’lieve I’m Goin Down. Guitar rock for the 21st century.

10) DJ Spooky and the Kronos Quartet, Rebirth of a Nation. DJ Spooky decided to create his own soundtrack to Birth of a Nation. You can read about his thoughts on it here. He recorded it with the Kronos Quartet. Makes for one of the most interesting albums of the year.

Live Album of the Year is far and away Drive-By Truckers, It’s Great to Be Alive. This amazing live band had never put out a proper live album. At this point in their career, even a 35-song, 3 1/2 hour beast doesn’t feel like enough because a lot of your favorites weren’t on there. Songs that are often overlooked like “Sounds Better in the Song” and “Space City” are great while “The Devil Don’t Stay” is just awesome. Great stuff.

Others albums I liked to various degrees in 2015, many of which I will no doubt listen to a lot more next year:

1) James McMurtry, Complicated Game
2) Sufjan Stevens, Carrie & Lowell
3) Jason Isbell, Something More Than Free
4) Speedy Ortiz, Foil Deer
5) Ashley Monroe, The Blade
6) Christopher Paul Stelling, Labor Against Waste
7) Joanna Gruesome, Peanut Butter
8) Dave Rawlings Machine, Nashville Obsolete
9) Daniel Romano, If I’ve Only One Time Asking
10) Robert Glasper, Covered
11) The Go! Team, The Scene Between
12) Olivia Chaney, The Longest River
13) John Moreland, High on Tulsa Heat
14) Fred Thomas, All Are Saved
15) Shamir, Ratchet
16) Mbongwana Star, From Kinshasa
17) Dave Douglas, High Risk
18) Dwight Yoakam, Second Hand Heart
19) Sarah Gayle Meech, Tennessee Love Song

FacebookTwitterGoogle+Share

09 Dec 04:48

The Refreshingly Rewarding Realm of Research Papers

by Patrick Durusau

From the description:

Sean Cribbs teaches us how to read and implement research papers – and translate what they describe into code. He covers examples of research implementations he’s been involved in and the relationships he’s built with researchers in the process.

A bit longer description at: http://chicago.citycode.io/sean-cribbs.html

Have you ever run into a thorny problem that makes your code slow or complicated, for which there is no obvious solution? Have you ever needed a data structure that your language’s standard library didn’t provide? You might need to implement a research paper!

While much of research in Computer Science doesn’t seem relevant to your everyday web application, all of those tools and techniques you use daily originally came from research! In this talk we’ll learn why you might want to read and implement research papers, how to read them for relevant information, and how to translate what they describe into code and test the results. Finally, we’ll discuss examples of research implementation I’ve been involved in and the relationships I’ve built with researchers in the process.

As you might imagine, I think this rocks!

09 Dec 04:48

Using Graph Structure Record Linkage on Irish Census

by Patrick Durusau

Using Graph Structure Record Linkage on Irish Census Data with Neo4j by Brian Underwood.

From the post:

For just over a year I’ve been obsessed on-and-off with a project ever since I stayed in the town of Skibbereen, Ireland. Taking data from the 1901 and 1911 Irish censuses, I hoped I would be able to find a way to reliably link resident records from the two together to identify the same residents.

Since then I’ve learned a bit about master data management and record linkage and so I thought I would give it another stab.

Here I’d like to talk about how I’ve been matching records based on the local data space around objects to improve my record linkage scoring.

An interesting issue that has currency with intelligence agencies slurping up digital debris at every opportunity. So you have trillions of records. Which ones have you been able to reliably match up?

From a topic map perspective, I could not help but notice that in the 1901 census, the categories for Marriage were:

  • Married
  • Widower
  • Widow
  • Not Married

Whereas the 1911 census records:

  • Married
  • Widower
  • Widow
  • Single

As you know, one of the steps in record linkage is normalization of the data headings and values before you apply the standard techniques to link records together.

In traditional record linkage, the shift from “not married” to “single” is lost in the normalization.

May not be meaningful for your use case but could be important for someone studying shifts in marital relationship language. Or shifts in religious, ethnic, or racist language.

Or for that matter, shifts in the names of database column headers and/or tables. (Like anyone thinks those are stable.)

Pay close attention to how Brian models similarity candidates.

Once you move beyond string equivalent identifiers (TMDM), you are going to be facing the same issues.

28 Oct 22:18

SXSW turns tail and runs… [Rejoice SXSW Organizers Weren’t Civil Rights Organizers] Troll Police

by Patrick Durusau

SXSW turns tail and runs, nixing panels on harassment by Lisa Vaas.

From the post:

Threats of violence have led the popular South by Southwest (SXSW) festival to nix two panel discussions about online harassment, organizers announced on Monday.

In his post, SXSW Interactive Director Hugh Forrest didn’t go into detail about the threats.

But given the names of the panels cancelled, there’s a strong smell of #gamergate in the air.

Namely, the panels for the 2016 event, announced about a week ago, were titled “SavePoint: A Discussion on the Gaming Community” and “Level Up: Overcoming Harassment in Games.”

This reaction sure isn’t what they had in mind, Forrest wrote:

We had hoped that hosting these two discussions in March 2016 in Austin would lead to a valuable exchange of ideas on this very important topic.

However, in the seven days since announcing these two sessions, SXSW has received numerous threats of on-site violence related to this programming. SXSW prides itself on being a big tent and a marketplace of diverse people and diverse ideas.

However, preserving the sanctity of the big tent at SXSW Interactive necessitates that we keep the dialogue civil and respectful.

Arthur Chu, who was going to be a male ally on the Level Up panel, has written up the behind-the-scenes mayhem for The Daily Beast.

As Chu tells it, SXSW has a process of making proposed panels available for – disastrously enough, given the tactics of torch-bearing villagers – a public vote.

I rejoice the SXSW organizers weren’t civil rights organizers.

Here is an entirely fictional account of that possible conversation about marching across the Pettus Bridge.

Hugh Forrest: Yesterday (March 6, 1965), Gov. Wallace ordered the state police to prevent a march on between Selma and Montgomery by “whatever means are necessary….”

SXSW organizer: I heard that! And the police turned off the street lights and beat a large group on February 18, 1965 and followed Jimmie Lee Jackson into a cafe, shooting him. He died eight days later.

Another SXSW organizer: There has been nothing but violence and more violence for weeks, plus threats of more violence.

Hugh Forrest: Run away! Run away!

A video compilation of the violence Hugh Forrest and his fellow cowards would have dodged as civil rights organizers: Selma-to-Montgomery “Bloody Sunday” – Video Compilation.

Hugh Forrest and SXSW have pitched a big tent that is comfortable for abusers.

I consider that siding with the abusers.

How about you?

Safety and Physical Violence at Public Gatherings:

Assume that a panel discussion on online harassment does attract threats of physical violence. Isn’t that what police officers are trained to deal with?

And for that matter, victims of online harassment are more likely to be harmed in the real world when they are alone aren’t they?

So a public panel discussion, with the police in attendance, is actually safer for victims of online harassment than any other place for a real world confrontation.

Their abusers and their vermin-like supporters would have to come out from under their couches and closets into the light to harass them. Police officers are well equipped to hand out immediate consequences for such acts.

Abusers would become entangled in a legal system with little patience with or respect for their online presences.

Lessons from the Pettus Bridge:

In my view, civil and respectful dialogue isn’t how you deal with abusers, online or off. Civil and respectful dialogue didn’t protect the marchers to Montgomery and it won’t protect victims of online harassment.

The marchers to Montgomery were protected when forces more powerful than the local and state police moved into protect them.

What is required to protect targets of online harassment is a force larger and more powerful than their abusers.

Troll Police:

Consider this a call upon those with long histories of fighting online abuse individually and collectively to create a crowd-sourced Troll Police.

Public debate over the criteria for troll behavior and appropriate responses will take time but is an essential component to community validation for such an effort.

Imagine the Troll Police amassing a “big data” size database of online abuse. A database where members of the public can contribute analysis or research to help identify trolls.

That would be far more satisfying than wringing your hands when you hear of stories of abuse and wish things were better. Things can be better but if and only if we take steps to make them better.

I have some ideas and cycles I would contribute to such an effort.

How about you?

20 Jul 02:44

I’m a bird watcher, I’m a bird watcher, here comes one now…

by Patrick Durusau

New website can identify birds using photos

From the post:

In a breakthrough for computer vision and for bird watching, researchers and bird enthusiasts have enabled computers to achieve a task that stumps most humans—identifying hundreds of bird species pictured in photos.

The bird photo identifier, developed by the Visipedia research project in collaboration with the Cornell Lab of Ornithology, is available for free at: AllAboutBirds.org/photoID.

Results will be presented by researchers from Cornell Tech and the California Institute of Technology at the Computer Vision and Pattern Recognition (CVPR) conference in Boston on June 8, 2015.

Called Merlin Bird Photo ID, the identifier is capable of recognizing 400 of the mostly commonly encountered birds in the United States and Canada.

“It gets the bird right in the top three results about 90% of the time, and it’s designed to keep improving the more people use it,” said Jessie Barry at the Cornell Lab of Ornithology. “That’s truly amazing, considering that the computer vision community started working on the challenge of bird identification only a few years ago.”

The perfect website for checking photos of birds made on summer vacation and an impressive feat of computer vision.

The more the service is used, the better it gets. Upload your vacation bird pics today!

20 Jul 02:35

Clojure By Example

by Patrick Durusau

Clojure By Example by Hirokuni Kim.

From About:

I don’t like reading thick O’Reilly books when I start learning new programming languages. Rather, I like starting by writing small and dirty codes. If you take this approach, having many simple codes examples are extremely helpful because I can find answers to these questions very easily.

How can I define a function?

What’s the syntax for if and else?

Does the language support string interpolation?

What scopes of variables are available?

These are very basic questions, but enough to start hacking with the new languages.

Recently, I needed to learn this completely new language Clojure but couldn’t find what I wanted. So, I decided to create one while learning Clojure.

Hopefully, this helps you to start learning and writing Clojure.

Personally I like the side-by-side text — code presentation. You?

20 Jul 02:33

A gallery of interesting IPython Notebooks

by Patrick Durusau

A gallery of interesting IPython Notebooks by David Mendler.

From the webpage:

This page is a curated collection of IPython notebooks that are notable for some reason. Feel free to add new content here, but please try to only include links to notebooks that include interesting visual or technical content; this should not simply be a dump of a Google search on every ipynb file out there.

https://github.com/ipython/ipython/wiki/A-gallery-of-interesting-IPython-Notebooks#general-python-programming

The table of contents:

  1. Entire books or other large collections of notebooks on a topic
  2. Scientific computing and data analysis with the SciPy Stack
  3. General Python Programming
  4. Notebooks in languages other than Python
  5. Miscellaneous topics about doing various things with the Notebook itself
  6. Reproducible academic publications
  7. Other publications using the Notebook
  8. Data-driven journalism
  9. Whimsical notebooks
  10. Videos of IPython being used in the wild

Yes, quoting the table of contents may impact my ranking by Google but I prefer content that is useful to me and hopefully you. Please bookmark this site and pass it on.

20 Jul 02:32

CVPR 2015 Papers

by Patrick Durusau

CVPR [Computer Vision and Pattern Recognition] 2015 Papers by @karpathy.

This is very cool!

From the webpage:

Below every paper are TOP 100 most-occuring words in that paper and their color is based on LDA topic model with k = 7.
(It looks like 0 = datasets?, 1 = deep learning, 2 = videos , 3 = 3D Computer Vision , 4 = optimization?, 5 = low-level Computer Vision?, 6 = descriptors?)

You can sort by LDA topics, view the PDFs, rank the other papers by tf-idf similarity to a particular paper.

Very impressive and suggestive of other refinements for viewing a large number of papers in a given area.

Enjoy!

22 Jun 17:59

NumPy / SciPy / Pandas Cheat Sheet

by Patrick Durusau

NumPy / SciPy / Pandas Cheat Sheet From quandl.

Useful but also an illustration of the tension between a true cheatsheet (one page, tiny print) and edging towards a legible but multi-page booklet.

I suspect the greatest benefit of a “cheatsheet” accrues to its author. The chores of selecting, typing and correcting being repetition that leads to memorization of the material.

I first saw this in a tweet by Kirk Borne.

22 Jun 17:59

Python Mode for Processing

by Patrick Durusau

Python Mode for Processing

From the webpage:

You write Processing code. In Python.

Processing is a programming language, development environment, and online community. Since 2001, Processing has promoted software literacy within the visual arts and visual literacy within technology. Today, there are tens of thousands of students, artists, designers, researchers, and hobbyists who use Processing for learning, prototyping, and production.

Processing was initially released with a Java-based syntax, and with a lexicon of graphical primitives that took inspiration from OpenGL, Postscript, Design by Numbers, and other sources. With the gradual addition of alternative progamming interfaces — including JavaScript, Python, and Ruby — it has become increasingly clear that Processing is not a single language, but rather, an arts-oriented approach to learning, teaching, and making things with code.

We are thrilled to make available this public release of the Python Mode for Processing, and its associated documentation. More is on the way! If you’d like to help us improve the implementation of Python Mode and its documentation, please find us on Github!

A screen shot of part of one image from Dextro.org will give you a glimpse of the power of Processing:

processing-example

BTW, this screen shot pales on comparison to the original image.

Enough said?