Shared posts

22 Jun 19:01

The Political One Percent of the One Percent:…

by Patrick Durusau

The Political One Percent of the One Percent: Megadonors fuel rising cost of elections in 2014 by Peter Olsen-Phillips, Russ Choma, Sarah Bryner, and Doub Weber.

From the post:

In the 2014 elections, 31,976 donors — equal to roughly one percent of one percent of the total population of the United States — accounted for an astounding $1.18 billion in disclosed political contributions at the federal level. Those big givers — what we have termed the “Political One Percent of the One Percent” — have a massively outsized impact on federal campaigns.

They’re mostly male, tend to be city-dwellers and often work in finance. Slightly more of them skew Republican than Democratic. A small subset — barely five dozen — earned the (even more) rarefied distinction of giving more than $1 million each. And a minute cluster of three individuals contributed more than $10 million apiece.

The last election cycle set records as the most expensive midterms in U.S. history, and the country’s most prolific donors accounted for a larger portion of the total amount raised than in either of the past two elections.

The $1.18 billion they contributed represents 29 percent of all fundraising that political committees disclosed to the Federal Election Commission in 2014. That’s a greater share of the total than in 2012 (25 percent) or in 2010 (21 percent).

It’s just one of the main takeaways in the latest edition of the Political One Percent of the One Percent, a joint analysis of elite donors in America by the Center for Responsive Politics and the Sunlight Foundation.

BTW, although the report says conservatives “edged their liberal opponents,” the Republicans raised $553 million and Democrats raised $505 million from donors on the one percent of the one percent list. The $48 million difference isn’t rounding error size but once you break one-half $billon, it doesn’t seem as large as it might otherwise.

As far as I can tell, the report does not reproduce the addresses of the one percent of one percent donors. For that you need to use the advanced search option at the FEC and put 8810 (no dollar sign needed) in the first “amount range” box, set the date range to 2014 to 2015 and then search. Quite a long list so you may want to do it by state.

To get the individual location information, you can to follow the transaction number at the end of each record returned by your query and that returns a PDF page. Somewhere on that page will be the address information for the donor.

As far as campaign finance, the report indicates you need to find another way to influence the political process. Any donation much below the one percent of one percent minimum, i.e., $8810, isn’t going to buy you any influence. In fact, you are subsidizing the cost of a campaign that benefits the big donors the most. If big donors want to buy those campaigns, let them support the entire campaign.

In a sound bite: Don’t subsidize major political donors with small contributions.

Once you have identified the one percent of one percent donors, you can start to work out the other relationships between those donors and the levers of power.

22 Jun 18:20

spaCy: Industrial-strength NLP

by Patrick Durusau

spaCy: Industrial-strength NLP by Matthew Honnibal.

From the post:

spaCy is a new library for text processing in Python and Cython. I wrote it because I think small companies are terrible at natural language processing (NLP). Or rather: small companies are using terrible NLP technology.

To do great NLP, you have to know a little about linguistics, a lot about machine learning, and almost everything about the latest research. The people who fit this description seldom join small companies. Most are broke — they’ve just finished grad school. If they don’t want to stay in academia, they join Google, IBM, etc.

The net result is that outside of the tech giants, commercial NLP has changed little in the last ten years. In academia, it’s changed entirely. Amazing improvements in quality. Orders of magnitude faster. But the academic code is always GPL, undocumented, unuseable, or all three. You could implement the ideas yourself, but the papers are hard to read, and training data is exorbitantly expensive. So what are you left with? A common answer is NLTK, which was written primarily as an educational resource. Nothing past the tokenizer is suitable for production use.

I used to think that the NLP community just needed to do more to communicate its findings to software engineers. So I wrote two blog posts, explaining how to write a part-of-speech tagger and parser. Both were well received, and there’s been a bit of interest in my research software — even though it’s entirely undocumented, and mostly unuseable to anyone but me.

So six months ago I quit my post-doc, and I’ve been working day and night on spaCy since. I’m now pleased to announce an alpha release.

If you’re a small company doing NLP, I think spaCy will seem like a minor miracle. It’s by far the fastest NLP software ever released. The full processing pipeline completes in 7ms per document, including accurate tagging and parsing. All strings are mapped to integer IDs, tokens are linked to embedded word representations, and a range of useful features are pre-calculated and cached.

Matthew uses an example based on Stephen King’s admonition “the adverb is not your friend“, which immediately brought to mind the utility of tagging all adverbs and adjectives in a standards draft and then generating comments that identify its parent <p> element and the offending phrase.

I haven’t verified the performance comparisons, but as you know, the real question is how well spaCy works on your data, work flow, etc.?

Thanks to Matthew for the reminder of: On writing : a memoir of the craft by Stephen King. Documentation will never be as gripping as a King novel, but it shouldn’t be painful to read.

I first saw this in a tweet by Jason Baldridge.

22 Jun 18:15

SciGraph

by Patrick Durusau

SciGraph

From the webpage:

SciGraph aims to represent ontologies and data described using ontologies as a Neo4j graph. SciGraph reads ontologies with owlapi and ingests ontology formats available to owlapi (OWL, RDF, OBO, TTL, etc). Have a look at how SciGraph translates some simple ontologies.

Goals:

  • OWL 2 Support
  • Provide a simple, usable, Neo4j representation
  • Efficient, parallel ontology ingestion
  • Provide basic “vocabulary” support
  • Stay domain agnostic

Non-goals:

  • Create ontologies based on the graph
  • Reasoning support

Some applications of SciGraph:

  • the Monarch Initiative uses SciGraph for both ontologies and biological data modeling [repaired link] [Monarch enables navigation across a rich landscape of phenotypes, diseases, models, and genes for translational research.]
  • SciCrunch uses SciGraph for vocabulary and annotation services [biomedical but also has US patents?]
  • CINERGI uses SciGraph for vocabulary and annotation services [Community Inventory of EarthCube Resources for Geosciences Interoperability, looks very ripe for a topic map discussion]

If you are interested in representation, modeling or data integration with ontologies, you definitely need to take a look at SciGraph.

Enjoy!

22 Jun 18:02

New Natural Language Processing and NLTK Videos

by Patrick Durusau

Natural Language Processing With Python and NLTK p.1 Tokenizing words and Sentences and Stop Words – Natural Language Processing With Python and NLTK p.2 by Harrison Kinsley.

From part 1:

Natural Language Processing is the task we give computers to read and understand (process) written text (natural language). By far, the most popular toolkit or API to do natural language processing is the Natural Language Toolkit for the Python programming language.

The NLTK module comes packed full of everything from trained algorithms to identify parts of speech to unsupervised machine learning algorithms to help you train your own machine to understand a specific bit of text.

NLTK also comes with a large corpora of data sets containing things like chat logs, movie reviews, journals, and much more!

Bottom line, if you’re going to be doing natural language processing, you should definitely look into NLTK!

Playlist link: https://www.youtube.com/watch?v=FLZvO…

sample code: http://pythonprogramming.net
http://hkinsley.com
https://twitter.com/sentdex
http://sentdex.com
http://seaofbtc.com

Use the Playlist link: https://www.youtube.com/watch?v=FLZvO… link as I am sure more videos will be appearing in the near future.

Enjoy!

04 May 21:56

SPARQL in 11 minutes (Bob DuCharme)

by Patrick Durusau

From the description:

An introduction to the W3C query language for RDF. See http://www.learningsparql.com for more.

I first saw this in Bob DuCharme’s post: SPARQL: the video.

Nothing new for old hands but useful to pass on to newcomers.

I say nothing new, I did learn that Bob has a Korg Monotron synthesizer. Looking forward to more “accompanied” blog posts. ;-)

03 May 02:37

On The Bleeding Edge – PySpark, DataFrames, and Cassandra

by Patrick Durusau

On The Bleeding Edge – PySpark, DataFrames, and Cassandra.

From the post:

A few months ago I wrote a post on Getting Started with Cassandra and Spark.

I’ve worked with Pandas for some small personal projects and found it very useful. The key feature is the data frame, which comes from R. Data Frames are new in Spark 1.3 and was covered in this blog post. Till now I’ve had to write Scala in order to use Spark. This has resulted in me spending a lot of time looking for libraries that would normally take me less than a second to recall the proper Python library (JSON being an example) since I don’t know Scala very well.

If you need help deciding whether to read this post, take a look at Spark SQL and DataFrame Guide to see what you stand to gain.

Enjoy!

17 Apr 20:21

clojure-datascience (Immutability for Auditing)

by Patrick Durusau

clojure-datascience

From the webpage:

Resources for the budding Clojure Data Scientist.

Lots of opportunities for contributions!

It occurs to me that immutability is a prerequisite for auditing.

Yes?

If I were the SEC, as in the U.S. Securities and Exchange Commission, and NOT the SEC, as in the Southeastern Conference (sports), I would make immutability a requirement for data systems in the finance industry.

Any mutable change would be presumptive evidence of fraud.

That would certainly create a lot of jobs in the financial sector for functional programmers. And jailers as well considering the history of the finance industry.

07 Apr 01:59

Down the Clojure Rabbit Hole

by Patrick Durusau

Down the Clojure Rabbit Hole by Christophe Grand.

From the description:

Christophe Grand tells Clojure stories full of immutability, data over behavior, relational programming, declarativity, incrementalism, parallelism, collapsing abstractions, harmful local state and more.

A personal journey down the Clojure rabbit hole.

Not an A to B type talk but with that understanding, it is entertaining and useful.

Slides and MP3 are available for download.

Enjoy!

31 Mar 02:19

Larry Tribe: The Crank Years

by Scott Lemieux

laurence-tribe

Chait has an amusing discussion of Laurence Tribe’s willingness to cash paychecks from Big Coal to make arguments better suited to the CATO institute blog:

Tribe is playing an important legal role, which has to be evaluated on its own terms. Other law professors, like Richard Revesz, Jody Freeman, and Richard Lazarus, have called Tribe’s legal argument frivolous and absurd. Tribe has responded. But aside from the legal case Tribe has devised, his advocacy is also playing a crucial public role in the debate — even liberal professor Laurence Tribe noted that Obama’s climate regulations must be unconstitutional, which sounds very different from even coal company lawyer Lawrence Tribe agrees that Obama’s climate regulations must be unconstitutional. Should anybody put weight on Tribe’s endorsement of the anti-Obama lawsuit, any more than they should have taken Harvard law professor Alan Dershowitz’s word for it that O.J. Simpson was innocent?

The question of whether Tribe is arguing in bad faith is difficult to answer. His fetish for bad states’ rights arguments did not begin here, although as far as I can tell he’s certainly never made any claims this remotely this bad or this radical before. As Paul has previously observed, at Tribe’s particular position in the legal profession asking whether he’s arguing in bad faith is almost a category error, like trying to figure out what the leader of a large brokerage party “really thinks.”

The more important question is whether his arguments are at all plausible, and…they are in fact strikingly terrible. They push far beyond current federalism doctrine to reach results with appalling consequences. Taken together, if applied seriously the arguments he’s making would threaten huge swaths of the United States Code. I’m particularly gobsmacked that he would embrace a favorite argument of radical libertarians, “the contemporary regulatory state is unconstitutional because the takings clause“:

Second, the constitutional arguments are wholly without merit. Tribe argues that EPA’s rule is an unconstitutional “taking” of industry’s private property under the Fifth Amendment because government regulation of power plant pollution has not covered greenhouse gas emissions until now. The clear implication of Tribe’s novel view of the Constitution is that the coal industry, and the power plants that burn their coal, possess an absolute constitutional property right to continue to emit greenhouse gases in perpetuity. No Supreme Court opinion has ever announced such a preposterously extreme proposition of constitutional law. Nor has even one single Justice in more than two centuries of cases endorsed such a reading of the Fifth Amendment.

If Tribe were right, government could never regulate newly discovered air or water pollution, or other new harms, from existing industrial facilities, no matter how dangerous to public health and welfare, as long as the impacts are incremental and cumulative. The harm EPA seeks to address with its power plant rule not only affects future generations, but also current ones already managing the impacts and risks of climate change. Indeed, after an unprecedented and exhaustive scientific review, EPA in 2009 made a formal finding that greenhouse gases already endanger public health and welfare. The D.C. Circuit upheld this finding, and, given a chance to review it, the Supreme Court declined. This is important because it makes it all the more astonishing that Professor Tribe has himself determined that greenhouse gases do not pose the kind of risk that government is entitled to address, unless it is willing to compensate industry for its losses. It is hard to imagine a more industry-friendly and socially destructive principle than this.

Thankfully, this principle has no basis in constitutional law. The Supreme Court has repeatedly made clear that the Fifth Amendment’s Takings Clause does not shield business investments from future regulation, even when that regulation cuts sharply into their profits. The Constitution protects only “reasonable investment backed expectations,” and there is simply no reasonable expectation to profit forever from activities that are proven to harm public health and welfare. Certainly the coal industry uniquely enjoys no special exemption from this fundamental constitutional rule.

The nondelegation and anti-commandeering are no better, and any of them could have been made by Richard Epstein himself. I don’t really care whether Tribe believes them or not; what matters is that they all need to be killed and the earth salted before they could reemerge. They would be embarrassing if they were being made for good policy ends, let alone being made to protect the interests of polluters and increase carbon emissions during an environmental crisis. And I’m note sure he’ll be able to get even Clarence Thomas’s vote for the constitutional arguments.

Tribe has made many salutary and important contributions to constitutional law. Where’s he’s coming from here, I have no idea.


24 Mar 16:36

Sorting [Visualization]

by Patrick Durusau

Carlo Zapponi created http://sorting.at/, a visualization of sorting resource that steps through different sorting algorithms. You can choose from four different initial states, six (6) different sizes (5, 10, 20, 50, 75, 100), and six (6) different colors.

The page defaults to Quick Sort and Heap Sort, but under add algorithms you will find:

I added Wikipedia links for the algorithms. For a larger list see:
Sorting algorithm.

I first saw this in a tweet by Eric Christensen.

24 Mar 01:12

Polyglot Data Management – Big Data Everywhere Recap

by Patrick Durusau

Polyglot Data Management – Big Data Everywhere Recap by Michele Nemschoff.

From the post:

At the Big Data Everywhere conference held in Atlanta, Senior Software Engineer Mike Davis and Senior Solution Architect Matt Anderson from Liaison Technologies gave an in-depth talk titled “Polyglot Data Management,” where they discussed how to build a polyglot data management platform that gives users the flexibility to choose the right tool for the job, instead of being forced into a solution that might not be optimal. They discussed the makeup of an enterprise data management platform and how it can be leveraged to meet a wide variety of business use cases in a scalable, supportable, and configurable way.

Matt began the talk by describing the three components that make up a data management system: structure, governance and performance. “Person data” was presented as a good example when thinking about these different components, as it includes demographic information, sensitive information such as social security numbers and credit card information, as well as public information such as Facebook posts, tweets, and YouTube videos. The data management system components include:

It’s a vendor pitch so read with care but it comes closer than any other pitch I have seen to capturing the dynamic nature of data. Data isn’t the same from every source and you treat it the same at your peril.

If I had to say the pitch has a theme it is to adapt your solutions to your data and goals, not the other way around.

The one place where I may depart from the pitch is on the meaning of “normalization.” True enough we may want to normalize data a particular way this week, this month, but that should no preclude us from other “normalizations” should our data or requirements change.

The danger I see in “normalization” is that the cost of changing static ontologies, schemas, etc., leads to their continued use long after they have passed their discard dates. If you are as flexible with regard to your information structures as you are your data, then new data or requirements are easier to accommodate.

Or to put it differently, what is the use of being flexible with data if you intend to imprison it in a fixed labyrinth?

08 Mar 19:25

Blazegraph™ Selected by Wikimedia Foundation to Power the Wikidata Query Service

by Patrick Durusau

Blazegraph™ Selected by Wikimedia Foundation to Power the Wikidata Query Service by Brad Bebee.

From the post:

Blazegraph™ has been selected by the Wikimedia Foundation to be the graph database platform for the Wikidata Query Service. Read the Wikidata announcement here. Blazegraph™ was chosen over Titan, Neo4j, Graph-X, and others by Wikimedia in their evaluation. There’s a spreadsheet link in the selection message, which has quite an interesting comparison of graph database platforms.

Wikidata acts as central storage for the structured data of its Wikimedia sister projects including Wikipedia, Wikivoyage, Wikisource, and others. The Wikidata Query Service is a new capability being developed to allow users to be able to query and curate the knowledge base contained in Wikidata.

We’re super-psyched to be working with Wikidata and think it will be a great thing for Wikidata and Blazegraph™.

From the Blazegraph™ SourceForge page:

Blazegraph™is SYSTAP’s flagship graph database. It is specifically designed to support big graphs offering both Semantic Web (RDF/SPARQL) and Graph Database (tinkerpop, blueprints, vertex-centric) APIs. It is built on the same open source GPLv2 platform and maintains 100% binary and API compatibility with Bigdata®. It features robust, scalable, fault-tolerant, enterprise-class storage and query and high-availability with online backup, failover and self-healing. It is in production use with enterprises such as Autodesk, EMC, Yahoo7!, and many others. Blazegraph™ provides both embedded and standalone modes of operation.

Blazegraph has a High Availability and Scale Out architecture. It provides robust support for Semantic Web (RDF/SPARQ)L and Property Graph (Tinkerpop) APIs. Highly scalable Blazegraph graph can handle 50 Billion edges.

The Blazegraph wiki, which has forty-three (43) substantive links to further details on Blazegraph.

For an even deeper look, consider these white papers:

Enjoy!

25 Feb 22:41

A Gentle Introduction to Algorithm Complexity Analysis

by Patrick Durusau

A Gentle Introduction to Algorithm Complexity Analysis by Dionysis “dionyziz” Zindros.

From the post:

A lot of programmers that make some of the coolest and most useful software today, such as many of the stuff we see on the Internet or use daily, don’t have a theoretical computer science background. They’re still pretty awesome and creative programmers and we thank them for what they build.

However, theoretical computer science has its uses and applications and can turn out to be quite practical. In this article, targeted at programmers who know their art but who don’t have any theoretical computer science background, I will present one of the most pragmatic tools of computer science: Big O notation and algorithm complexity analysis. As someone who has worked both in a computer science academic setting and in building production-level software in the industry, this is the tool I have found to be one of the truly useful ones in practice, so I hope after reading this article you can apply it in your own code to make it better. After reading this post, you should be able to understand all the common terms computer scientists use such as “big O”, “asymptotic behavior” and “worst-case analysis”.

Do you nod when encountering “big O,” “asymptotic behavior” and “worst-case analysis” in CS articles?

Or do you understand what is meant when you encounter “big O,” “asymptotic behavior” and “worst-case analysis” in CS articles?

You are the only one who can say for sure. If it has been a while or you aren’t sure, this should act as a great refresher.

As an incentive, you can intimidate co-workers with descriptions of your code. ;-)

I first saw this in a tweet by Markus Sagebiel.

25 Feb 22:41

Category theory for beginners

by Patrick Durusau

Category theory for beginners by Ken Scrambler

From the post:

Explains the basic concepts of Category Theory, useful terminology to help understand the literature, and why it’s so relevant to software engineering.

Some two hundred and nine (209) slides, ending with pointers to other resources.

I would have dearly loved to see the presentation live!

This slide deck comes as close as any I have seen to teaching category theory as you would a natural language. Not too close but closer than others.

Think about it. When you entered school did the teacher begin with the terminology of grammar and how rules of grammar fit together?

Or, did the teacher start you off with “See Jack run.” or its equivalent in your language?

You were well on your way to being a competent language user before you were tasked with learning the rules for that language.

Interesting that the exact opposite approach is taken with category theory and so many topics related to computer science.

Pointers to anyone using a natural language teaching approach for category theory or CS material?

25 Feb 22:38

How gzip uses Huffman coding

by Patrick Durusau

How gzip uses Huffman coding by Julia Evans.

From the post:

I wrote a blog post quite a while ago called gzip + poetry = awesome where I talked about how the gzip compression program uses the LZ77 algorithm to identify repetitions in a piece of text.

In case you don’t know what LZ77 is (I sure didn’t), here’s the video from that post that gives you an example of gzip identifying repetitions in a poem!

Julia goes beyond the video to illustrate how Huffman encoding is used by gzip to compress a text.

She includes code, pointers to other resources, basically all you need to join her in exploring the topic at hand. An education style that many manuals and posts would do well to adopt.

31 Jan 19:42

Data Science in Python

by Patrick Durusau

Data Science in Python by Greg.

From the webpage:

Last September we gave a tutorial on Data Science with Python at DataGotham right here in NYC. The conference was great and I highly suggest it! The “data prom” event the night before the main conference was particularly fun!

… (image omitted)

We’ve published the entire tutorial as a collection of IPython Notebooks. You can find the entire presentation on github or checkout the links to nbviewer below.

…(image omitted)

Table of Contents

A nice surprise for the weekend!

Curious, out of the government data that is online, local, state, federal, what data would you like most to see for holding government accountable?

Data science is a lot of fun in and of itself but results that afflict the comfortable are amusing as well.

I first saw this in a tweet by YHat, Inc.

24 Jan 22:53

Tooling Up For JSON

by Patrick Durusau

I needed to explore a large (5.7MB) JSON file and my usual command line tools weren’t a good fit.

Casting about I discovered Jshon: Twice as fast, 1/6th the memory. From the home page for Jshon:

Jshon parses, reads and creates JSON. It is designed to be as usable as possible from within the shell and replaces fragile adhoc parsers made from grep/sed/awk as well as heavyweight one-line parsers made from perl/python. Requires Jansson

Jshon loads json text from stdin, performs actions, then displays the last action on stdout. Some of the options output json, others output plain text meta information. Because Bash has very poor nested datastructures, Jshon does not try to return a native bash datastructure as a tpical library would. Instead, Jshon provides a history stack containing all the manipulations.

The big change in the latest release is switching the everything from pass-by-value to pass-by-reference. In a typical use case (processing AUR search results for ‘python’) by-ref is twice as fast and uses one sixth the memory. If you are editing json, by-ref also makes your life a lot easier as modifications do not need to be manually inserted through the entire stack.

Jansson is described as: “…a C library for encoding, decoding and manipulating JSON data.” Usual ./configure, make, make install. Jshon has no configure or install script so just make and toss it somewhere that is in your path.

Under Bugs you will read: “Documentation is brief.”

That’s for sure!

Still, it has enough examples that with some practice you will find this a handy way to explore JSON files.

Enjoy!

23 Jan 18:00

The Emularity

by Jason Scott

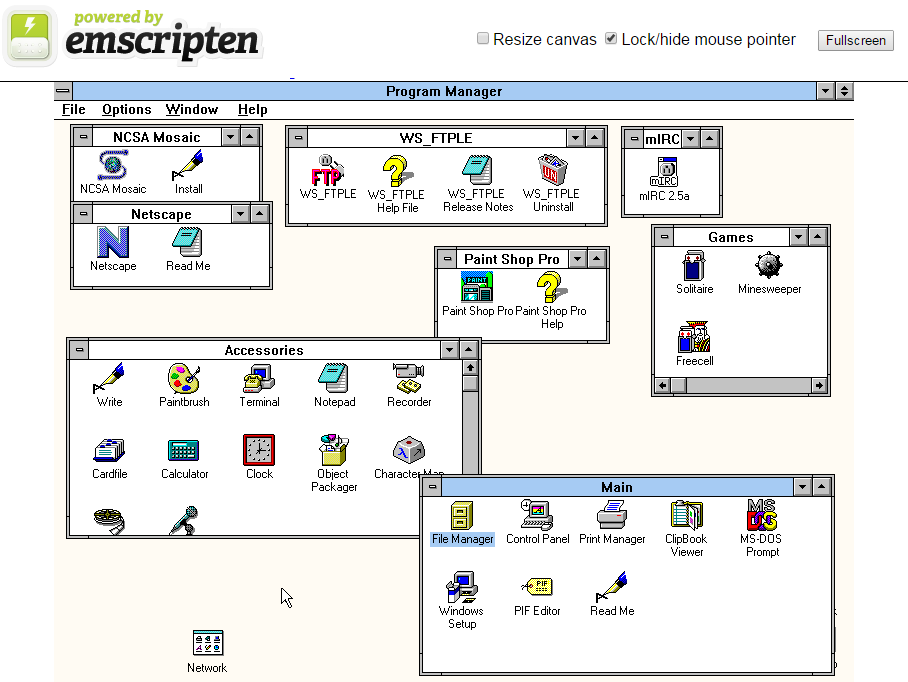
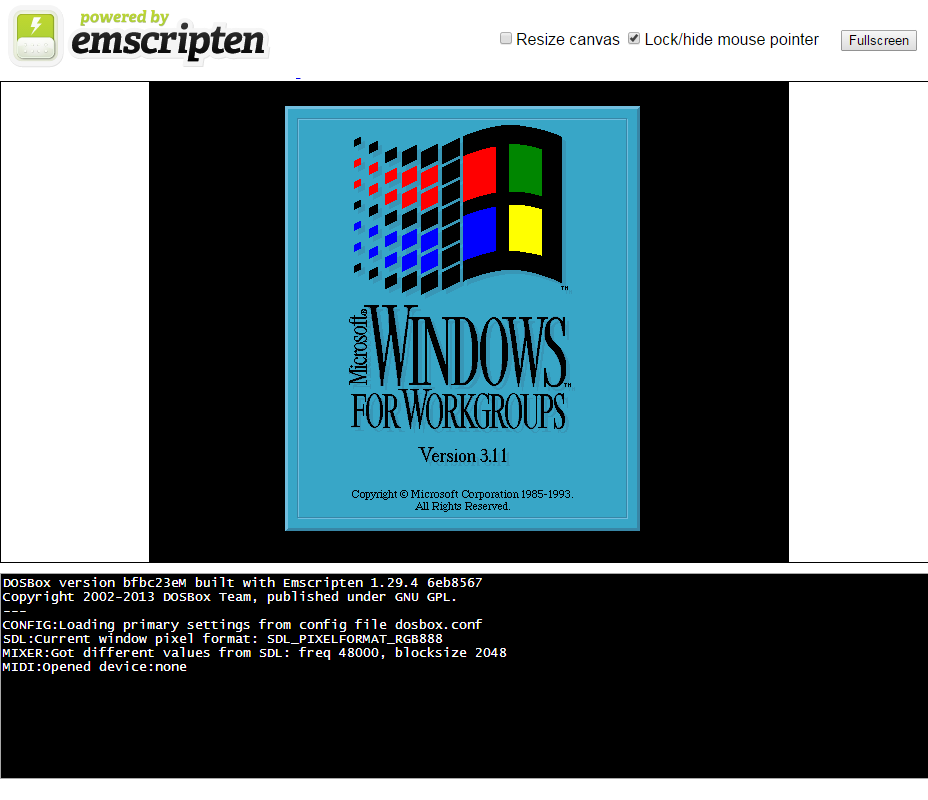
Last week, on the heels of the DOS emulation announcement, one of the JSMESS developers, James Baicoianu, got Windows 3.11 running in a window with Javascript.

win31

That’s impressive enough on its own right – it’s running inside the EM-DOSBOX system, since Windows 3.x was essentially a very complicated program running inside DOS. (When Windows 95 came out, a big deal was made by Gates and Co. that it was the “end” of the DOS prompt, although they were seriously off by a number of years.)

It runs at a good clip, and it has the stuff you’d expect to be in there.

windeskBai, tinkerer that he is, was not quite content with that. He wanted this operating system, sitting inside of a browser and running in Javascript, to connect with the outside world.

That took him about 3 days.

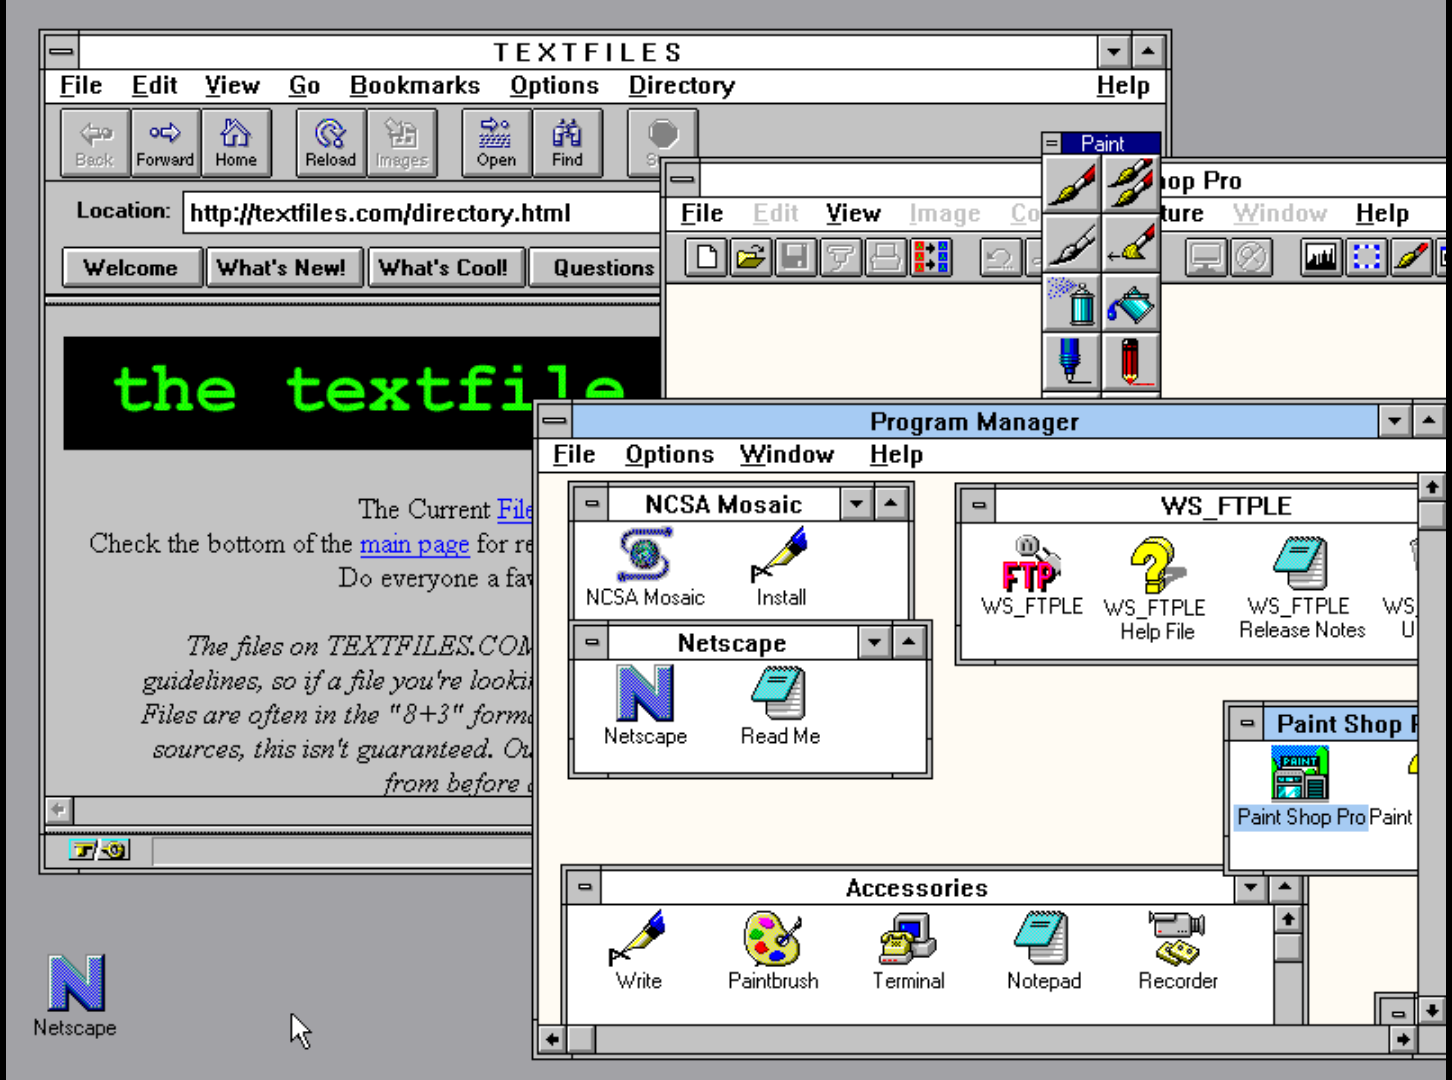
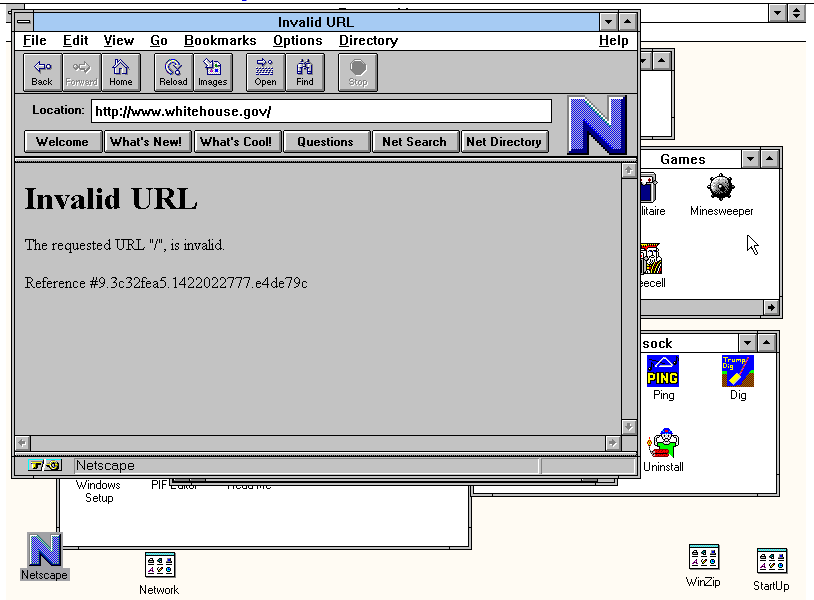
winThat’s Netscape 1.0n, released in December of 1994, running inside Windows 3.11, released in August of 1993, running inside of Google Chrome 39.0.2171.99 m, released about a week ago, on a Windows 7 PC, released in 2009.

And it’s connected to TEXTFILES.COM.

Windows 3.11 definitely works, and all the icons in there click through to the actual programs actually working. You can open solitaire and minesweeper, you can fire up MS-DOS, you can play with the calculator or play audio, and you can definitely boot up Netscape and NSCA Mosaic, or mIRC 2.5a or ping/traceroute to your heart’s content.

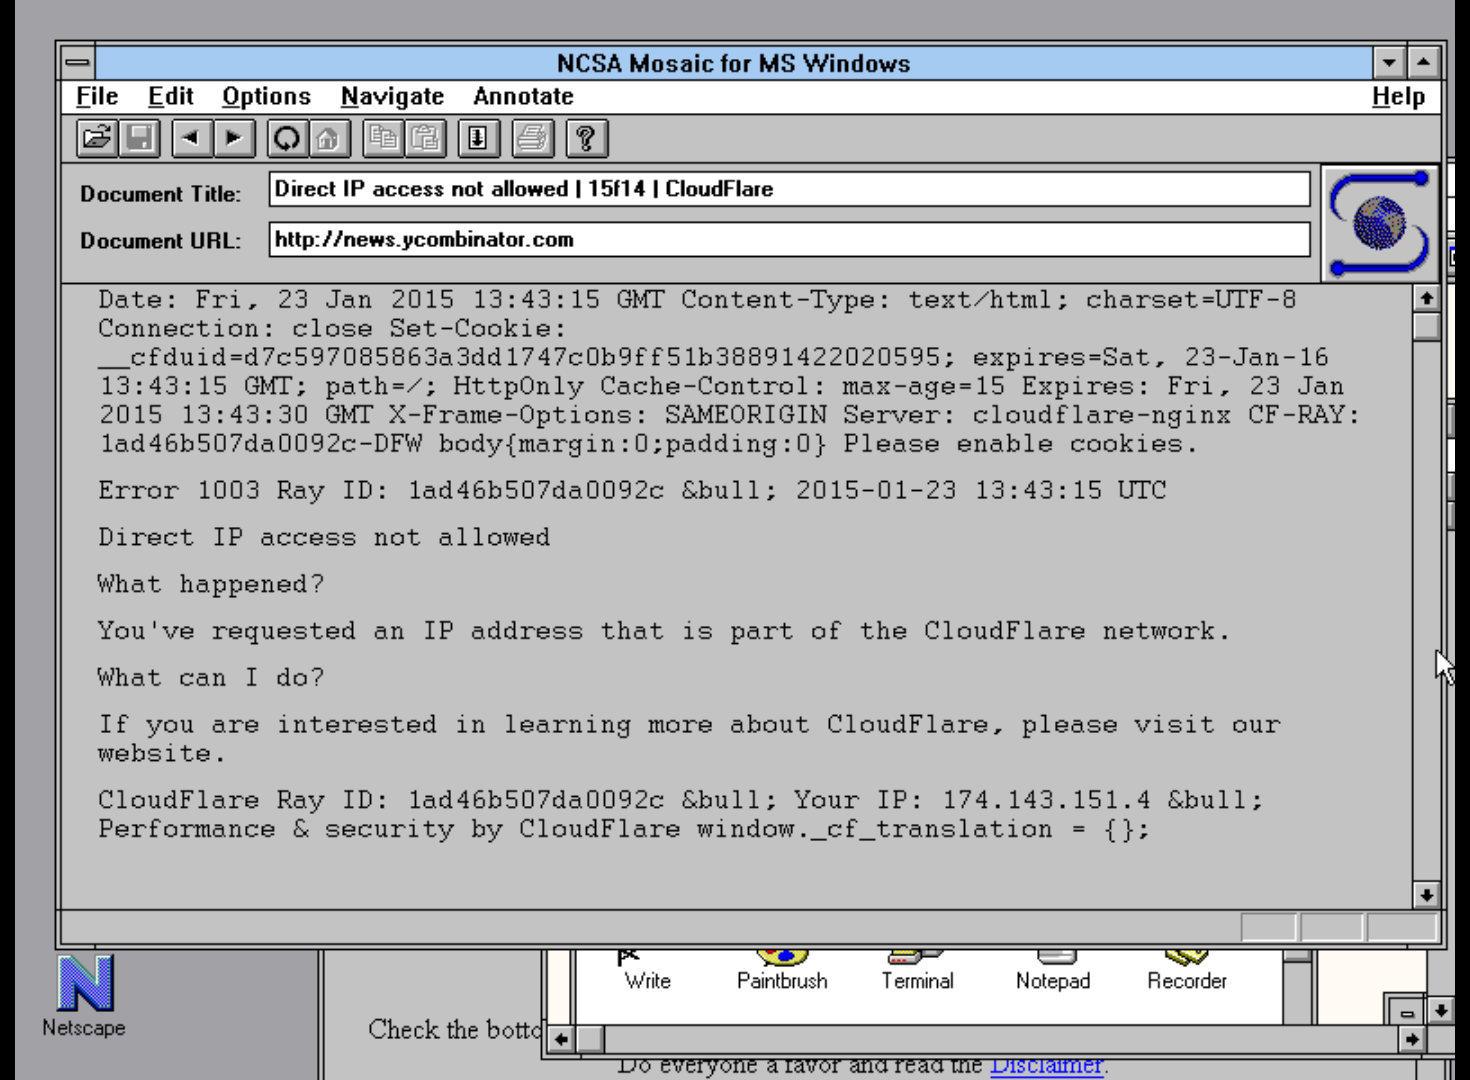
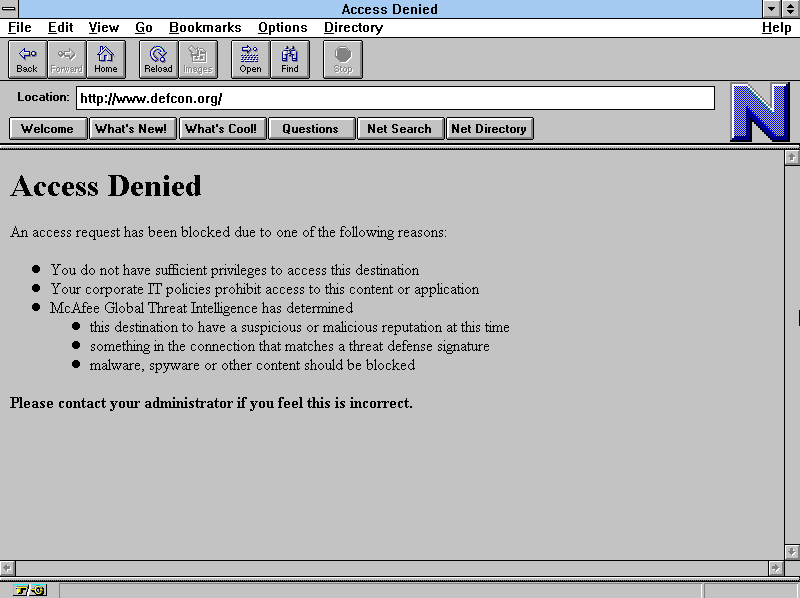
The world these Mosaic and Netscape browsers wake up in is very, very different. Websites, on the whole, and due to the way this is being done, don’t work.

hackernewsdefconIt turns out a number of fundamental aspects of The Web have changed since this time. There are modifications to the stream that can be done to get around some of this, and we’ll have screenshots when that happens. But for now, the connections are generally pretty sad looking.

digitalTo connect to the outside world, the Windows 3.11 instance is running Trumpet Winsock, one of the original TCP/IP conversions for Windows, and which uses a long-forgotten (but probably still in use here and there) protocol called PPP to “dial a modem” (actually, connect to a server), and transfer data to a PPP node (really just a standard web connection).

This means that somewhere, this instance needs to be connected to a proxy server, which assigns a 10.x.x.x address to the “Windows” machine, and then forwards the connections through. Basically, world’s weirdest, most hipster ISP on the face of the earth.

In other words, this is janky and imperfect and totally a hack.

But it works.

It took about three weeks after I decided we needed to go with EM-DOSBOX in addition to JSMESS to work with DOS programs, that we had it up on the archive.org site and going out to millions. It has taken two weeks after that for this situation to arrive.

Contrast with how it took poor Justin De Vesine, working hard with Justin Kerk and a host of other contributors, eight months to get JSMESS’s first machine (a colecovision) to run at 14% normal speed inside a browser, for one cartridge.

IMG_1813717583062Welcome to the Emularity, where the tools, processes and techniques developed over the past few years means we’re going to be iteratively improving the whole process quicker, and quicker, and we’ll be absorbing more and more aspects of historical computer information.

Now the stage is set – the amount of programs that can be run inside the browser is going to increase heavily over time. The actions that can be done against these programs, like where they can be pulled from or pushed out to, will also increase.

What becomes the priority (as it has been for some time) is tracking down as much of the old software as possible, especially the stuff that doesn’t sell itself like games or graphics do. I’m talking about educational, business, and utility software that risks dropping down between the cracks. I’m talking about obscure operating systems and OS variants that fell out of maintenance and favor. And I’m most certainly talking about in-process versions of later released works, which could stand to be seen in their glory, halfway done, and full of possibilities.

Documentation for the software just skyrocketed in value – we had bai reading 1995 books on PPP troubleshooting to get things going. MS-DOS programs on the Internet Archive will need links to manuals to become more useful (this is coming). And just grabbing context will continue to be a full-time job, hopefully split among a group of people who are as passionate as the folks I’ve been lucky enough to come into contact with so far.

I can entertain debates about the worthiness of this whole endeavor as an abstract anytime anyone wants. But the flywheel’s in motion. It’s not going to slow down.

We’re there.

Update: 

I should have known this was click-juice. Welcome everyone. To speak specifically to folks who “just want to try it”, I ask for patience in terms of this being available to try – it’s still so new and fragile, and frankly, it doesn’t help to have thousands of people hit on the thing, go crazy when it acts weird, and complain bitterly.

If you’re new to the Javascript Emulator party we’ve been throwing for the last year, may I humbly suggest visiting the Internet Archive’s Console Living Room, Software Library and Arcade? With over 25,000 items to try, there’s plenty to keep your attention before the next generation of stuff becomes playable.


20 Jan 02:46

Datomic Training Videos

by Patrick Durusau

Datomic Training Videos by Stu Halloway.

Part I: What is Datomic?

Part II: The Datomic Information Model

Part III: The Datomic Transaction Model

Part IV: The Datomic Query Model

Part V: The Datomic Time Model

Part VI: The Datomic Operational Model

About four (4) hours of videos with classroom materials, slides, etc.

OK, it’s not Downton Abbey but if you missed it last night you have a week to kill before it comes on TV again. May as well learn something while you wait. ;-)

Pay particular attention to the time model in Datomic. Then ask yourself (intelligence community): Why can’t I do that with my database? (Insert your answer as a comment, leaving out classified details.)

A bonus question: What role should Stu play on Downton Abbey?

09 Jan 23:29

Using graph databases to perform pathing analysis… [In XML too?]

by Patrick Durusau

Using graph databases to perform pathing analysis – initial experiments with Neo4J by Nick Dingwall.

From the post:

In the first post in this series, we raised the possibility that graph databases might allow us to analyze event data in new ways, especially where we were interested in understanding the sequences that events occured in. In the second post, we walked through loading Snowplow page view event data into Neo4J in a graph designed to enable pathing analytics. In this post, we’re going to see whether the hypothesis we raised in the first post is right: can we perform the type of pathing analysis on Snowplow data that is so difficult and expensive when it’s in a SQL database, once it’s loaded in a graph?

In this blog post, we’re going to answer a set of questions related to the journeys that users have taken through our own (this) website. We’ll start by answering some some easy questions to get used to working with Cypher. Note that some of these simpler queries could be easily written in SQL; we’re just interested in checking out how Cypher works at this stage. Later on, we’ll move on to answering questions that are not feasible using SQL.

If you dream in markup, ;-), you are probably thinking what I’m thinking. Yes, what about modeling paths in markup documents? What is more, visualizing those paths. Would certainly beat the hell out of some of the examples you find in the XML specifications.

Not to mentioned that they would be paths in your own documents.

Question: I am assuming you would not collapse all the <p> nodes yes? That is for some purposes we display the tree as though every node is unique, identified by its location in the markup tree. For other purposes it might be useful to visualize some paths as collapsed node where size or color is an indicator of the number of nodes collapsed into that path.

That sounds like a Balisage presentation for 2015.

09 Jan 23:28

Natural Language Analytics made simple and visual with Neo4j

by Patrick Durusau

Natural Language Analytics made simple and visual with Neo4j by Michael Hunger.

From the post:

I was really impressed by this blog post on Summarizing Opinions with a Graph from Max and always waited for Part 2 to show up :)

The blog post explains an really interesting approach by Kavita Ganesan which uses a graph representation of sentences of review content to extract the most significant statements about a product.

From later in the post:

The essence of creating the graph can be formulated as: “Each word of the sentence is represented by a shared node in the graph with order of words being reflected by relationships pointing to the next word”.

Michael goes on to create features with Cypher and admits near the end that “LOAD CSV” doesn’t really care if you have CSV files or not. You can split on a space and load text such as the “Lord of the Rings poem of the One Ring” into Neo4j.

Interesting work and a good way to play with text and Neo4j.

The single node per unique word presented here will be problematic if you need to capture the changing roles of words in a sentence.

03 Jan 19:22

Getting started with text analytics

by Patrick Durusau

Getting started with text analytics by Chris DuBois.

At GraphLab, we are helping data scientists go from inspiration to production. As part of that goal, we made sure that GraphLab Create is useful for manipulating text data, plugging the results into a machine learning model, and deploying a predictive service.

Text data is useful in a wide variety of applications:

  • Finding key phrases in online reviews that describe an attribute or aspect of a restaurant, product for sale, etc.
  • Detecting sentiment in social media, such as tweets and news article comments.
  • Predicting influential documents in large corpora, such as PubMed abstracts and arXiv articles

gl_wordcloud

So how do data scientists get started with text data? Regardless of the ultimate goal, the first step in text processing is typically feature engineering. We make this work easy to do using GraphLab Create. Examples of features include:

Just in case you get tired of watching conference presentations this weekend, I found this post from early December 2014 that I have been meaning to mention. Take a break from the videos and enjoy working through this post.

Chris promises more posts on data science skills so stay tuned!

30 Dec 03:34

Rare Find: Honest General Speaks Publicly About IS (ISIL, ISIS)

by Patrick Durusau

In Battle to Defang ISIS, U.S. Targets Its Psychology by Eric Schmitt.

From the post:

Maj. Gen. Michael K. Nagata, commander of American Special Operations forces in the Middle East, sought help this summer in solving an urgent problem for the American military: What makes the Islamic State so dangerous?

Trying to decipher this complex enemy — a hybrid terrorist organization and a conventional army — is such a conundrum that General Nagata assembled an unofficial brain trust outside the traditional realms of expertise within the Pentagon, State Department and intelligence agencies, in search of fresh ideas and inspiration. Business professors, for example, are examining the Islamic State’s marketing and branding strategies.

“We do not understand the movement, and until we do, we are not going to defeat it,” he said, according to the confidential minutes of a conference call he held with the experts. “We have not defeated the idea. We do not even understand the idea.” (emphasis added)

An honest member of the any administration in Washington is so unusual that I wanted to draw your attention to Maj. General Michael K. Nagata.

His problem, as you will quickly recognize, is one of a diversity of semantics. What is heard one way by a Western audience is heard completely differently by an audience with a different tradition.

The general may not think of it as “progress,” but getting Washington policy makers to acknowledge that there is a legitimate semantic gap between Western policy makers and IS is a huge first step. It can’t be grudging or half-hearted. Western policy makers have to acknowledge that there are honest views of the world that are different from their own. IS isn’t practicing dishonest, deception, perversely refusing to acknowledge the truth of Western statements, etc. Members of IS have an honest but different semantic view of the world.

If the good general can get policy makers to take that step, then and only then can the discussion of what that “other” semantic is and how to map it into terms comprehensible to Western policy makers can begin. If that step isn’t taken, then the resources necessary to explore and map that “other” semantic are never going to be allocated. And even if allocated, the results will never figure into policy making with regard to IS.

Failing on any of those three points: failing to concede the legitimacy of the IS semantic, failing to allocate resources to explore and understand the IS semantic, failing to incorporate an understanding of the IS semantic into policy making, is going to result in a failure to “defeat” IS, if that remains a goal after understanding its semantic.

Need an example? Consider the Viet-Nam war, in which approximately 58,220 Americans died and millions of Vietnamese, Laotions and Cambodians died, not counting long term injuries among all of the aforementioned. In case you have not heard, the United States lost the Vietnam War.

The reasons for that loss are wide and varied but let me suggest two semantic differences that may have played a role in that defeat. First, the Vietnamese have a long term view of repelling foreign invaders. Consider that Vietnam was occupied by the Chinese from 111 BCE until 938 CE, a period of more than one thousand (1,000) years. American war planners had a war semantic of planning for the next presidential election, not a winning strategy for a foe with a semantic that was two hundred and fifty (250) times longer.

The other semantic difference (among many others) was the understanding of “democracy,” which is usually heralded by American policy makers as a grand prize resulting from American involvement. In Vietnam, however, the villages and hamlets already had what some would consider democracy for centuries. (Beyond Hanoi: Local Government in Vietnam) Different semantic for “democracy” to be sure but one that was left unexplored in the haste to import a U.S. semantic of the concept.

Fighting a war where you don’t understand the semantics in play for the “other” side is risky business.

General Nagata has taken the first step towards such an understanding by admitting that he and his advisors don’t understand the semantics of IS. The next step should be to find someone who does. May I suggest talking to members of IS under informal meeting arrangements? Such that diplomatic protocols and news reporting doesn’t interfere with honest conversations? I suspect IS members are as ignorant of U.S. semantics as U.S. planners are of IS semantics so there would be some benefit for all concerned.

Such meetings would yield more accurate understandings than U.S. born analysts who live in upper middle-class Western enclaves and attempt to project themselves into foreign cultures. The understanding derived from such meetings could well contradict current U.S. policy assessments and objectives. Whether any administration has the political will to act upon assessments that aren’t the product of a shared post-Enlightenment semantic remains to be seen. But such a assessments must be obtained first to answer that question.

Would topic maps help in such an endeavor? Perhaps, perhaps not. The most critical aspect of such a project would be conceding for all purposes, the legitimacy of the “other” semantic, where “other” depends on what side you are on. That is a topic map “state of mind” as it were, where all semantics are treated equally and not any one as more legitimate than any other.


PS: A litmus test for Major General Michael K. Nagata to use in assembling a team to attempt to understand IS semantics: Have each applicant write their description of the 9/11 hijackers in thirty (30) words or less. Any applicant who uses any variant of coward, extremist, terrorist, fanatic, etc. should be wished well and sent on their way. Not a judgement on their fitness for other tasks but they are not going to be able to bridge the semantic gap between current U.S. thinking and that of IS.

The CIA has a report on some of the gaps but I don’t know if it will be easier for General Nagata to ask the CIA for a copy or to just find a copy on the Internet. It illustrates, for example, why the American strategy of killing IS leadership is non-productive if not counter-productive.

If you have the means, please forward this post to General Nagata’s attention. I wasn’t able to easily find a direct means of contacting him.

28 Dec 07:18

Categories Great and Small

by Patrick Durusau

Categories Great and Small by Bartosz Milewski.

From the post:

You can get real appreciation for categories by studying a variety of examples. Categories come in all shapes and sizes and often pop up in unexpected places. We’ll start with something really simple.
No Objects

The most trivial category is one with zero objects and, consequently, zero morphisms. It’s a very sad category by itself, but it may be important in the context of other categories, for instance, in the category of all categories (yes, there is one). If you think that an empty set makes sense, then why not an empty category?
Simple Graphs

You can build categories just by connecting objects with arrows. You can imagine starting with any directed graph and making it into a category by simply adding more arrows. First, add an identity arrow at each node. Then, for any two arrows such that the end of one coincides with the beginning of the other (in other words, any two composable arrows), add a new arrow to serve as their composition. Every time you add a new arrow, you have to also consider its composition with any other arrow (except for the identity arrows) and itself. You usually end up with infinitely many arrows, but that’s okay.

Another way of looking at this process is that you’re creating a category, which has an object for every node in the graph, and all possible chains of composable graph edges as morphisms. (You may even consider identity morphisms as special cases of chains of length zero.)

Such a category is called a free category generated by a given graph. It’s an example of a free construction, a process of completing a given structure by extending it with a minimum number of items to satisfy its laws (here, the laws of a category). We’ll see more examples of it in the future.

The latest installment in literate explanation of category theory in this series.

Challenges await you at the end of this post.

Enjoy!

28 Dec 07:17

Software Foundations

by Patrick Durusau

Software Foundations by Benjamin Pierce and others.

From the preface:

This electronic book is a course on Software Foundations, the mathematical underpinnings of reliable software. Topics include basic concepts of logic, computer-assisted theorem proving and the Coq proof assistant, functional programming, operational semantics, Hoare logic, and static type systems. The exposition is intended for a broad range of readers, from advanced undergraduates to PhD students and researchers. No specific background in logic or programming languages is assumed, though a degree of mathematical maturity will be helpful.

One novelty of the course is that it is one hundred per cent formalized and machine-checked: the entire text is literally a script for Coq. It is intended to be read alongside an interactive session with Coq. All the details in the text are fully formalized in Coq, and the exercises are designed to be worked using Coq.

The files are organized into a sequence of core chapters, covering about one semester’s worth of material and organized into a coherent linear narrative, plus a number of “appendices” covering additional topics. All the core chapters are suitable for both graduate and upper-level undergraduate students.

This looks like a real treat!

Imagine security in a world where buggy software (by error and design) wasn’t patched by more buggy software (by error and design) and protected by security software, which is also buggy (by error and design). Would that change the complexion of current security issues?

I first saw this in a tweet by onepaperperday.

PS: Sony got hacked, again. Rumor is that this latest Sony hack was an extra credit exercise for a 6th grade programming class.

26 Dec 06:44

Cartographer: Interactive Maps for Data Exploration

by Patrick Durusau

Cartographer: Interactive Maps for Data Exploration by Lincoln Mullen.

From the webpage:

Cartographer provides interactive maps in R Markdown documents or at the R console. These maps are suitable for data exploration. This package is an R wrapper around Elijah Meeks’s d3-carto-map and d3.js, using htmlwidgets for R.

Cartographer is under very early development.

Data visualization enthusiasts should consider the screen shot used to illustrate use of the software.

What geographic assumptions are “cooked” in that display? Or are they?

Screenshot makes me think data “exploration” is quite misleading. As though data contains insights that are simply awaiting our arrival. On the contrary, we manipulate data until we create one or more patterns of interest to us.

Patterns of non-interest to us are called noise, gibberish, etc. That is to say there are no meaningful patterns aside from us choosing patterns as meaningful.

If data “exploration” is iffy, then so are data “mining” and data “visualization.” All three imply there is something inherent in the data to be found, mined or visualized. But, apart from us, those “somethings” are never manifest and two different people can find different “somethings” in the same data.

The different “somethings” implies to me that users of data play a creative role in finding, mining or visualizing data. A role that adds something to the data that wasn’t present before. I don’t know of a phrase that captures the creative interaction between a person and data. Do you?

In this particular case, the “cooked” in data isn’t quite that subtle. When I say “United States,” I don’t make a habit of including parts of Canada and a large portion of Mexico in that idea.

Map displays often have adjacent countries displayed for context but in this mapping, data values are assigned to points outside of the United State proper. Were the data values constructed on a different geographic basis than the designation of “United States?”

26 Dec 06:42

historydata: Data Sets for Historians

by Patrick Durusau

historydata: Data Sets for Historians

From the webpage:

These sample data sets are intended for historians learning R. They include population, institutional, religious, military, and prosopographical data suitable for mapping, quantitative analysis, and network analysis.

If you forgot the historian on your shopping list, you have been saved from embarrassment. Assuming they are learning R.

At least it will indicate you think they are capable of learning R.

If you want a technology or methodology to catch on, starter data sets are one way to increase the comfort level of new users. Which can have the effect of turning them into consistent users.

26 Dec 06:35

DL4J: Deep Learning for Java

by Patrick Durusau

DL4J: Deep Learning for Java

From the webpage:

Deeplearning4j is the first commercial-grade, open-source deep-learning library written in Java. It is meant to be used in business environments, rather than as a research tool for extensive data exploration. Deeplearning4j is most helpful in solving distinct problems, like identifying faces, voices, spam or e-commerce fraud.

Deeplearning4j integrates with GPUs and includes a versatile n-dimensional array class. DL4J aims to be cutting-edge plug and play, more convention than configuration. By following its conventions, you get an infinitely scalable deep-learning architecture suitable for Hadoop and other big-data structures. This Java deep-learning library has a domain-specific language for neural networks that serves to turn their multiple knobs.

Deeplearning4j includes a distributed deep-learning framework and a normal deep-learning framework (i.e. it runs on a single thread as well). Training takes place in the cluster, which means it can process massive amounts of data. Nets are trained in parallel via iterative reduce, and they are equally compatible with Java, Scala and Clojure, since they’re written for the JVM.

This open-source, distributed deep-learning framework is made for data input and neural net training at scale, and its output should be highly accurate predictive models.

By following the links at the bottom of each page, you will learn to set up, and train with sample data, several types of deep-learning networks. These include single- and multithread networks, Restricted Boltzmann machines, deep-belief networks, Deep Autoencoders, Recursive Neural Tensor Networks, Convolutional Nets and Stacked Denoising Autoencoders.

For a quick introduction to neural nets, please see our overview.

There are a lot of knobs to turn when you’re training a deep-learning network. We’ve done our best to explain them, so that Deeplearning4j can serve as a DIY tool for Java, Scala and Clojure programmers. If you have questions, please join our Google Group; for premium support, contact us at Skymind. ND4J is the Java scientific computing engine powering our matrix manipulations.

And you thought I write jargon laden prose. ;-)

This both looks both exciting (as a technology) and challenging (as in needing accessible documentation).

Are you going to be “…turn[ing] their multiple knobs” over the holidays?

GitHub Repo

Tweets

#deeplearning4j @IRC

Google Group

I first saw this in a tweet by Gregory Piatetsky.

26 Dec 06:03

Underhyped – Big Data as an Advance in the Scientific Method

by Patrick Durusau

Underhyped – Big Data as an Advance in the Scientific Method by Yanpei Chen.

From the post:

Big data is underhyped. That’s right. Underhyped. The steady drumbeat of news and press talk about big data only as a transformative technology trend. It is as if big data’s impact goes only as far as creating tremendous commercial value for a selected few vendors and their customers. This view could not be further from the truth.

Big data represents a major advance in the scientific method. Its impact will be felt long after the technology trade press turns its attention to the next wave of buzzwords.

I am fortunate to work at a leading data management vendor as a big data performance specialist. My job requires me to “make things go fast” by observing, understanding, and improving big data systems. Specifically, I am expected to assess whether the insights I find represent solid information or partial knowledge. These processes of “finding out about things”, more formally known as empirical observation, hypothesis testing, and causal analysis, lie at the heart of the scientific method.

My work gives me some perspective on an under-appreciated aspect of big data that I will share in the rest of the article.

Searching for “big data” and “philosophy of science” returns almost 80,000 “hits” today. It is a connection I have not considered and if you know of any survey papers on the literature I would appreciate a pointer.

I enjoyed reading this essay but I don’t consider tracking medical treatment results and managing residential heating costs as examples of the scientific method. Both are examples of observation and analysis that is made easier by big data techniques but they don’t involve testing any hypotheses, prediction, testing, causal analysis.

Big data techniques are useful for such cases. But the use of big data techniques for all the steps of the scientific method, observation, formulation of hypotheses, prediction, testing and casual analysis, would be far more exciting.

Any pointers to use uses?

19 Dec 18:04

XQuery, XPath, XQuery/XPath Functions and Operators 3.1

by Patrick Durusau

XQuery, XPath, XQuery/XPath Functions and Operators 3.1 were published on 18 December 2014 as a call for implementation of these specifications.

The changes most often noted were the addition of capabilities for maps and arrays. “Support for JSON” means sections 17.4 and 17.5 of XPath and XQuery Functions and Operators 3.1.

XQuery 3.1 and XPath 3.1 depend on XPath and XQuery Functions and Operators 3.1 for JSON support. (Is there no acronym for XPath and XQuery Functions and Operators? Suggest XF&O.)

For your reading pleasure:

XQuery 3.1: An XML Query Language

    3.10.1 Maps.

    3.10.2 Arrays.

XML Path Language (XPath) 3.1

  1. 3.11.1 Maps
  2. 3.11.2 Arrays

XPath and XQuery Functions and Operators 3.1

  1. 17.1 Functions that Operate on Maps
  2. 17.3 Functions that Operate on Arrays
  3. 17.4 Conversion to and from JSON
  4. 17.5 Functions on JSON Data

Hoping that your holiday gifts include a large box of highlighters and/or a box of red pencils!

Oh, these specifications will “…remain as Candidate Recommendation(s) until at least 13 February 2015. (emphasis added)”

Less than two months so read quickly and carefully.

Enjoy!

I first saw this in a tweet by Jonathan Robie.