How do such companies as Netflix, Dropbox, Uber, Slack, and others keep on track and withstand the modern market? We know the answer! Performance metrics, benchmarking, and analytics are magic beans for successful SaaS companies.
“Metrics are merely a reflection of the product strategy that you have in place. Data is powerful because it is concrete. For many entrepreneurs, particularly with technical backgrounds, empirical data can trump everything else – best practices, guys with fancy educations and job titles – and for a good reason. It’s really the skeptic’s best weapon, and it’s been an essential tool in helping startups solve problems in new and innovative ways.” (Andrew Chen, Rider Growth Lead at Uber)
SaaS as IT market driver
In a nutshell, SaaS (Software as a Service) means software provided by one or more vendors remotely based on subscription. For the last few years, SaaS has been known as one of the most zooming IT markets.
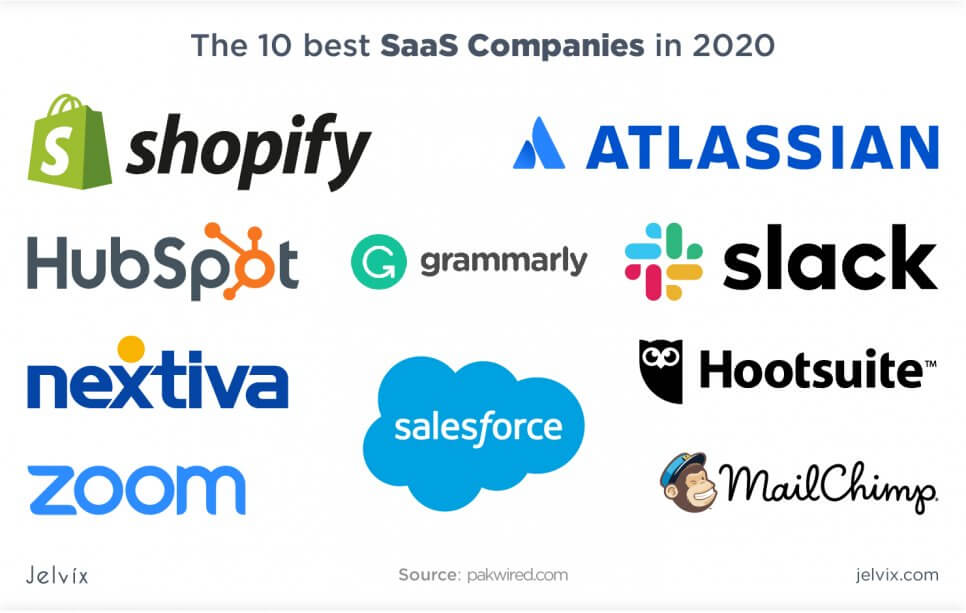
According to Gartner’s forecast, subscription-based software will keep growing and will reach USD 364 million in 2022 through the scalability of the SaaS revenue model and will remain the largest IT market segment. The lockdown due to COVID-19 this year has forced the demand for collaboration tools with better features and work speed. This resulted in a higher interest in SaaS offers worldwide.
Using data metrics in SaaS
Jelvix helps SaaS clients to identify points of growth and reduction marks with the help of key metrics interpretation. Measuring and explication of performance show opportunities and help to spare resources efficiently.
In this blog, we aim to elucidate an approach to SaaS measurements and explain which metrics you need to scale and when.
To develop an advantageous strategy of growth and reveal success points, the team needs to understand what SaaS metrics are, know the types of metrics, track them habitually, and learn how to get insights from the analytics.
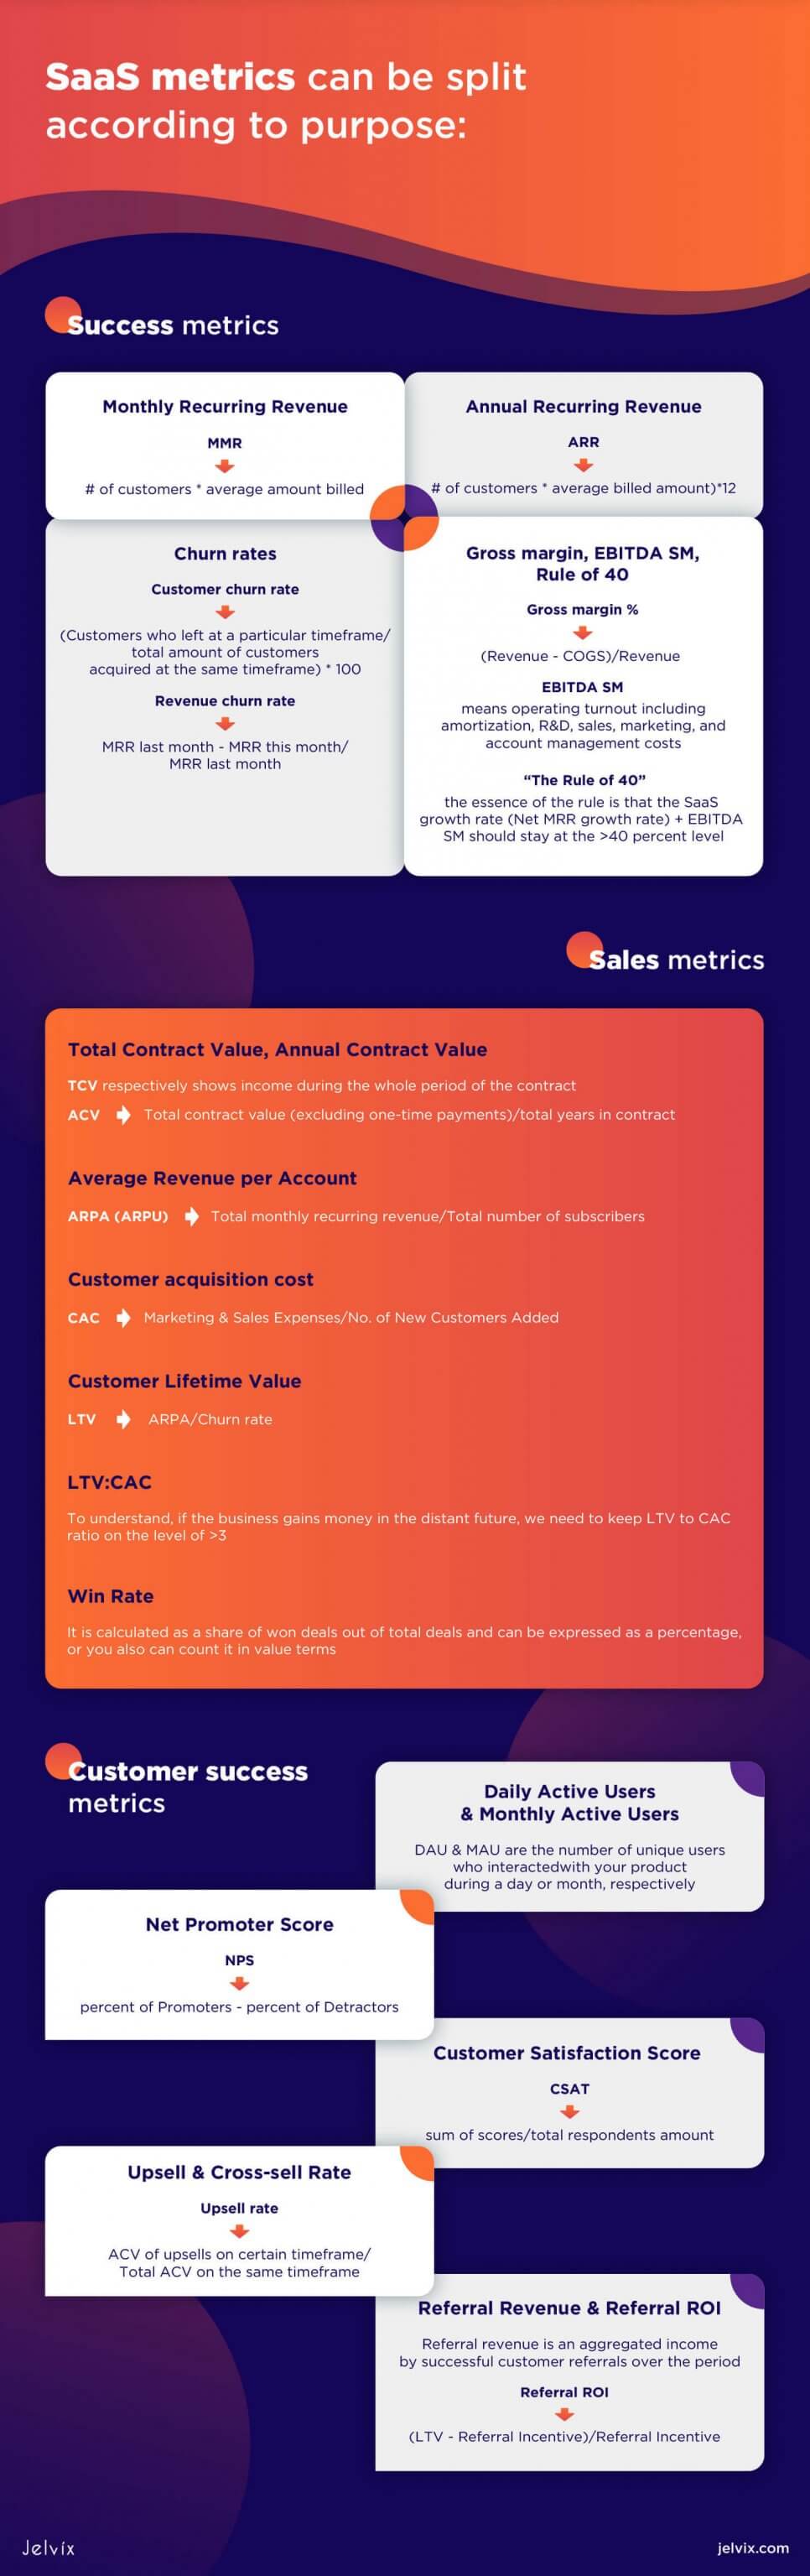
SaaS metrics can be split according to their purpose:
- Success metrics
- Sales metrics
- Customer success metrics
Let’s intently look at every group.
Success metrics
We gathered here a list of key metrics for SaaS companies that reflect the big picture of your business – combining SaaS financial metrics, sales, customer success, and marketing figures. With this list of SaaS metrics, you can quickly get the information about general performance and where to develop further:
- MRR, Monthly recurring revenue
- Annual Recurring Revenue (ARR)
- Churn rates
- Gross margin, COGS, EBITDA SM, Rule of 40
MRR, Monthly recurring revenue
MRR shows recurring revenue per month and is one of the vital metrics that should be tracked in SaaS reporting. We recommend paying attention to this one if your business model primarily intends a monthly subscription. This index helps to generalize all subscription plans to a single number tracked monthly.
Formula:
MRR = number of customers * average amount billed
10 customers * $100 per month = $1,000 MRR
Annual Recurring Revenue (ARR)
ARR is pretty much the same as MRR but primarily used for companies with yearly subscription plans. However, both MRR and ARR are important.
Annual Recurring Revenue is calculated by multiplying MRR by 12 (months), which results in yearly income.
Formula:
ARR =( # of customers * average billed amount)*12
(10 customers * $100/month)*12 = $12,000 ARR
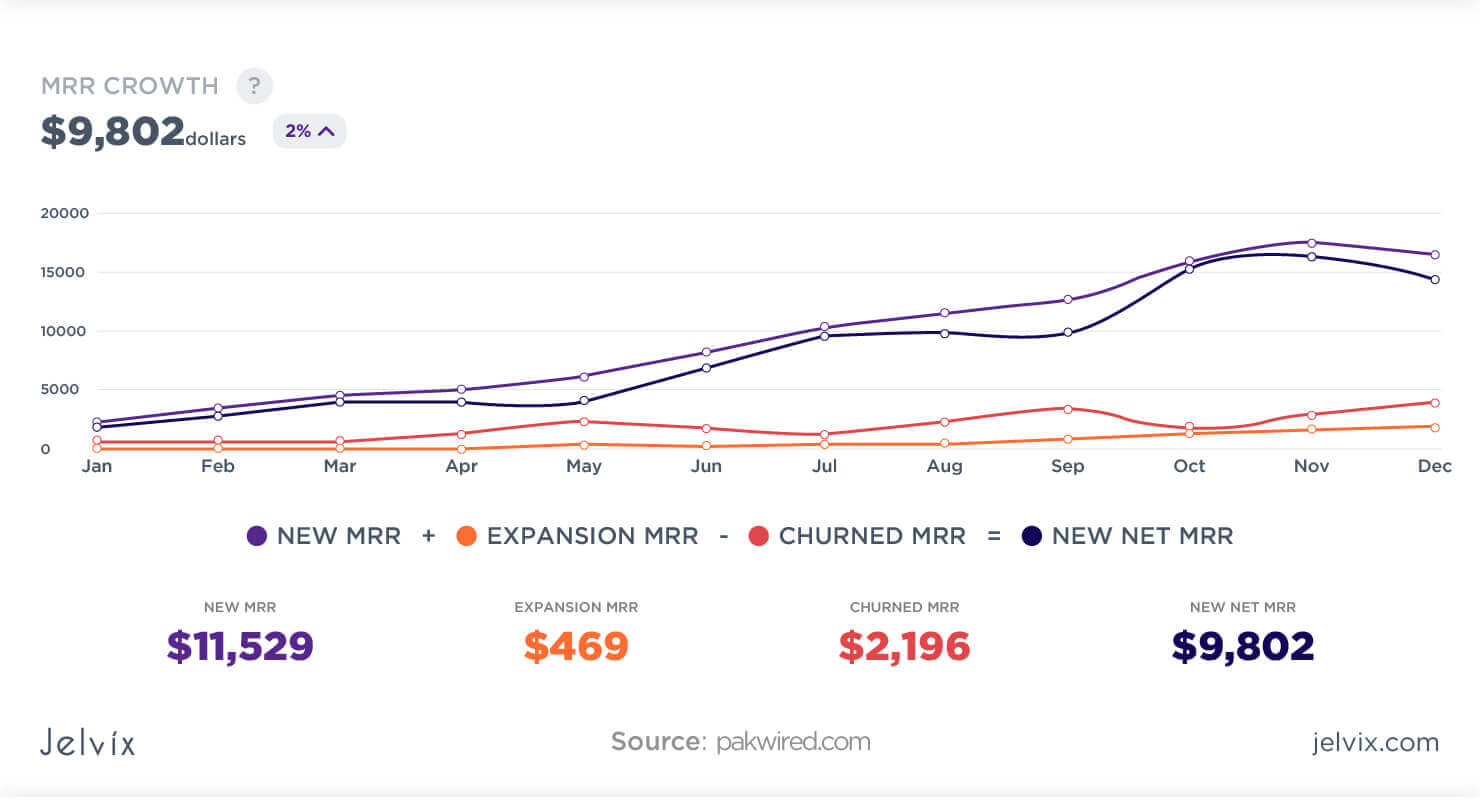
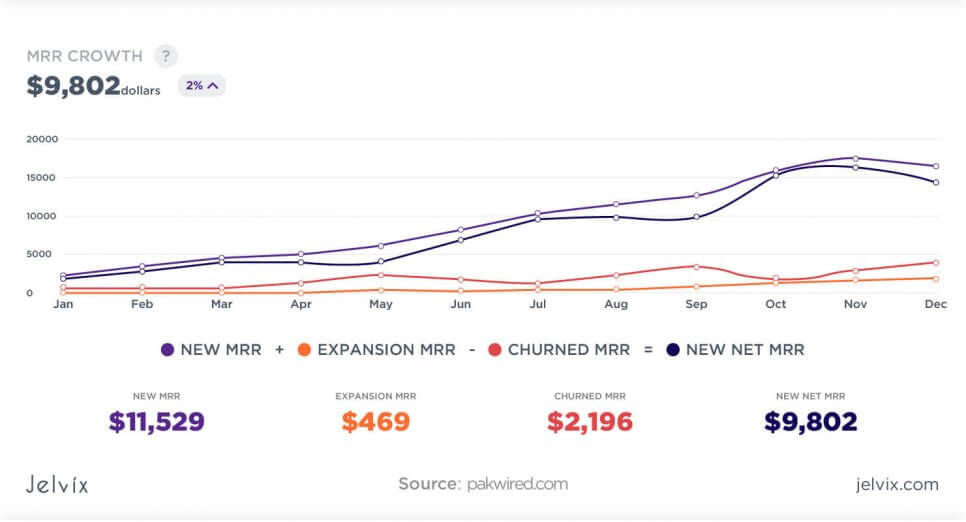
MRR (ARR): Net and Growth rate
A few components affect the MRR or ARR dynamics (depending on the period under review), summing up the value from different sources and forming Net MRR (ARR):
- New MRR (ARR) – stats of added revenue;
- Churned MRR (ARR) – stats of unsubscriptions. This can be a negative number;
- Expansion MRR (ARR) – stats of extended subscriptions;
- Contraction MRR (ARR) – stats of downgraded subscriptions. This can be a negative number;
- Reactivation MRR (ARR) – stats of revenue gained from previously churned customers who returned.
Summing this up, we can get an all-embracing MRR figure which indicates the company’s growth:
Net MRR Growth Rate
Formula:
MRR Growth rate, % = (Net MRR month 2 – Net MRR month 1) / Net MRR month 1 * 100
Churn rates
SaaS revenue is evenly allocated along the customer lifecycle while sales costs are spent upfront, which causes the necessity of setting up suitable metrics for customer churn. Due to the business’s recurring nature, SaaS is supposed to gain revenue as long as the customer stays with the service.
Customer churn rate
As you can figure, the Customer churn rate indicates the number of customers who left after signing on. This metric can be used as one of the SaaS marketing metrics. Learning more about churned customers means gathering feedback, competitor analytics, and taking steps to fit customers’ expectations.
Formula:
Customer churn rate = (Customers who left at a particular timeframe/total amount of customers acquired at the same timeframe)*100
Example:
This month you got 200 customers and 5 customers who left. This makes a churn rate of 2,5%
Besides monthly figures, Annual customer churn is essential too. The reason for that is simple – you can set an acceptable figure for monthly churn and miss the fact that over the year, it will turn into a disaster.
For example, the Monthly churn rate at a level of 5% will turn into a terrifying 54% on a 12-month basis.
Formula:
Annual customer churn rate = (1 – Monthly churn rate)*12
Example:
(1 – 0,05)*12= 54%
Revenue churn rate
We also allocate Revenue churn rate, or MRR churn rate, as one of the key SaaS metrics. It indicates the rate of lost MRR due to subscriptions downgrade and unsubscribed customers. To count that, we divide the difference between the MRR of the last period and the current MRR to the last month’s MRR.
Formula:
Revenue churn rate = MRR last month – MRR this month/MRR last month
Example:
November MRR = $9 000, December MRR = $8 750, Revenue churn rate will be 9000-8750/9000 = 2,7% or $250
All these examples are pretty simple, although in real business, churn calculations could be more complicated as we have to take into account upsells, various pricing packs, etc. Thereby, the revenue churn rate can be negative, while the customer churn rate is positive. For instance, there was a churned customer and an upsell in the same month. So we have to use the interconnection of SaaS metrics to see the clear picture.
Gross margin, EBITDA SM
Gross margin is a revenue ratio left after the withdrawal of costs for customer acquisition and service. These costs are also called Cost of Goods Sold (COGS), and in SaaS, they usually contain spendings on customer support, hosting fees, third-party services payments, etc.
General formula:
Gross margin %: (Revenue – COGS)/Revenue
Gross margin is one of the most common business metrics, and you can find detailed consistency of it in SaaS here:
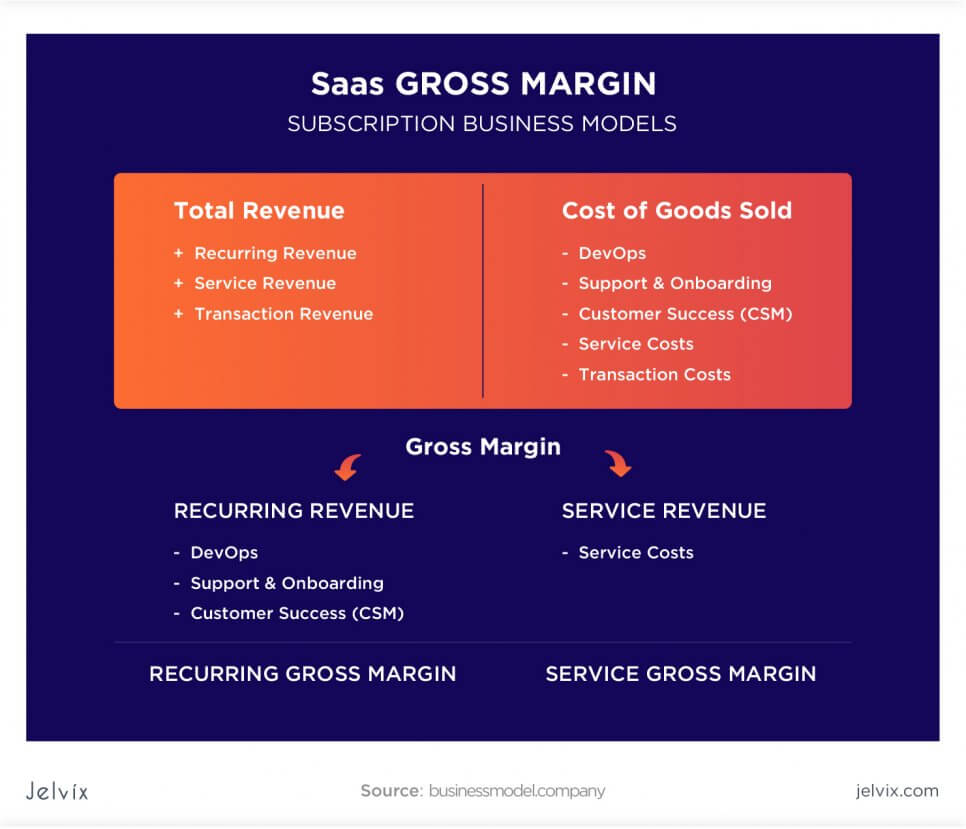
A distinguishing mark of the SaaS business model is the ability to indefinitely gain customers keeping COGS on relatively the same level, which leads to higher gross margins in this business.
EBITDA SM (earnings before interest, taxes, depreciation, amortization, sales, and marketing) means operating turnout, including amortization, R&D, sales, marketing, and account management costs.
The common performance benchmark for the overall software business is to follow the 40% rule.
“The Rule of 40”
Sticking to this rule is a way to keep the company “healthy.” The essence of the rule is that the SaaS growth rate (Net MRR growth rate) + EBITDA SM should stay at the >40 percent level. Let’s check some examples to clarify.
- If the company is growing 20 percent (growth rate), it should generate a 20 percent profit (EBITDA SM) for the same period, which makes 40 percent.
- If the growth rate is 40 percent, it is acceptable to have a 0 percent profit for the same period.
- If the growth rate is 50 percent, then losses at the level of 10 percent wouldn’t crush the business.
Following the rule of 40 gives impressive results.
Sales metrics: how to measure sales growth?
Splitting key SaaS metrics into groups is a way to distinguish instruments for measuring different edges of a profitable business. So let’s turn to SaaS sales. Roughly SaaS sales process looks like this:
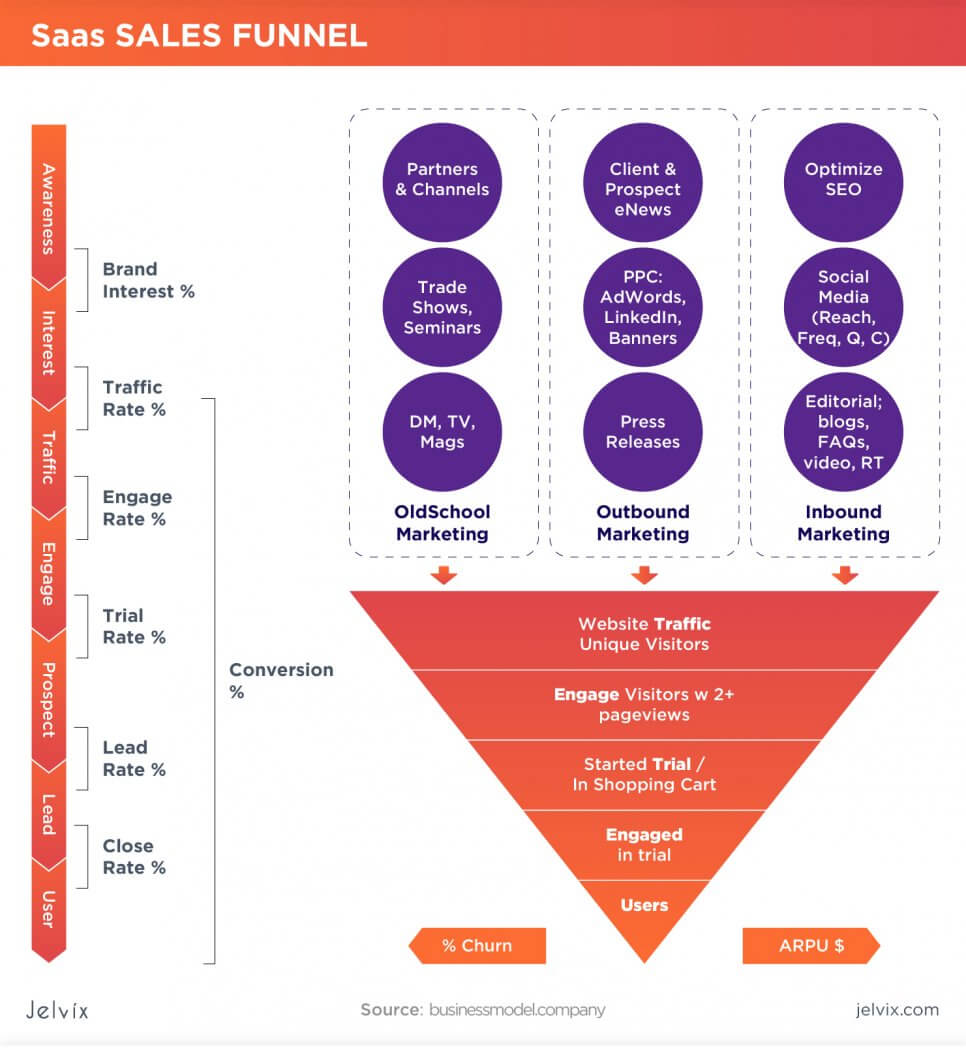
A successful SaaS sale is a topic for another blog post. Here we want to explain the key SaaS sales metrics revealing insights regarding your sales team efficiency, the validity of the pricing model, and most importantly – the customer lifetime with your service.
List of metrics:
- Total Contract Value (TCV), Annual Contract Value (ACV)
- Average Revenue per Account (ARPA)
- Customer acquisition cost (CAC)
- Customer Lifetime Value (LTV)
- LTV: CAC
- Win Rate
Total Contract Value (TCV), Annual Contract Value (ACV)
Annual Contract Value represents annual income per contract. Total Contract Value respectively shows income during the whole period of the contract.
Formula:
ACV = total contract value (excluding one-time payments) / total years in contract
Let’s see an example:
There are three customers with the following plans paying yearly:
Customer A: $800/year for 1 year
Customer B: $700/year for 2 years
Customer C: $600/year for 3 years
Then, ACV for year 1 will be:
($800+$700+$600)/3 = $ 700
ACV for year 2 will be lower because there are two customers in the contract:
($700+$600)/2 = $650
Third-year ACV will be the lowest:
($600)/1 = $600
TCV, in this case, will be $800 for Customer A, $1400 for Customer B, and $1800 for Customer C.
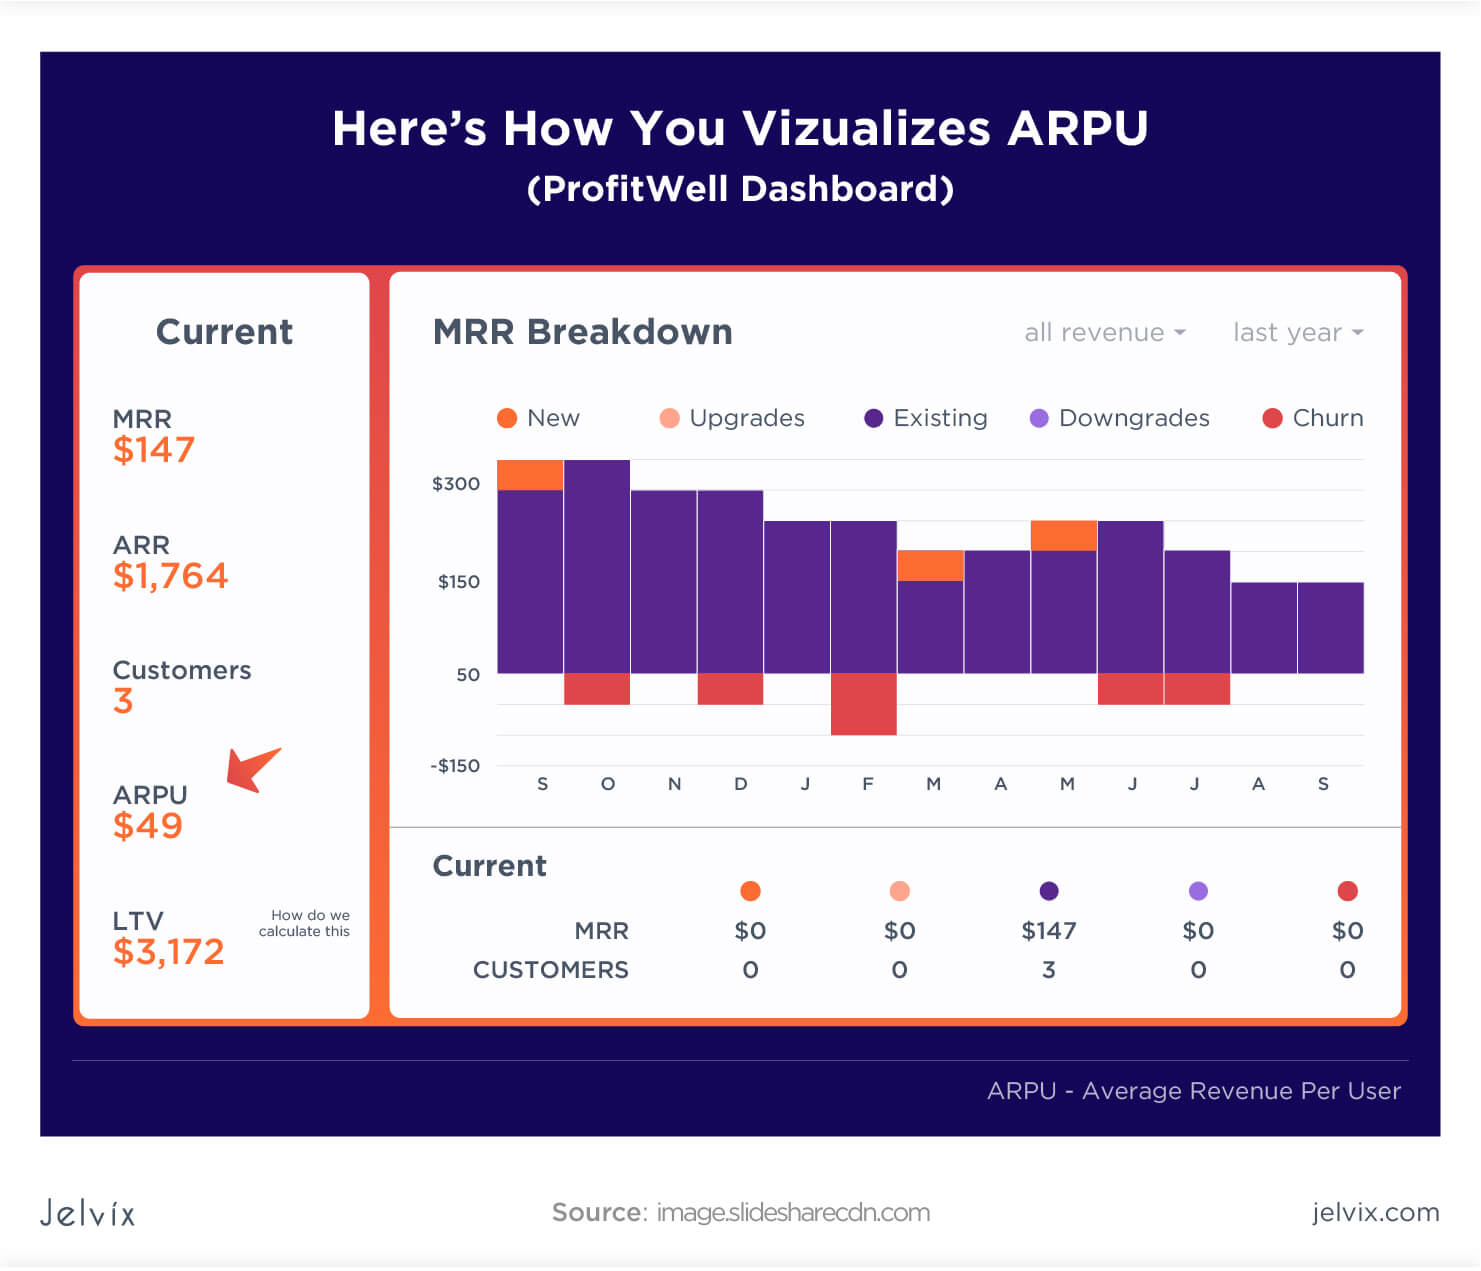
Average Revenue per Account (ARPA)
One of the aspects we help our customers to investigate is business viability. Average Revenue Per Account is one of the operational metrics, and it indicates how much revenue is committed by a “standard” customer. It is also reasonable to implicate this metric to new and existing customers separately to see their behavior and reveal patterns.
ARPA can also be modified into ARPU or The Average Revenue Per Unit.
Formula:
ARPA (ARPU) = Total monthly recurring revenue/Total number of subscribers
As an example, check how ARPU can be visualized:

Customer acquisition cost (CAC)
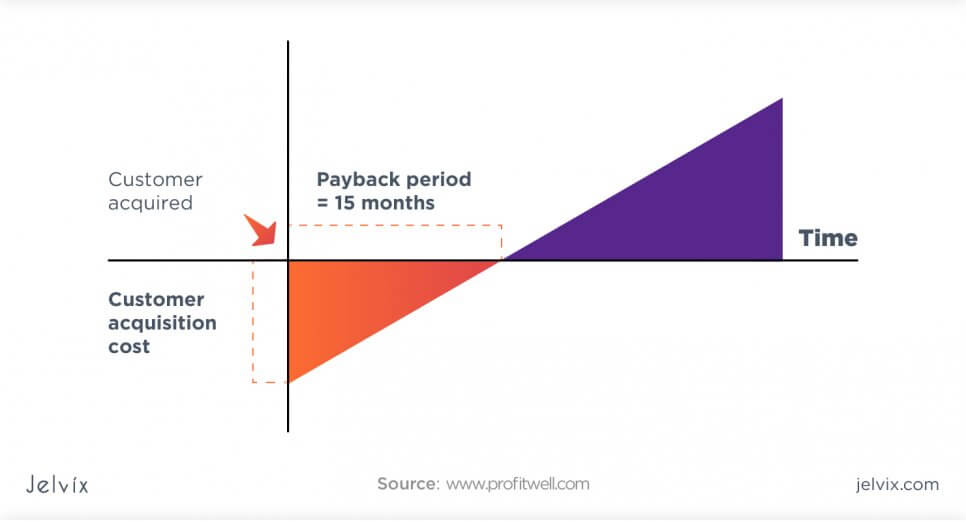
Customer acquisition cost is one of the growth metrics especially important for SaaS during the early stage of development. This business model faces significant expenses upfront to acquire customers in the growing phase, while the profit from investments returns for a long time. At the moment, when profit from existing customers covers the cost of new client acquisition – your company gets over this period and turns profitable.
Formula:
CAC = Marketing & Sales Expenses / No. of New Customers Added
Namely, customer acquisition cost indicates the cost of single customer acquisition and can be fractured into three types:
- Blended CAC: this index reflects the amount you spend on marketing and sales to acquire 1 customer;
- Paid CAC indicates your spending on paid campaigns for single customer acquisition;
- CAC payback period (months) shows how much time it takes to cover the costs of signed customer acquisition. It is counted by dividing CAC by MRR per customer.
Customer Lifetime Value (LTV or CLTV, CLV)
Customer Lifetime Value – this metric represents the total revenue brought by customers during the whole subscription period.
We advise paying attention to LTV as it gives two valuable insights:
- the volume of revenue generated by every customer;
- the time when the customer is generating that revenue.
Knowing this information, we can improve retention strategies by concentrating on holding those customers who bring more value for a more extended period.
Formula:
LTV = ARPA / Churn rate
(if you take the monthly Churn rate, then the ARPA should be taken on a monthly level as well)
LTV: CAC
To gauge business scalability, we need to mix SaaS metrics and explore existing business models, offer relevance, and cost-value ratio. One of the cases, when metrics are more meaningful when combined, is LTV and CAC.
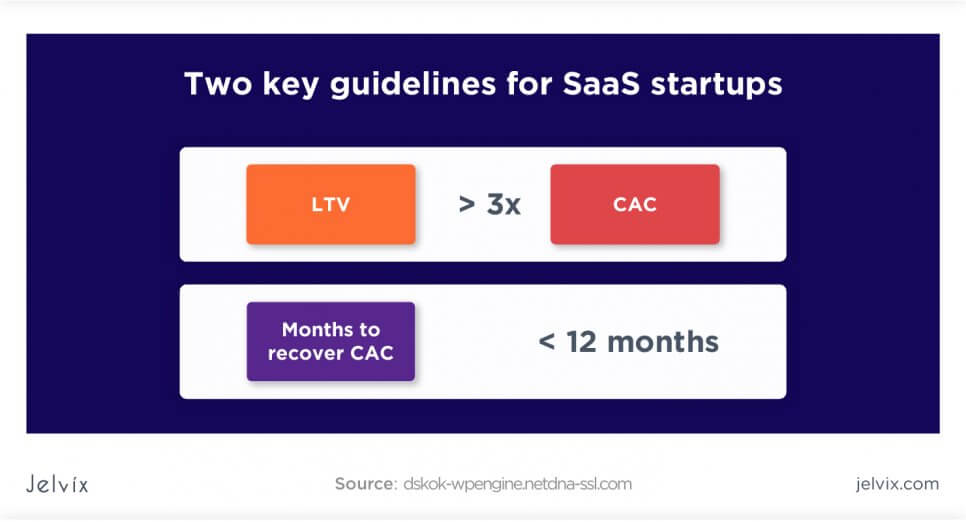
To understand if the business will gain money in the distant future, we need to keep LTV to CAC ratio on the level of >3.
If a company is gaining more profit from its customers, than it has spent on acquisition – it is in the safe zone. The associated thing we pay attention to is the time to recover CAC. The aim is to make it less than a year, improve profitability, and get cash as soon as possible.
Win Rate
A simple way to check sales efficiency is to count the rate of won contracts. It is calculated as a share of won deals out of total deals and can be expressed as a percentage, or you can also count it in value terms.
A common benchmark of Win rate ratio = 1 indicates that contract revenues will cover sales and marketing expenses in the next 4 quarters. Although, there is a huge matter of the types of leads (whether they came from referrals or organic search), deal sizes, etc.
Customer success metrics
Another important point we have to consider while speaking about SaaS success metrics is customer retention. Does your product have all features to satisfy customers’ needs? How do users interact with your service or product? What do they want to get from it? Getting to know customers can open wide opportunities for upselling as well as giving ideas on how to improve the product itself.
We advise you to look at these main metrics which will help you to systematize data about your customers:
- Daily Active Users and Monthly Active Users (DAU and MAU)
- Net Promoter Score (NPS)
- Customer Satisfaction Score (CSAT)
- Upsell & Cross-sell Rate
- Referral Revenue and Referral ROI
Daily Active Users and Monthly Active Users
DAU and MAU are simply the number of unique users who interacted with your product during a day or a month, respectively. The most important thing here is to define what will be counted as a “user”: one who logged in today, one who spent some time in the application, one who clicked a particular button, you name it.
Tracking this metric can indicate if everything is right and people are using software routinely. If the number of active users drops, it should be a signal that something went wrong, and the product should be checked.
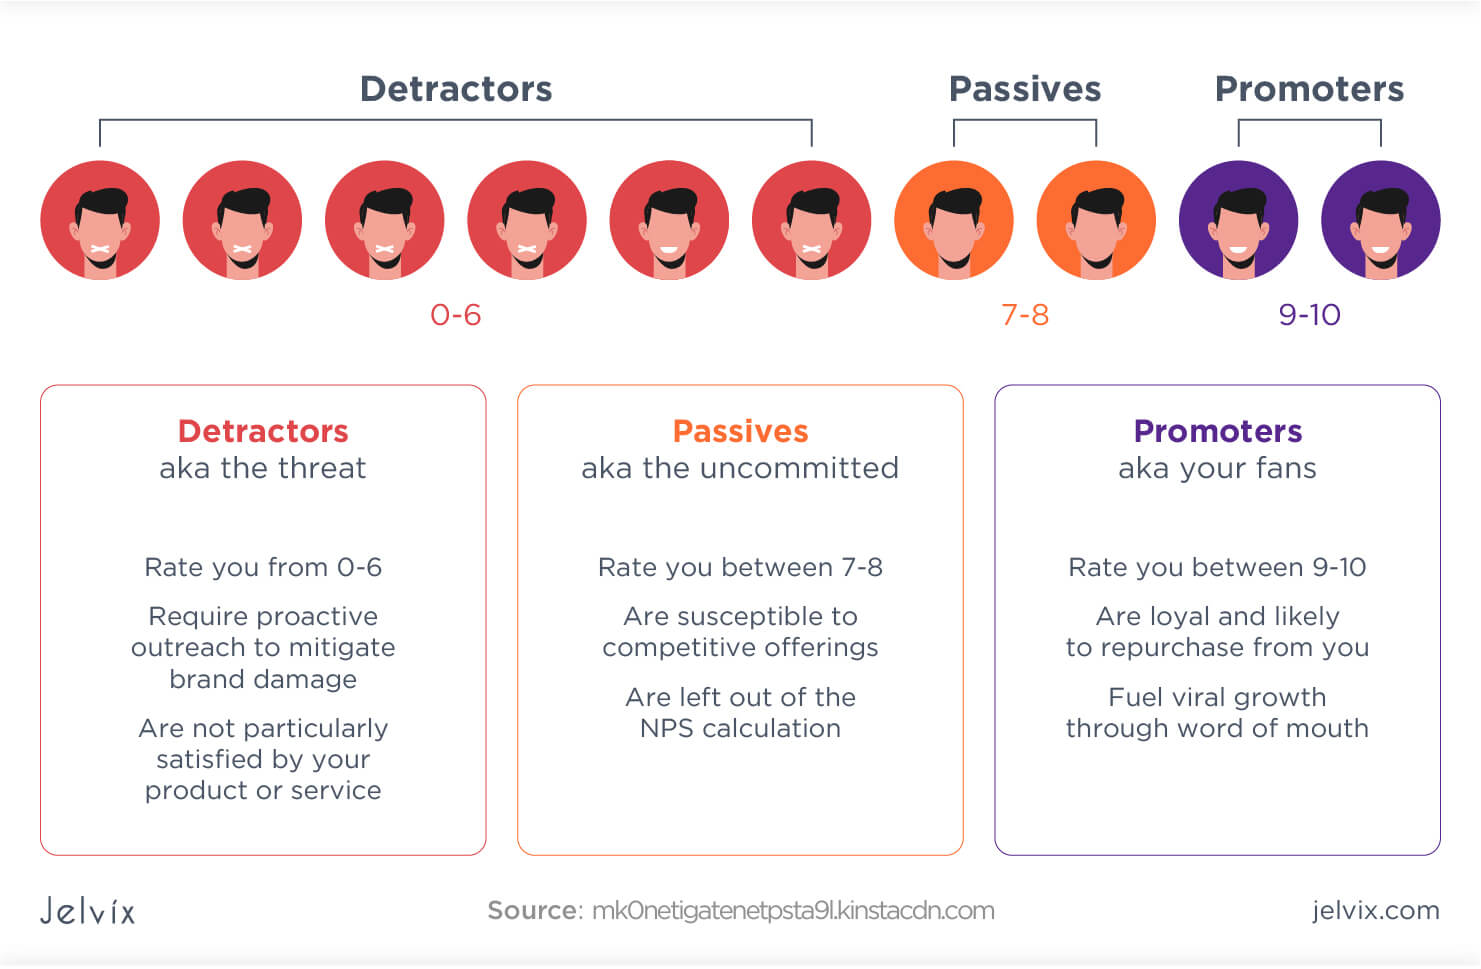
Net Promoter Score (NPS)
Working with SaaS analytics, we usually track regular indices. But when talking about clients, we need to research customer experience using NPS.
To make it simple, Net Promoter Score asks a single question about the possibility of recommending a service/brand to a friend or a colleague. Respondents answer by choosing possibilities from 0 to 10.
Based on the answers to this questionnaire, we divide the customers into three groups:
- Detractors – people who don’t like the service;
- Passives – those who are indifferent;
- Promoters – people who like and would be happy to recommend the service.
Formula:
NPS = percent of Promoters – percent of Detractors
The ideal goal is to have as many Promoters as possible. Based on Net Promoter Score, companies can develop specific activities for each group to encourage and uphold customers.

Customer Satisfaction Score (CSAT)
While NPS measures general customer satisfaction, CSAT is used to get user thoughts about particular features of the product. To count CSAT, the users are asked to rate the product and/or its features on the scale (1-3, 0-7, 1-10, etc.).
Formula:
CSAT = sum of scores/total respondents amount
Upsell & Cross-sell Rate
These metrics are used to calculate how well existing customers are upgrading their accounts or buying additional services/features.
Formula:
Upsell rate = ACV of upsells in certain timeframe / Total ACV in the same timeframe
The same formula is used to calculate the cross-sell rate.
Referral Revenue and Referral ROI
Referral revenue is an aggregated income by successful customer referrals over the period. To gain insights from this figure, it should be compared to the number of investments to the referral program.
Involving people in referral programs is one of the cost-effective ways to generate leads. Customers not only bring revenues for their contracts but also get into inviting new users. Referral ROI reveals how much the company will generate during the LTV for each dollar spent on the referral program. We can count the amount spent on referrals and compare it to potential referral revenues:
Formula:
Referral ROI = (LTV – Referral Incentive) / Referral Incentive
For instance, an average customer pays $800 per month for a lifetime of 24 months.
LTV = $800 * 24 = 19,200
The referral program implies an offer of -20% of the monthly charge for both the user and the one he invites ($800*0.2 = $160) for 12 months.
So cost of referral proposition incentive is ($160*12)+($160*12) = $3840
Referral ROI = ($19200 – $3840) / $3840 = 4
So the company is gaining $4 for each $1 spent on the referral program. Not bad.
Marketing management: how much should a company spend on marketing?
It is a common question we get from SaaS clients, how much and when to spend on marketing. Taking into account the upfront spending, company management wants to play safely in this field.
The usual benchmark would be: 10% ratio from general revenue can be spent on marketing. But practically, we realized two additional pillars to pay attention to while estimating marketing spends:
- Average deal size and company size;
- Compare planned spending to new orders, not revenues.
There is no multipurpose recipe regarding marketing spending. Talking to our clients, we often see that they are too optimistic about their CAC level. Primarily our advice is to review different channels that are used and figure out the most effective and reasonable ones. By doing this, we can identify senseless spending and optimize marketing costs.
Another way for SaaS to see if they spend enough on marketing is to compare themselves to companies of similar size and type of product.
SaaS benchmarking
What does “good” look like? We track a lot of metrics, but how do we know if everything goes as it has to? It is a challenging task to figure out how much and where to invest for maximum ROI.
Benchmarking is a path, not a strict guideline. There are many topical articles and figures that are useful for reports and as input at strategic sessions. Generally, you can find Benchmarking reports with generic data.
In Jelvix, we anticipate ways to improve business performance and marketing effectiveness for our clients. We can work out benchmarks and SaaS KPIs for every stage of SaaS business development. Contact us for benchmarking tips!
Conclusion
SaaS valuation metrics serve one goal: to help you make optimal decisions to drive your business. It can be a compass pointing in the right direction of causes, growth opportunities, and ultimate solutions.
SaaS business is all about the customer’s lifecycle. Each phase of business development and every stage of customer involvement is countable and can be tracked. Aggregation of all data and wise usage of the figures gathered can give a push for another successful world-known business.
We hope that the above information gave you an idea about SaaS measurement. If you have any thoughts – join the discussion or drop us a message.
The post The Ultimate Guide to SaaS Metrics appeared first on Jelvix.