Shared posts

16 Jul 18:13

Japanese earthquake literally made waves in Norway

by Scott K. Johnson
Aurlandsfjord, Norway, where seiches were observed.

During an earthquake, it’s the area near the epicenter that sustains the greatest damage, though shaking can sometimes be perceptible at impressive distances. But the seismic energy released by the earthquake actually travels around the globe—several times, in fact—as the planet, in essence, rings like a struck bell. The bigger the earthquake, the louder it rings. And the magnitude 9.0 quake that struck just off the coast of Japan on March 11, 2011 was very big, indeed.

Scientific instruments like seismometers are sensitive enough to pick up seismic waves from distant earthquakes, even on their second or third trip around the planet. (Satellites have even detected the accompanying atmospheric waves.) It doesn’t always take super-precise measurements to know something is happening, however. A groundwater monitoring well in Virginia made the passage of seismic waves from the 2011 Tohoku earthquake quite clear in the form of a rapid two foot rise in water level.

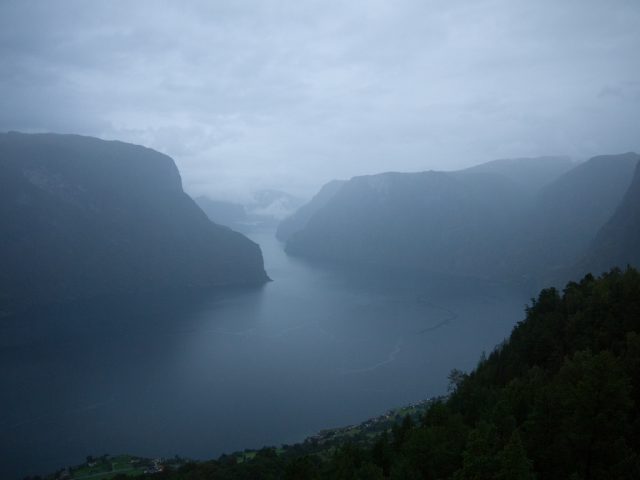
While the tsunami that accompanied the earthquake in Japan was devastating, waves of a very different sort were spawned far away—in the fjords of Norway. A number of witnesses noticed the strange waves, occurring as they did on a calm morning when the fjord waters were otherwise smooth. As some managed to capture on video, the water swelled and ebbed by as much as five feet once per minute or so for several hours—starting about half an hour after the earthquake in Japan.

Read 9 remaining paragraphs | Comments

    
24 Jun 16:07

Announcing: Keyboards with crunch

by esr

I’ve founded a G+ community for fans of the Model M and other buckling-spring keyboards. Here it is:

Keyboards with crunch

Buckling-spring keyboards are wonderful devices for the discriminating hacker, vastly superior to the mushy dome-switch devices more common these days. But for various reasons (including the mere fact that they contain a lot of mechanical switches) they can be tempermental beasts requiring a bit of troubleshooting and care.

This community is for people who want to know how to find, care for, and troubleshoot their clicky keyboards.

UPDATE: After research and feedback, the name is now “Tactile Keyboards”.

20 Jun 03:33

Dance, Factors, Dance

by Stephen Von Worley

Upon first sight of Brent Yorgey’s brilliant Factorization Diagrams, I knew that I should take his lovely little dots and make them dance.

Our first tango would be inspired by the digital clock, with a separate diagram for each of hours, minutes, and seconds. For example, we’d portray 4:34:27 am like so:

4:34:27 on the Factor Clock

One night, plans discreetly set, we stole away, rendezvoused, and had our fun prancing about. But alas, what the encounter had in grace, it begged for drama. Quite simply, there wasn’t enough panache – dynamic range – because while hours go up to 23, and minutes and seconds to 59 (*), the diagrams don’t really start cooking until they reach the triple digits. And, per the choreography, zero maps to a motionless blank space, or, if represented by an alternate step, a stray left foot in a square clog, staggering unnaturally amongst the positive, round-slippered wholes.

So, instead, we practiced the best parts of our “clock” routine – the rhythmic movements and snappy transitions – and distilled the remainder to its essence.

Factorization Diagram: 729

And thus was born the Factor Conga: a promenade of primes, composites, and their constituents, arranged with an aesthetically-tuned variation of Yorgey’s rules, one per second.

Please play with the interactive, and do give it a minute to hit its stride. Or whirl there with a tap or two of the fast forward button.

This is what the dance clubs look like on Alpha Centauri.

For various reasons, the original animation topped out at 10,000. Use the unlimited version to enter the device-wedging, battery-burning beyond!

20 Jun 03:31

Beefspace, Revisited

by Stephen Von Worley

Editor’s Note: This article is a recycled concept from several years ago, updated with a new rendering scheme that made it worth sharing again.

A while back, I created two fanciful maps of a hypothetical, earth-penetrating, inverse-squared burger force, as broadcast by the 36,000-plus domestic restaurant locations of the eight largest U.S. fast food chains. Recently, I upgraded my Visualizationator’s speed by a few orders of magnitude, and as a test, I focused it on said beefspace, yielding several new renditions that you might find more delicious than before…

But first, a few changes. In a nod to the reality of hungry humans, we retooled the power-law metric to mirror the long-distance travels of bank notes, per Brockmann’s seminal “Where’s George” study. The colors now represent the three most influential chains at each point, weighted by cumulative force at a 4:2:1 ratio, where black is McDonald’s, red Burger King, yellow Wendy’s, magenta Jack In The Box, periwinkle Sonic, cream Dairy Queen, green Carl’s Jr., and cyan Hardee’s. Together, you can think of these tweaks as elegantly exposing the subtle contours of market dominance, then splattering them with the individual restaurant locations.

To wit, behold, the contiguous United States, viewed through the lens of the beefspace:

The Contiguous United States

Now, let’s zoom into East Texas, Mississippi, and Louisiana:

East Texas, Mississippi, Louisiana

That’s Dallas-Fort Worth at upper left and the Mississippi River delta lower right. Note the outlying clouds of also-ran franchise strength, dotted magenta on Houston’s south side and yellow at Jackson, Mississippi.

Next, please peruse the nebulous burger ecosystem of the southern Piedmont, running northeast from Atlanta, Georgia to Charlotte, North Carolina:

Atlanta To Charlotte

Zooming west and inward, we train our gaze on metropolitan Phoenix and the faint rectangular hints of its primary street grid:

Phoenix, Arizona

And finally, let’s roll the clock back to when all of this business began. Our singular universe, zeptoseconds before the Big Bang:

Beefspace, Singularity

Somewhere in there, as Sagan once said, billions and billions of burgers are waiting to be served!

Thanks to AggData for providing the geolocated store information that made this article possible.

20 Jun 03:13

Viz The Seasons

by Stephen Von Worley

Watch daylight ebb and flow, fog linger and break, and storms bluster and clear in Ken Murphy’s wonderful A History Of The Sky: a calendar-style time-lapse chronicle of the heavens above San Francisco. Learn more from his site, and be sure to immerse yourself in the HD version of his latest full-year video (above).

[A History Of The Sky]

17 Jun 15:29

24 Years After Tiananmen

by Alex Selwyn-Holmes

Iconic Photos’ annual look-back at a nasty and brutish affair.

Stuart-Franklin_2048422b

June 5th is upon us again. In 1989, the Communist government in Beijing marred the date with a brutal and bloody crackdown on pro-democracy protesters gathered on Tiananmen Square.

Last year, I marked the occasion by an interview with Charlie Cole, the photographer who took one of the iconic Tank Man photos. The year before, I remarked upon the Zeligian appearance of a former Chinese prime minister in one of the photos taken on the square. In 2009, I covered various versions of the Tank Man photos. In between, we saw the defacing of the Mao portrait during the protests and a defiant Ai Wei Wei. A profound irony is they cannot access WordPress from China, so I remain, as always, preaching to the choir.

Above is the contact sheet from Stuart Franklin’s version of the Tank Man photos.  His photos nearly risked confiscation by the Chinese police, but Franklin had left moments earlier to cover events at the Beijing University before the police came knocking on the journalists’ hotel. Afterwards his negatives were smuggled out in a packet of tea by a French student who later delivered it to Franklin’s Parisian office. Franklin, working then for Time, won the World Press Photo Award for his coverage.


Filed under: Contact Sheets, Politics Tagged: China, Stuart Franklin, Tiananmen

17 Jun 15:27

Moonrise, Hernandez

by Alex Selwyn-Holmes

This blog has never covered the photos of Ansel Adams before, but as I walked this week in Provence in the shadows of Mount Sainte-Victoire and Pénitents des Mées, I thought long and hard about Ansel’s astonishing career.

20130420-005435.jpg

His photos, ranging from the Yosemite waterfalls in California and the Grand Tetons in Wyoming, sang the ballads of American wilderness. Both via his majestic black and white photos and tireless campaigns, Ansel had revitalized the Sierra Club. Here, his son, Michael, recalls a trip he took with his father — then on an assignment from the Department of the Interior — a trip on which Ansel Adams captured one of his most famous pictures, that of “the expansive heavens stretching above the cemetery of a tiny Western town” in Hernedez, New Mexico:

[It is] probably Ansel’s most famous picture. And I was very fortunate to be there when it was taken. I was seven years old. We were coming back to Santa Fe from north, and Ansel saw this image. He pulled the car off the road very rapidly, got out — got us — there were two of us also with him, and we were trying to get the tripod, and he got the camera on it, and he had made the — looked at the picture and then he wanted his exposure meter, but he couldn’t find it. So, he knew that the luminance of the moon was 250 foot-candles, and from that, he derived the exposure. He took that picture, put the slide back in the film holder, turned the film holder around. Before he could pull the slide to take a second one, all the light in the foreground was gone! …

If you look at the plain image, just the straight image of this, and then you look at this final print, there’s a huge difference, and this was part of Ansel’s magic is what he could do in the darkroom.”

Indeed, the later images had a darker sky than earlier prints. Alas, the photo was so wildly popular that Adams made hundreds of prints of it, and its copies came up for auction so often that dealers and collectors used its prices as an informal benchmark to indicate the strength of the photography prints market in the 1970s. It also inspired a cottage industry among astronomers to determine when exactly the photo was taken (using the moon’s position) for Adams rarely recorded exact dates for his images. Their verdict? : around 5 p.m., one late October/early November day in 1941.

[Footnote: Adams himself had given varying backstories to how he came about to capture the scene in his many photobooks.]


Filed under: Culture, Society Tagged: Ansel Adams, environment, nature