Shared posts
What Is a 'Hacktivist'?
100 Diagrams That Changed the World
A visual history of human sensemaking, from cave paintings to the world wide web.
 Since the dawn of recorded history, we’ve been using visual depictions to map the Earth, order the heavens, make sense of time, dissect the human body, organize the natural world, perform music, and even concretize abstract concepts like consciousness and love. 100 Diagrams That Changed the World (UK; public library) by investigative journalist and documentarian Scott Christianson chronicles the history of our evolving understanding of the world through humanity’s most groundbreaking sketches, illustrations, and drawings, ranging from cave paintings to The Rosetta Stone to Moses Harris’s color wheel to Tim Berners-Lee’s flowchart for a “mesh” information management system, the original blueprint for the world wide web.
But most noteworthy of all is the way in which these diagrams bespeak an essential part of culture — the awareness that everything builds on what came before, that creativity is combinatorial, and that the most radical innovations harness the cross-pollination of disciplines. Christianson writes in the introduction:
It appears that no great diagram is solely authored by its creator. Most of those described here were the culmination of centuries of accumulated knowledge. Most arose from collaboration (and oftentimes in competition) with others. Each was a product and a reflection of its unique cultural, historical and political environment. Each represented specific preoccupations, interests, and stake holders.
[…]
The great diagrams depicted in the book form the basis for many fields — art, astronomy, cartography, chemistry, mathematics, engineering, history, communications, particle physics, and space travel among others. More often than not, however, their creators — mostly known, but many lost to time — were polymaths who are creating new technologies or breakthroughs by drawing from a potent combination of disciplines. By applying trigonometric methods to the heavens, or by harnessing the movement of the sun and the planets to keep time, they were forging powerful new tools; their diagrams were imbued with synergy.
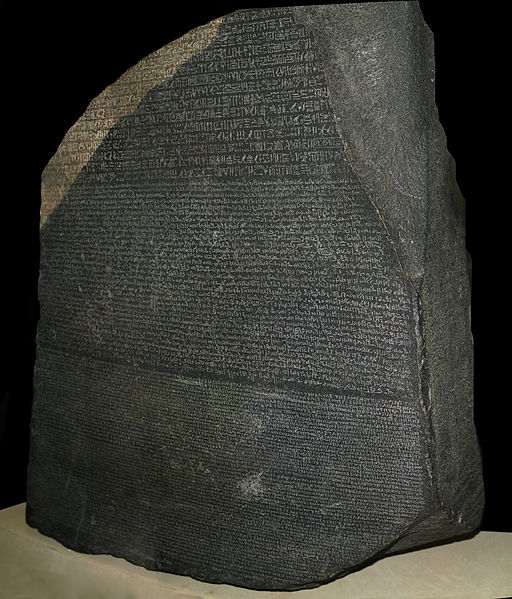
Rosetta Stone (196 BC)
Discovered in 1799, this granite block containing a decree written in three languages allowed Egyptologists to interpret hieroglyphics for the first time -- a language that had been out of use since the fourth century AD.
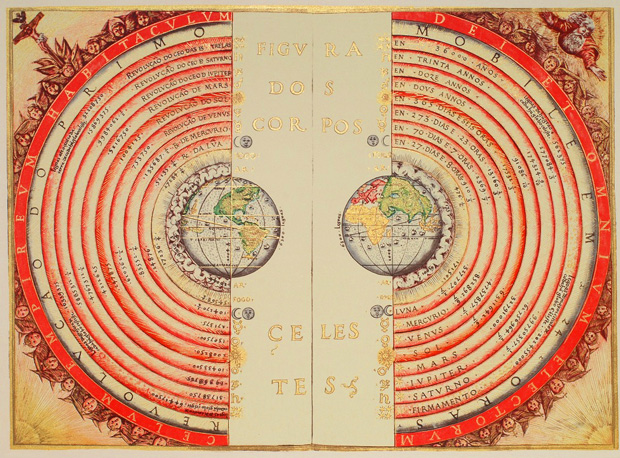
The Ptolemaic System (Claudus Ptolemy, c. AD 140-150)
This 1568 illuminated illustration of the Ptolemaic geocentric system, 'Figura dos Corpos Celestes' (Four Heavenly Bodies), is by the Portuguese cosmographer and cartographer Bartolomeu Velbo.
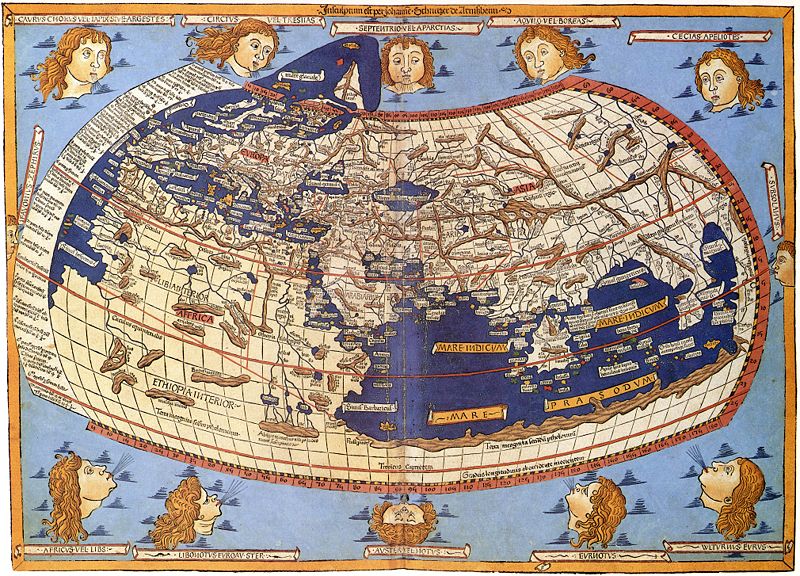
Ptolemy's World Map (Claudius Ptolemy, c. AD 150)
In this 15th-century example of the Ptolemaic world map, the Indian Ocean is enclosed and there is no sea route around the Cape. The 'inhabited' (Old) World is massively inflated.
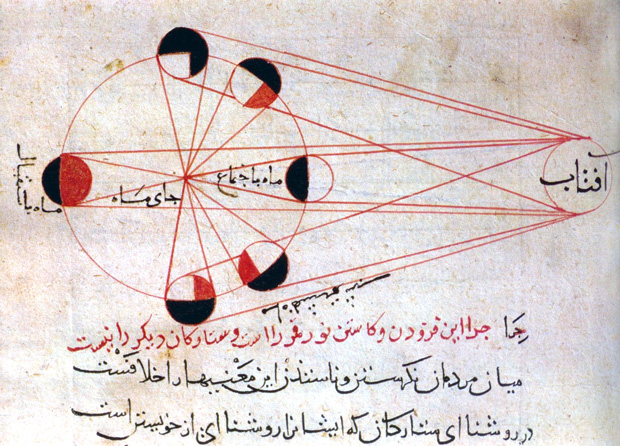
Lunar Eclipse (Abu Rayhan al-Biruni, 1019)
An illustration showing the different phases of the moon from al-Biruni's manuscript copy of his Kitab al-Tafhim (Book of Instruction on the Principles of the Art of Astrology)
Christianson offers a definition:
diagram
From the latin diagramma (figure) from Greek, a figure worked out b lines, plan, from diagraphein, from graphein to write.
First known use of the word: 1619.
- A plan, a sketch, drawing, outline, not necessarily representational, designed to demonstrate or explain something or clarify the relationship existing between the parts of the whole.
- In mathematics, a graphic representation of an algebraic or geometric relationship. A chart or graph.
- A drawing or plan that outlines and explains the parts, operation, etc. of something: a diagram of an engine.
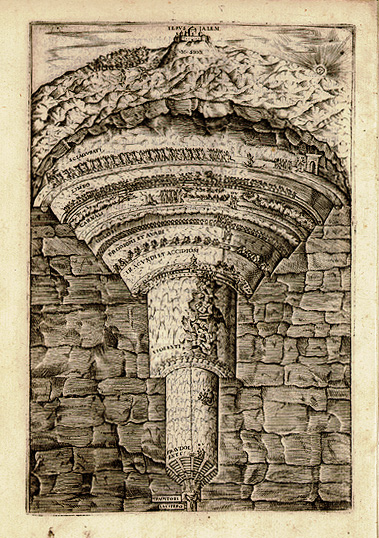
Dante's Divine Comedy (Dante Alighieri, 1308-21)
A 19th-century interpretation of Dante's map of Hell. The level of suffering and wickedness increases on the downward journey through the inferno's nine layers. No original copies of Dante's manuscript survive.
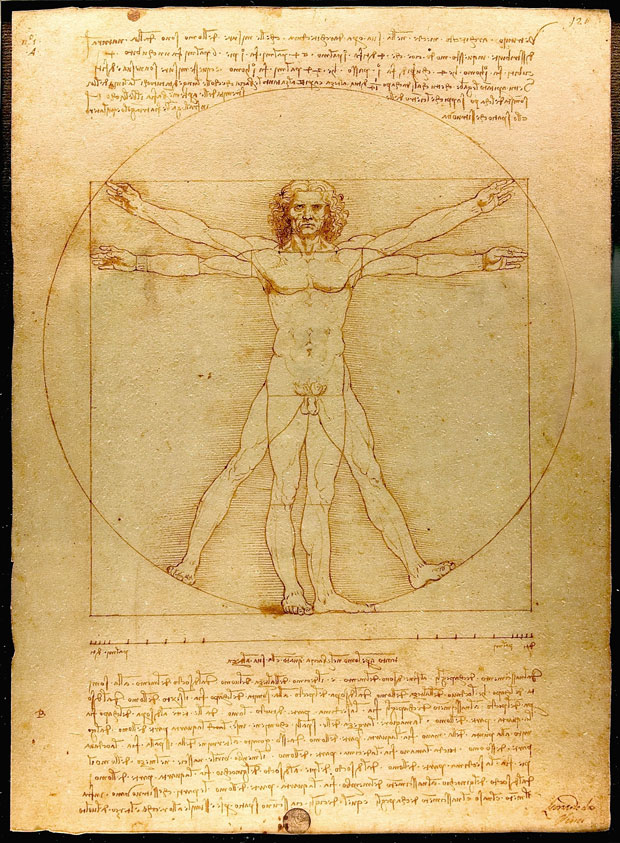
Vitruvian Man (Leonardo da Vinci, c. 1487
This sketch, and the notes that go with it, show how da Vinci understood the proportions of the human body. The head measured from the forehead to the chin was exactly one tenth of the total height, and the outstretched arms were always as wide as the body was tall.
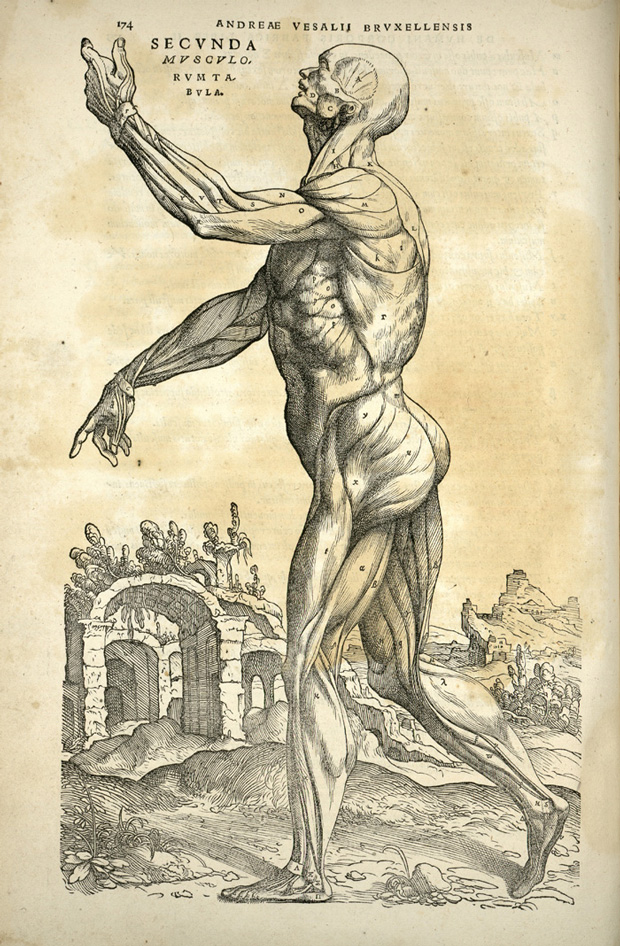
Human Body (Andreas Vesalius, 1543)
Vesalius's revolutionary anatomical treatise, De Humani Corporis Fabrica, shows the dissected body in unusually animated poses. These detailed diagrams are perhaps the most famous illustrations in all of medical history.
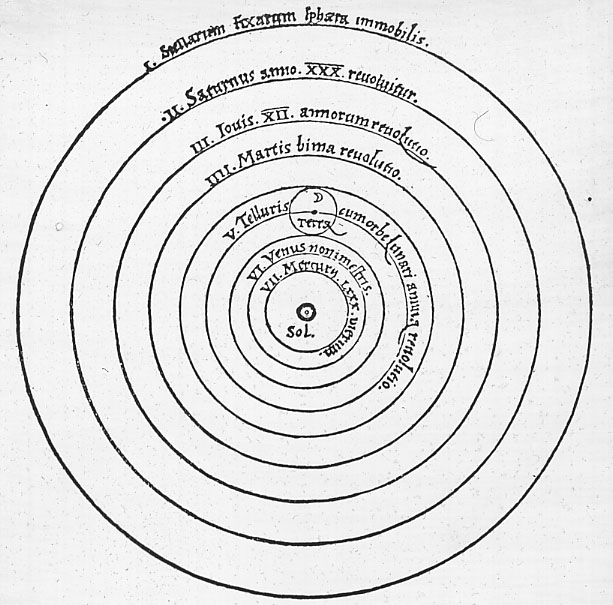
Heliocentric Universe (Nicolaus Copernicus, 1543)
Copernicus's revolutionary view of the universe was crystallized in this simple yet disconcerting line drawing. His heliocentric model -- which placed the Sun and not the Earth and the center of the universe -- contradicted 14th-century beliefs.
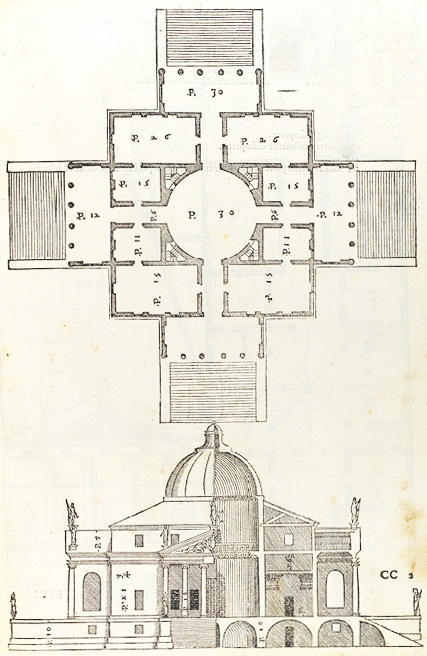
The Four Books of Architecture
Palladio's country villas, urban palazzos, and churches combined modern features with classical Roman principles. His designs were hailed as 'the quintessence of High Renaissance calm and harmony.'
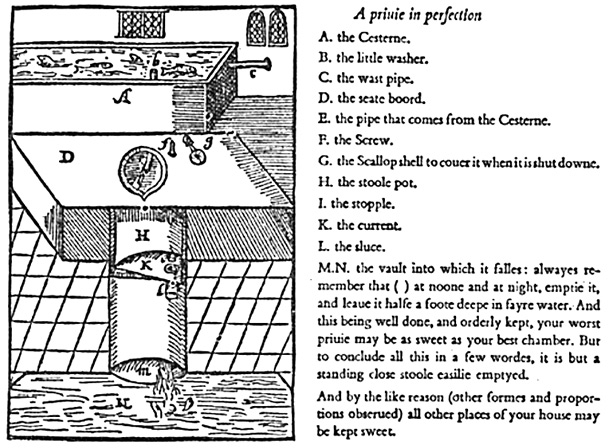
Flush Toilet (John Harington, 1596)
The text accompanying Harington's diagram identified A as the 'Cesterne,' D as the 'seate boord,' H as the 'stoole pot,' and L as the 'sluce.' If used correctly, 'your worst privie may be as sweet as your best chamber.'
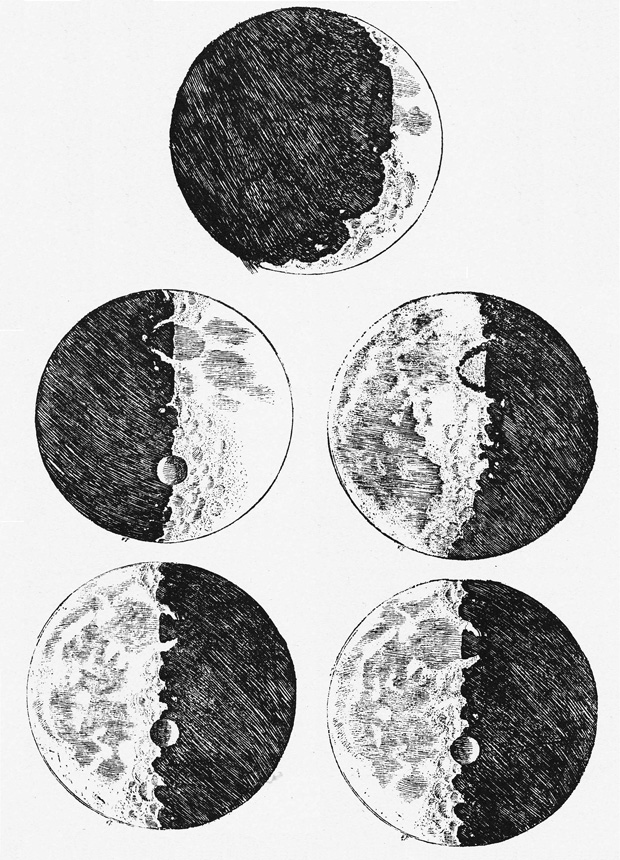
Moon Drawings (Galileo Galilei, 1610)
Aided by his telescope, Galileo's drawings of the moon were a revelation. Until these illustrations were published, the moon was thought to be perfectly smooth and round. Galileo's sketches revealed it to be mountainous and pitted with craters.
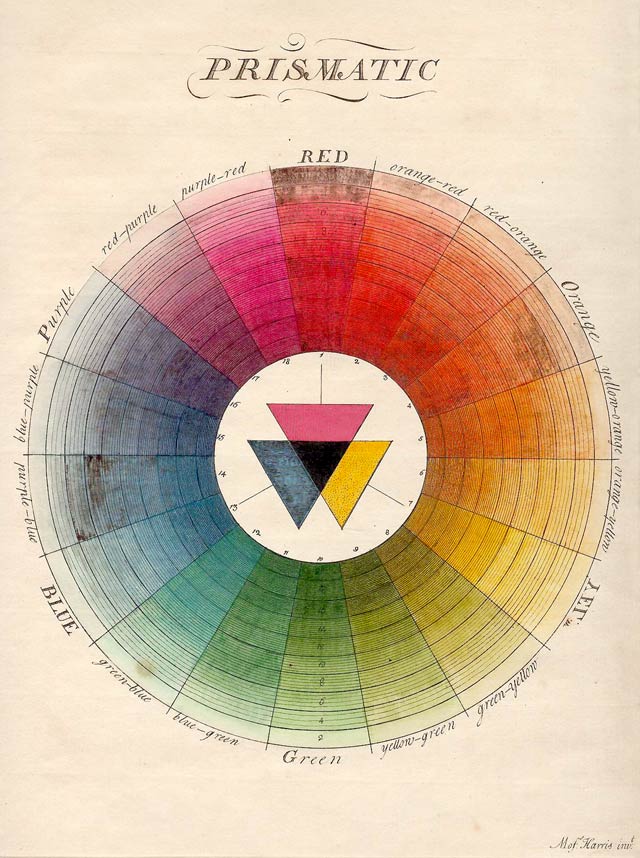
Color Wheel (Moses Harris, 1766)
Moses Harris's chart was the first full-color circle. The 18 colors of his wheel were derived from what he then called the three 'primitive' colors: red, yellow and blue. At the center of the wheel, Harris showed that black is formed by the superimposition of these colors.
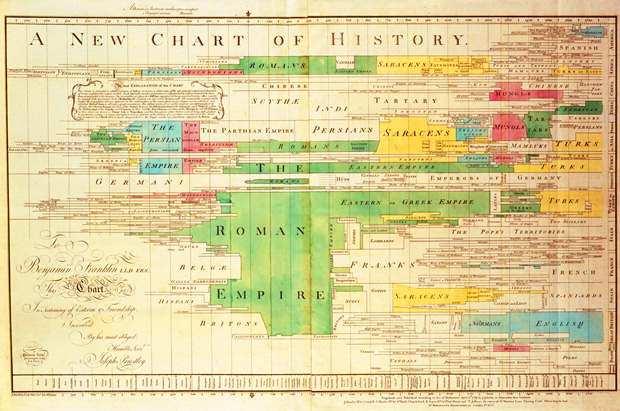
A New Chart of History (Joseph Priestley, 1769)
The regularized distribution of dates on Priestley's chart and its horizontal composition help to emphasize the continuous flow of time. This innovative, colorful timeline allowed students to survey the fates of 78 kingdoms in one chart.
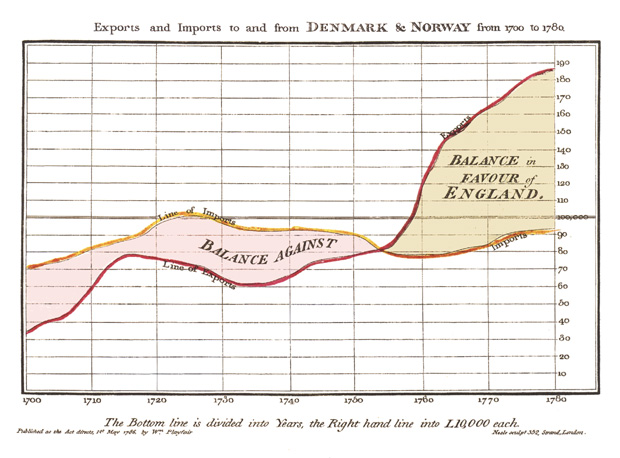
Line Graph (William Playfair, 1786)
William Playfair was the first person to display demographic and economic data in graph form. His clearly drawn, color-coded line graphs show time on the horizontal axis and economic data or quantities on the vertical axis.
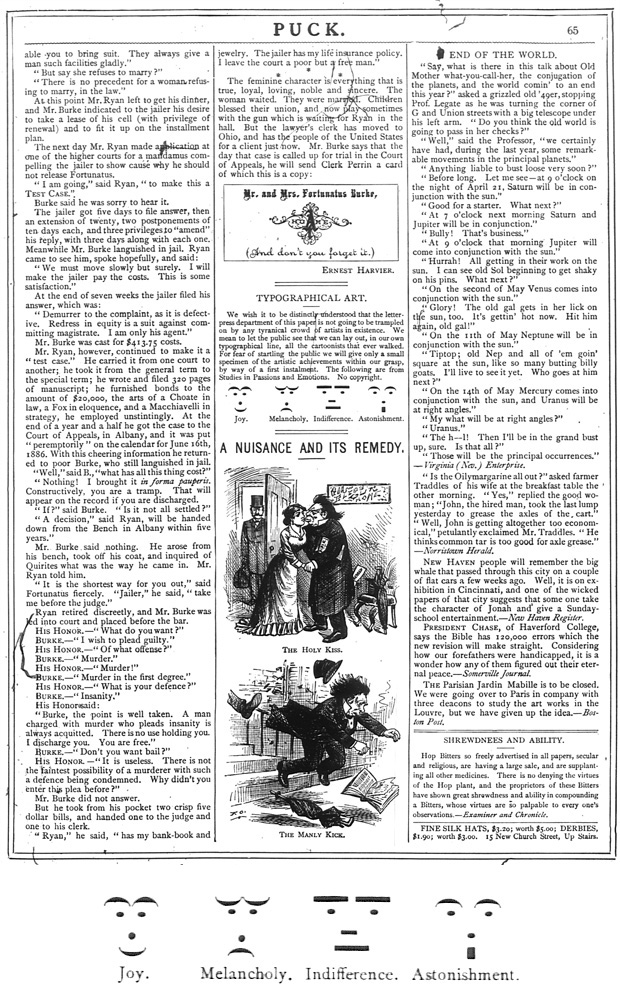
Emoticons (Puck Magazine, 1881)
Emoticons made a discreet entrance, arriving in print for the first time in this March 30, 1881 issue of Puck. The small item in the middle of this page gives four examples of 'typographical art' -- joy, melancholy, indifference, and astonishment.
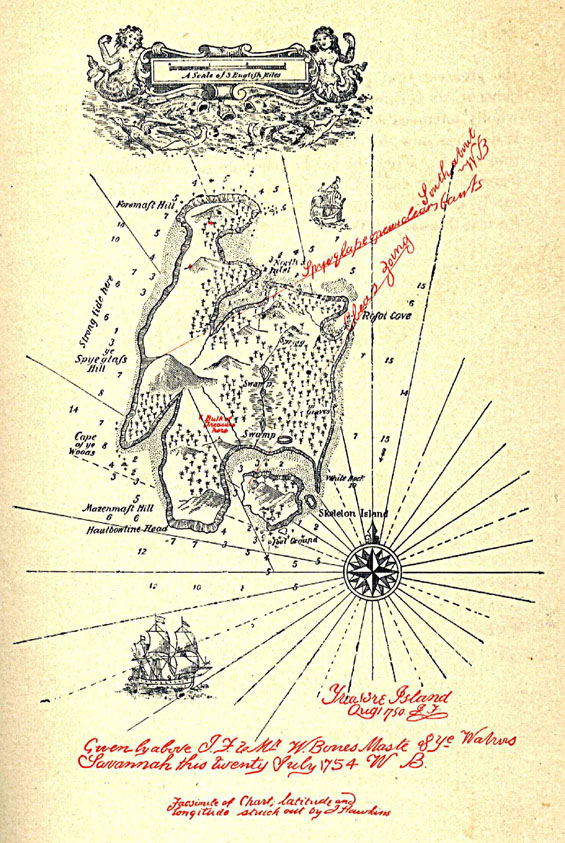
Treasure Island Map (Robert Louis Stevenson, 1883)
While there is no evidence of real pirates ever leaving a 'treasure map' showing where they had buried their stolen goods, with 'X' marking the spot, Stevenson's fictional device has continued to excite generations of children to this day.
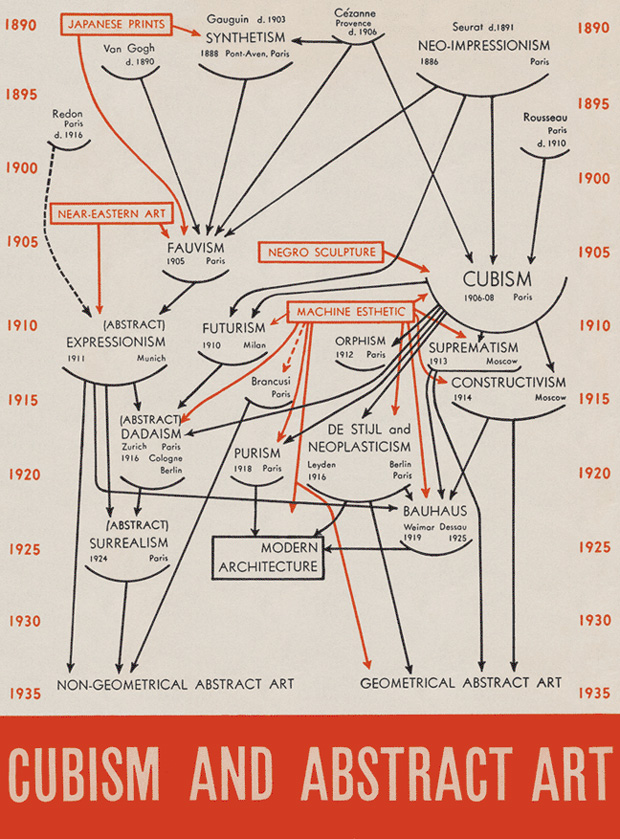
Cubism and Abstract Art (Alfred Barr, 1936)
Barr's striking diagram highlighted the role that cubism had played in the development of modernism. Like the exhibition and book that accompanied it, Barr's diagram was a watershed in the history of 20th-century modernism.

Intel 4004 CPU (Ted Hoff, Stanley Mazor, Masatoshi Shima, Federico Faggin, Philip Tai, and Wayne Pickette, 1971)
Wayne Pickette suggested that Intel could use a 'computer on a board' for one of their projects with the Japanese company Busicom. Pickette drew this diagram with Philip Tai for the 4004 demonstration board.
Complement 100 Diagrams That Changed the World with 17 equations that changed the world and the fantastic Cartographies of Time.
Thanks, Kirstin
Donating = Loving
In 2012, bringing you (ad-free) Brain Pickings took more than 5,000 hours. If you found any joy and stimulation here this year, please consider becoming a Member and supporting with a recurring monthly donation of your choosing, between a cup of coffee and a fancy dinner:
| ♥ $10 / month♥ $3 / month♥ $25 / month♥ $50 / month♥ $100 / month |
![]()
You can also become a one-time patron with a single donation in any amount:
 Brain Pickings has a free weekly newsletter and people say it’s cool. It comes out on Sundays and offers the week’s best articles. Here’s what to expect. Like? Sign up.
Brain Pickings takes 450+ hours a month to curate and edit across the different platforms, and remains banner-free. If it brings you any joy and inspiration, please consider a modest donation – it lets me know I'm doing something right.

Mysterious Underwater “Crop Circles” Discovered Off the Coast of Japan

More than 70 percent of our planet is covered with water, yet the oceans are still the most mysterious parts of the world. Deep-sea photographer and diver Yoji Ookata discovered something he had never seen in his 50 years documenting the underwater world off the coast of Japan: a beautiful circular structure on the sand, about 80 feet below sea level that was so accurately carved that it looks like a deep-sea crop circle.


Read the rest of Mysterious Underwater “Crop Circles” Discovered Off the Coast of Japan
Permalink | Add to del.icio.us | digg
Post tags: Animals, Art, crop circle, deep-sea photography, Japan, Mystery Circle, puffer fish, underwater design, water issues, Yoji Ookata