R.P. Aditya
Shared posts
How Does Your Landlord Calculate Your Rent?

No masks or capes, but these heroes are saving the world
The Wall of Love Outside a Jail

First Person: Taking Out the Trash? That’s Still a Man’s Job, Even for the Liberal Coastal Elite
R.P. Adityaa little too long and a little too first world problems, but still amusing -- glad we outsourced the job to the kids, alternating 2x a week

Profile of Reality Winner
New York Magazine published an excellent profile of the single-document leaker Reality Winner.
Unfiltered Fervor: The Rush to Get Off the Water Grid
R.P. Adityasigh

Berkeley’s Bancroft Way Gets a Nod on “Best Bikeways of 2017” List

Note: GJEL Accident Attorneys regularly sponsors coverage on Streetsblog San Francisco and Streetsblog California. Unless noted in the story, GJEL Accident Attorneys is not consulted for the content or editorial direction of the sponsored content.
Included in People for Bike’s list of “Best New Bikeways of 2017” is one in California: new protected bike lanes along Bancroft Way in Berkeley. These are far from the only new bikeways built in California during the past year that are worthy of celebration, but the lanes in Berkeley are something special.
For one thing, they are two-way, parking-protected lanes along a one-way street leading uphill to the UC Berkeley campus, with bike boxes to guide left and right turns and soft-hit posts between the parked cars and the lane. They are also the first “connected protected” bikeway in Berkeley, because they connect to another protected bikeway that runs perpendicularly along Fulton Street. They provide bike riders a new a safe option to get to campus within the severely limited grid of one-way streets south of Bancroft.

But the project is also special because it was planned and funded in large part by AC Transit, the regional bus agency that operates several busy bus lines on Bancroft. AC Transit wanted to extend bus-only lanes that run for a few blocks down Bancroft, and working with Bike East Bay they found a solution that could work for all: a red-painted bus-only lane down one side, and the two-way parking-protected bikeway on the other.
A representative for AC Transit told the Berkeley City Council, “We are including green protected bike lanes in this project because we need the political support of the bike coalition to get this approved.”
“AC transit came up with designs and got the funding together,” said Dave Campbell, Advocacy Director for Bike East Bay. “It’s their project. How many bus agencies nationally have stepped up to design and build bikeways?”
On top of all that, the street was also narrowed, which makes crossing much easier for pedestrians. This section formerly had a slightly confusing configuration of two to three lanes, all going in one direction, which tended to encourage drivers to speed around each other on the downhill. Now cars have two lanes to drive in, buses have their own lane, and bikes have a two-way bikeway protected by a row of parking.
The street is not perfect. Yet. People still park in the bus lane. Bicyclists riding downhill have to navigate over to the left side of the street to enter the lanes, although there are clear markings to help them figure out where to go. Left turns were eliminated for cars from Bancroft onto Fulton, but it is taking a while for that new pattern to sink in. Car drivers are used to being able to make a series of left turns that sweep them back up towards campus in a search for nonexistent street parking.

But one of the best things about the project is that it is a work in progress. Future phases—some of which have been approved already by the Berkeley City Council, and all of which have funding lined up—include a two-way bikeway on Dana, which tees into Bancroft, and improvements along four blocks of Telegraph Avenue as it approaches the campus. AC Transit got funding for many of those improvements to help its buses move more efficiently along there, but the streets will be better for everyone. Those improvements are planned for 2018.
Future plans include extending the two-way bikeway all the way up Bancroft to the top of campus at Piedmont Way.
Meanwhile there is still work to do on the current project. A turn box for bikes needs better signage, and the city may have to consider moving the “no left turn” sign into the intersection, because so many cars seem not to see it. A curb still needs to be painted red to make it clear that cars are not supposed to be parking where it looks like a metered spot, even though it is right on top of the green-painted bike lane.
The city plans to collect data and issue a report about the project once it is complete and people have been using it for a while. Bike East Bay is doing its own evaluation to augment the city’s data, including a survey on how riders like the lanes and what needs improvement.
Campbell says he has heard from some bike riders that they prefer to ride downhill in the travel lane or even the bus lane on the right-hand side of the street. His response: Not an issue. “Those people are not the design users,” he said. “We didn’t put in the bikeway for confident cyclists, but for a much wider range of bicyclists who want to feel safe on the road.”
Bike East Bays’ vision for the area is a connected network of low-stress bikeways that say: “Hey, bicyclists! You are welcome here, and safe.”

SQL Injection Wiki
Article URL: https://sqlwiki.netspi.com/
Comments URL: https://news.ycombinator.com/item?id=15976486
Points: 342
# Comments: 34
Much ado about crossing, redux
 |
| A photo of one of Ann Arbor's new crosswalk ordinance success rate signs. Photo by Mary Morgan. |
Dedicated readers of Damn Arbor will know we strongly support Ann Arbor's Crosswalk Ordinance. By way of background, here are just a few Crosswalk Ordinance articles from our archive: Much ado about crossing; Reflections on the Crosswalk Ordinance; Stay vigilant for coming attacks on the Crosswalk Ordinance; and, Mayor promises to veto repeal of crosswalk ordinance.
Broadly speaking, Damn Arbor supports things that make it easier to be a pedestrian. We do however have two pieces of constructive criticism. First we'd like to see more HAWK Walks, especially for crosswalks on 4 lane roads. We know HAWK Walks cost more than RRFBs but we feel like the hawk walk signaling is clearer and more visible than RRFBs making for a safer crosswalk on busy roads.
Second, we would like to see street signs at major entrances into Ann Arbor that explain the crosswalk ordinance. Something along the lines of: "local law: drivers must yield to pedestrians at marked crosswalks." This would help address the question of how to communicate the ordinance to drivers that don't live in the city. There are about 50,000 weekday commuters into Ann Arbor, plus visitors for special events like sports games and festivals. It is important that we communicate our crosswalk expectations to these drivers if we want them to comply with the ordinance.
I bring this up because of the new crosswalk ordinance success rate signs that have sprouted up (see picture above). It seems like if Ann Arbor can spring for, what I assume are custom signs, the city could get for some signs explaining the ordinance at major road entrances into the city. Just like we have those signs saying drivers must stop for school bus losing and unloading. Street signs are a standard way of communicating rules and expectations to drivers. If we want to make sure as many drivers know about the crosswalk ordinance as possible, we need to make sure drivers know about the ordinance. Especially those drivers that commute into our city. The recent Crosswalk Ordinance Memo lists the way the city has attempted to inform people of the Crosswalk Ordinance. So far the city has used the following methods:
A2gov.org, Facebook (City and AAPD), Twitter (City and AAPD), MLive, CTN, WEMU, Posters, Bumper stickers, Keychains, Slap bracelets, Informational handouts, Resident Newsletter, Bus ads (on buses and at bus stops), Print ads, Radio ads.It is jaw dropping that the city has elected to use slap bracelets before street signs in attempting to inform people about Crosswalk Ordinance. I know slap bracelets are much cheaper than street signs, but they just don't seem to be like an effective way to communicate to motorists or pedestrians at scale.
If Ann Arbor wants to increase the percentage of drivers who yield to pedestrians, the city needs to make sure as many drivers know about the Crosswalk Ordinance as possible. On an average weekday, 50,000 people commute into Ann Arbor. Most of these commuters are driving. There are also numerous people who visit Ann Arbor for the Hospital, the University, or various festivals. We cannot expect these people to comply with the Crosswalk Ordinance if they don't know what the Crosswalk Ordinance is. Clearly information about the Crosswalk Ordinance has not been spread as widely as possible. Ann Arbor needs to find a way to communicate its crosswalk expectations to people who don't read MLive and don't wear slap bracelets. The city should invest in street signs that explain our Crosswalk Ordinance at the major road entrances into Ann Arbor.
Special thanks to CivCity's Mary Morgan for the picture above.
The Backlash Against Piped Music
It was a bright, frigid morning in Ann Arbor, Michigan, two weeks before the University of Michigan let out for winter break, and the college town’s numerous coffee shops were abuzz with the gentle tapping of keyboards, the whooshing of espresso machines, the occasional chatter—and the tinny strains of 1980s and ’90s pop hits.
It’s that last element of the sonic landscape that drives Gina Choe and Libby Hunter crazy. Standing just inside a cavernous cafe where The Smiths’ “How Soon Is Now?” competed with a sizzling griddle, jostling coffee cups, and echoing voices, Choe said, “I came in here once, and [the music] was everywhere around me. Everyone was talking more loudly—I couldn’t even hear my friend.”
As Choe checked a decibel meter on her phone (“65, the level of loud conversation”), Hunter mentioned that the last time she was here, she had asked a counter worker if the music could be turned off. “The manager came over to my table, and she was really nice, but she said no, because of the ‘atmosphere.’ It’s amazing how afraid they are to not have music.”
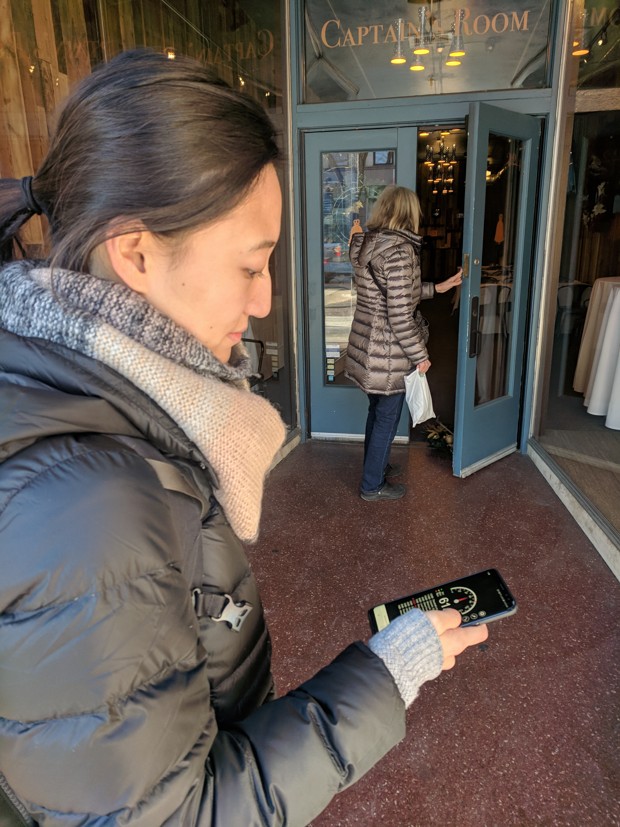
Hunter, a retired middle-school music teacher, and Choe, a 2017 Michigan graduate who is working in a research lab while she prepares to apply to medical school, do not travel in the same circles, and might never have met at all had they not come together over a mutual love of quiet spaces—and a loathing for piped-in background music.
Last summer, Choe posted on the neighborhood-based social network Nextdoor, soliciting suggestions for quiet places to work (“Most people recommended libraries, and that wasn’t what I was looking for,” she clarified). Hunter responded in sympathy, noting that she had long wanted to form a local chapter of the British group Pipedown, which has organized successful letter-writing campaigns against piped music in department stores and pubs. Choe said she could build a website, and not long after, Quiet Ann Arbor, the first U.S. chapter of Pipedown, was born. The still-new group plans to assemble a database of quiet places in town and mount letter-writing campaigns along the lines of Pipedown’s in the U.K.
“My goal is no music in public places, unless it’s live music,” Hunter said. “Let’s keep music special. Music is not special when it’s part of the wallpaper.”
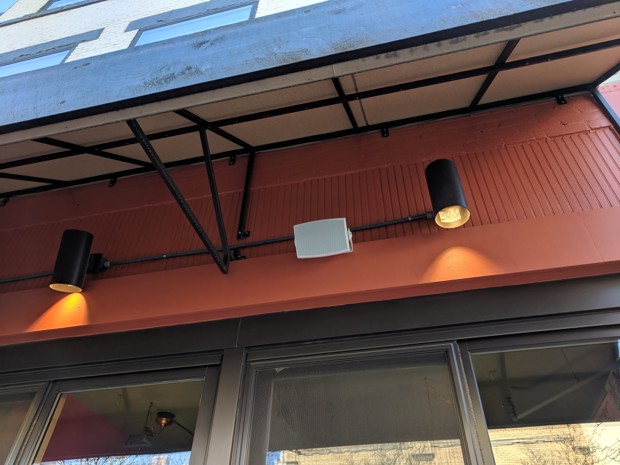
Choe and Hunter’s intolerance for piped music might seem extreme. (Full disclosure: I am writing this in a cafe where I find the R&B soundtrack to be a fairly innocuous accompaniment to a double cappuccino). But it’s safe to say that most of us have been annoyed, at one time or another, by piped music—especially during the holidays, when bad covers of Christmas standards are suddenly everywhere. Although for some people, music is part of the appeal of a coffee shop or bar, they might feel differently when others’ musical tastes are imposed upon them at the airport or the grocery store, in hospital corridors or doctors’ waiting rooms, or even—thanks to the outdoor speakers some shops position above their doorframes—in the street itself.
“Most of us really like music. We just want it to be freely chosen,” said Nigel Rodgers, an English writer who founded Pipedown in 1992, and compares piped music to second-hand cigarette smoke.
Pipedown now boasts some 2,000 members across the U.K., including Absolutely Fabulous star Joanna Lumley, who supplied a blurb for the group’s website (“I have left shops, unable to purchase the object of my desire, because of hellish piped music”). It has also won a number of victories. In 1994, Gatwick Airport, Britain’s second busiest, agreed to turn off piped music in its terminals after Pipedown persuaded management to survey travelers. According to the group, of the more than 68,000 people who responded to the survey, 43 percent said they disliked the piped music, while only 34 percent said they liked it (the rest didn’t care either way).
More recently, Pipedown’s letter-writing campaigns have persuaded stores to turn off or limit music. Last year, the department-store chain Marks and Spencer stopped playing it, and this past spring, the grocer Asda said it would experiment with “quiet hours.” And an Australian broadcaster has announced plans to launch a Pipedown chapter Down Under.

While many of Pipedown’s members simply dislike piped music, Rodgers noted that it can be more than an irritant. “Music you don’t want to listen to simply becomes noise, and all noise has certain effects on people,” he said, pointing to studies that show noise raises blood pressure and exacerbates depression and anxiety, especially in people who have to hear it for extended periods (perhaps because they work in a shop where “All I Want for Christmas Is You” plays on an endless loop). For those with autism and other sensory-processing issues, or with hearing disorders like tinnitus and hyperacusis, it can aggravate symptoms, impede their ability to hear conversation, and even interfere with how they get around.
“It gets confusing when the music is too loud,” said Ann Arbor resident Morry Nathan, in a downtown bookstore where soft classical guitar played over a small speaker. (“This is not too bad,” said Choe, looking at her decibel meter.) Nathan, who is both blind and hard of hearing, hadn’t heard about Quiet Ann Arbor, but he said he supported their goal. “It’s hard to keep up a conversation, and when the acoustics of the room are also bad—lots of hard surfaces—it can be jarring,” he said. “I have walked out of restaurants because of it.”
Of course, stores, restaurants, cafes, and shopping malls are not trying to torment their customers; they are trying to make money. A body of research suggests that people spend more in a store where slow music is playing and move more quickly when music is loud; that classical music may induce customers to spend more money on luxury goods; and that impulse buyers tend to spend more at the mall when music is playing. As brick-and-mortar stores face the threat of online retail, some are even turning to music for salvation. Target, which long resisted playing music on the grounds that it distracts people from shopping, has been testing it at some locations, and announced this year that it would roll out an “upbeat, positive” soundtrack with “a playful personality” in several dozen new and remodeled stores.
Whether or not the psychological manipulation works, people who hate piped music bristle at the intent. “When I started Pipedown, I thought piped music did work,” Rodgers said. (He has since become skeptical.) “And I objected on the grounds of liberty. We shouldn’t have to have this mind control.”
Simply by its existence, piped music does shape our experience of public life. Sure, private businesses may do what they like, whether that’s playing “Rockin’ Around the Christmas Tree” 300 times in December or bowing to the pressure of polite British (or Midwestern) letter-writers. But by imposing a mood, whether festive or frenetic, they risk interfering with phenomena like conversation and people-watching that motivate people to spend time among their fellow humans. Background music is a buffer that can numb us to one another.
“We’re so cyber-spatially-oriented now,” said Hunter, after she and Choe had finally found a coffee shop quiet enough to conduct our interview. “And I almost think I have no bandwidth left. This is a time in our history when people need to be communicating with each other. Real, live talking is more important than ever.”
In Protests of Net Neutrality Repeal, Teenage Voices Stood Out

Abandoned rape kits identify over 800 serial rapists in one Michigan county
Article URL: https://www.freep.com/story/opinion/columnists/nancy-kaffer/2017/12/17/rape-kit-detroit/953083001/
Comments URL: https://news.ycombinator.com/item?id=15953907
Points: 377
# Comments: 195
hnrss is a labor of love, but if the project has made your job or hobby project easier and you want to show some gratitude, donations are very much appreciated. PayPal and Bitcoin both accepted. Thanks!
Passing Through to Corruption
When Density Isn't Greener
Sprawl is not sustainable. That’s the basic assumption shaping high-rises, infill developments, and master plans in cities around the world—not to mention a guiding principle of this publication.
But a new report by the Council on Tall Buildings and Urban Habitat challenges one of the central tenets of urbanism from a few unexpected angles. Comparing the daily patterns household-to-household, researchers found that certain transportation habits and overall energy use can be more environmentally efficient in suburban housing than residential high-rises.
To date, most research into urban sustainability—in terms of, say, gasoline guzzled, miles traveled, and water, heat and electricity consumption—has not examined household data in such granular detail. Studies that have generally concluded that suburbs are less efficient “are not building studies, but urban scale studies,” said Antony Wood, the executive director of the CTBUH and research professor at the Illinois Institute of Technology’s College of Architecture. “It’s urban Chicago versus total Chicago.”
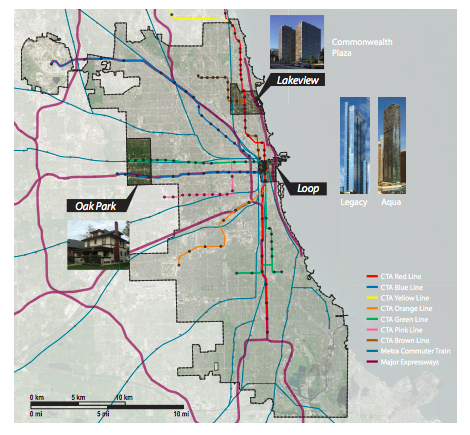
Wood and co-author, Peng Du, who is also a professor at IIT’s College of Architecture, wanted to capture more nuance than that. They created a survey comparing transportation patterns, energy consumption, and use of public space, which they administered to 249 households in four downtown Chicago high-rises and 273 single-family homes in Oak Park, a historic residential neighborhood. Over three months in 2014, respondents answered detailed questionnaires about their daily habits, and submitted 12 months worth of utility bills.
Wood and Du found many points of affirmation that urban life is indeed more sustainable. High-rise dwellers traveled more on public transit, walked and biked more, and made more efficient use of outdoor public space—no surprise there, since they lived closer to CTA stops, parks, and walkable amenities. The researchers also added up all the roads, water pipes, sewage lines, power and electricity supply required to serve the two types of households, and, glaringly, found that suburban development required roughly eight times more “infrastructure network length” per person than the downtown high rises.
Score one for dense urban development, right?
Overall, yes. But the details get more interesting. The building industry often assumes that suburban single-family homes require more energy to heat, light, and cool, since they have larger surface-to-volume ratios than smaller apartment units. But on a per-person basis, Wood and Du found that high-rise residents actually consumed about 27 percent more energy. On a per-floor area basis, probably because of all the shared hallways, elevators, gymnasiums, and lobbies, the downtown towers still consumed about 5 percent more energy than the suburban homes. Comparing travel habits, Wood and Du also unexpectedly found that downtown households actually traveled more miles by car, total, every year. The high rises also had more parking spaces per capita than the suburban dwellings.
What’s going on here? Demographic differences between the two groups in the study probably explain the surprising results. The large suburban households of Oak Park were full of kids, while the apartment towers held childless young professionals and empty nesters. That means, at least in a given room, more people are using the same amount of energy. Similarly, a stuffed minivan is more energy efficient than a lone commuter. “Suburban households were much more likely to have children that they bring with them during car travel,” the report states, “while single high-rise residents took more solo trips.”
This study is limited, but also important, because of the level of data it uses. On the one hand, its scope is much too small to make any sweeping conclusions about urban-vs-suburban eco-friendliness around the country or the world. Eventually Wood and Du would like to take on a larger-scale version with many more families, buildings, and neighborhood shapes. On the other hand, this pilot study offers quantified evidence that demographics count when it comes to environmental efficiency. A new LEED-certified apartment building near the subway may not be very eco-friendly if it’s full of people with resource-intensive lifestyles, as so many luxury developments are. Likewise, don’t get too pious about families out in the unsustainable suburbs: In some ways, they may be living greener than you are.
France to ban mobile phones in primary, junior and middle schools
Article URL: https://www.theguardian.com/world/2017/dec/11/france-to-ban-mobile-phones-in-schools-from-september
Comments URL: https://news.ycombinator.com/item?id=15912378
Points: 463
# Comments: 326
A Nasty, Nafta-Related Surprise: Mexico’s Soaring Obesity

Community and History in Iceland’s Geothermal Pools
The Big Vitamin D Mistake
Article URL: https://www.ncbi.nlm.nih.gov/m/pubmed/28768407/
Comments URL: https://news.ycombinator.com/item?id=15867918
Points: 748
# Comments: 432
hnrss is a labor of love, but if the project has made your job or hobby project easier and you want to show some gratitude, donations are very much appreciated. PayPal and Bitcoin both accepted. Thanks!
Disability: I Use a Wheelchair. And Yes, I’m Your Doctor.

Performance best practices for using Azure Database for PostgreSQL
Microsoft announced the public preview of Azure Database services for PostgreSQL and MySQL at Build 2017 which is a simple, fully managed database service for PostgreSQL and MySQL that removes the complexities around infrastructure management, data availability, protection, and scale. The service has seen tremendous growth and we have had customers reaching out to us regarding best practices for achieving optimal query performance on the service. This post outlines an approach for troubleshooting performance while using Azure Database for PostgreSQL as the backend database.
Based on the usage patterns, we see two common deployment patterns:
- An application server exposing a web endpoint on an application server, which connects to the database.
- A client-server architecture where the client directly connects to the database.

The performance issues for an application or service using Azure Database for PostgreSQL service can be classified broadly into the following categories. Pleas refer numbers in the bulleted section below for more details.
1. Resource contention (CPU, Memory, and Disk) on the client – The machine/server serving as the client could be having a resource constraint which can be identified in the task manager, the Azure portal, or CLI if the client machine is running on Azure.

2. Resource contention (CPU, Memory, and Disk) – The machine/server acting as the application server could cause a resource constraint, which can be identified in the task manager, the Azure portal, or CLI if the application server/service VM is running on Azure. If the application server is an Azure service or virtual machine, then Azure metrics can help with determining the resource contention.
3. Resource contention on Azure Database for PostgreSQL – The database service could be experiencing performance bottlenecks related to CPU, memory, and storage which can be determined from the Azure Metrics for the database service instance. Please see below for more details. To learn more, read about monitoring Azure Database for PostgreSQL.

4. Network latency – One of the common issues we encounter while troubleshooting performance is the network latency between the client and the database service instance. A quick check before starting any performance benchmarking run is to determine the network latency between the client and database using a simple SELECT 1 query. We have seen customers report improved throughput when the SELECT 1 timing for a query is <2ms when using a remote client hosted on Azure in the same region and resource group as the Azure Database for PostgreSQL server.
Commands to get SELECT 1 timing using psql:
\timing
SELECT;
\watch 1
We have observed that customers are able to significantly increase the application throughput by creating the application server and database service in the same region, resource group, and using accelerated networking for the application server/client machine, where applicable. Accelerated networking enables single root I/O virtualization (SR-IOV) to a VM, greatly improving its networking performance. This high-performance path bypasses the host from the datapath reducing latency, jitter, and CPU utilization for use with the most demanding network workloads on supported VM types. Get more information on the OS releases that support Accelerated Networking along the steps to create a virtual machine with accelerated networking.
Database performance
Once you have eliminated resource contention as a possible root cause, you will need to determine the queries on the database server which are contributing to the highest duration. This can be done using pg_stat_statements module. Since we maintain parity with community PostgreSQL, any native queries that you used to troubleshoot query performance on PostgreSQL will apply on our service as well.
You will be able to execute the below query on an Azure Database for PostgreSQL server to get the top 5 duration queries executed during your performance/benchmarking run:
SELECT query, calls, total_time, rows, 100.0 * shared_blks_hit/
nullif(shared_blks_hit + shared_blks_read, 0) AS hit_percent
FROM pg_stat_statements
ORDER BY total_time
DESC LIMIT 5
It is recommended to reset the pg_stat_statements using the query below to ensure that you only capture the statements from your performance/benchmarking run:
SELECT pg_stat_statements_reset()
Quick tips
If CPU usage for an Azure Database for PostgreSQL server is saturated at 100%, then select the next higher level of Compute Units to get more CPU. For example, if the CPU usage is hovering around 100% continuously during business hours for a Standard 100, then it might be worthwhile to consider Standard 200.
A common issue that we notice is the use of the default included storage size for the database, which is 125GB. The default storage size of 125GB is limited to 375 IOPs. If your application requires higher IOPs, then it is recommended that you create an Azure Database for PostgreSQL server with a higher storage size to get more IOPs so that your application performance is not impacted by storage throttling.
If IO waits are observed from MySQL/PostgreSQL performance troubleshooting, then increasing the storage size should be considered for higher IO throughput. For example, if you observe WALWriteLock as the wait event type for maximum requests using pg_stat_activity, then it would be beneficial to use a server with a higher storage size as storage performance scales with the allocated storage size.
Query to determine the number of waits on WALWriteLock which signifies an IO bottleneck associated with Write Ahead Log writes:
select wait_event, wait_event_type, count(*) as counts
from pg_stat_activity
group by wait_event, wait_event_type;
We recommend having the application server/client machine in the same region and resource group in Azure to reduce between the client/application server and the database.
If you are using pgbench for testing performance, then it is advisable to use a scale factor which is higher than at least the number of connections to ensure that your performance benchmarking is not bottlenecked on update contention. For example, if you are using 100 connections to run pgbench3, then you should at least use a scale factor of 100 or higher.
If there is a resource contention associated with memory or CPU usage on the virtual machine acting as the application server, and all possible optimizations on the application has been implemented, it is recommended to increase the virtual machine size to increase the compute and memory available on the virtual machine.
If there are IO related bottlenecks observed on the virtual machine acting as the application server, it is recommended to increase the disk size hosting the application files and possibly evaluating the use of Premium Managed Disks.
If you are still having a performance issue and need assistance, you have the following options:
- Open a support incident with Microsoft support.
- Post a question on our MSDN forums.
- Send a tweet to @AzureDBforPostgreSQL.
Reference
An interview with Richard Retyi on the occasion of the publication of the publication of his first book
R.P. Adityahttp://www.aadl.org/catalog/record/fap-retyi-bookofannarbor available via AADL

Damn Arbor alum Rich Retyi has just published his first book, The Book of Ann Arbor: An Extremely Serious History Book. He will be discussing the book tomorrow night at Literati Bookstore at 7 pm. The Book of Ann Arbor compiles many of the historical stories you may have heard on Rich's podcast, Ann Arbor Stories.
This afternoon, Rich and I sat down at our respective computers to discuss his book over email.
Ben Connor Barrie: What is your favorite story in the book?The Book of Ann Arbor: An Extremely Serious History Book, published by Fifth Avenue Press, is available at Nicola's Books, Literati, Rock, Paper, Scissors, and Amazon.Rich Retyi: he saddest is It's Lovely to Die Together. The most messed up are Ann Arbor Cages Public Animal #1 or The Torch Murders. The grossest is A Brief History of Poop. The historicaliest is Dirty Rotten Founders. But Ben, my favorite is obviously the Dam Arbor chapter!
BCB: What was the best part about writing the book?
RR: Nothing. It fucking sucks to write a book. That's not exactly true. Going down 41 rabbit holes to write these stories—reading all these old newspaper articles and looking through old photos from the Ann Arbor District Library's archives—that's a lot of fun. But deadlines and editors who hit me and did I mention deadlines? I also feel really weird signing my book because that feels super pretentious. Wait, your question was what did you hate about writing this book, right?
BCB: Is your book the best local holiday gift for the 2017 season?
RR: No. It's the third best holiday gift for the 2017 season. The first best would be John Bacon's book about when the town of Halifax blew up. The second would be a t-shirt from The Bar at Braun Court. THEN Book of Ann Arbor.
What happens when patients find out how good their doctors are? (2004)
Article URL: https://www.newyorker.com/magazine/2004/12/06/the-bell-curve
Comments URL: https://news.ycombinator.com/item?id=15840525
Points: 310
# Comments: 221
hnrss is a labor of love, but if the project has made your job or hobby project easier and you want to show some gratitude, donations are very much appreciated. PayPal and Bitcoin both accepted. Thanks!
Two Questions About Trump and Republicans that Stump Progressives
Progressives are stumped. They are asking these questions over and over again on social media, TV, and radio:
1) Why don’t Trump supporters turn against Trump even though he is doing things that hurt them? (like taking away their healthcare)
2) Why do Republicans hate the Affordable Care Act, and why are they so transparently acting to give wealthy people a tax break by making healthcare unaffordable?
Here is the short answer: All politics is moral. Supporting Trump – and gutting public healthcare resources in order to provide tax cuts for the wealthy – fits perfectly within the strict conservative moral worldview, which is hierarchical in nature. Voters don’t vote their self-interest. They vote their values.
The longer answer requires a deeper explanation.
Let’s start with the place where all ideas and questions originate – the brain.
Most thought (as much as 98% by some accounts) is unconscious. It is carried out by neural circuitry in our brains. We have no conscious access to this circuitry, but it’s there. This is basic neuroscience.
When it comes to politics, progressives and conservatives essentially have different brains. The unconscious beliefs conditioned in their brains are nearly exact opposites.
Here are two statements you will almost certainly agree with if you’re a progressive:
1) In Lincoln’s words, the American government should be a government of, by, and for the people.
2) Citizens care about other citizens, and work through their government to provide public resources for all — resources required for the wellbeing and freedom of all.
These imply just about all of progressive policies.
With a government of the people, those in the government are not separated from those outside. There is two way communication and transparency, and response to the people’s concerns.
With a government by the people, those in the government have the same basic experiences as those outside. The government therefore responds with empathy to the basic needs of its citizens.
A government for the people cares for its citizens and gives necessary help as a matter of course. There is no democracy without care.
The second principle – the need for public resources – has been essential to American democracy from the start. From the beginning, the Private Depended on Public Resources.
Public resources, including roads and bridges along with public education, a national bank, a patent office, courts for business cases, interstate commerce support, and the criminal justice system are necessary to have private enterprise. These public resources include protection — not just a military and police, but protection from harm by unscrupulous corporations either by poisoning products, the air, water, etc. or by unscrupulous banks, mortgage holders, and investors. These protections are carried out by “regulations”: protective laws and agencies.
Over time those resources have included sewers, water and electricity, research universities and research support, and technologies like computers and satellite phones.
Private enterprise and private life utterly depend on public resources. These public resources provide freedom: freedom to start and run a business, and freedom in private life.
You’re not free if you are not educated, because your possibilities in life are limited.
You’re not free if you have cancer and no health insurance.
You’re not free if you have no income — or not enough for basic needs.
And if you work for a large company, you may not be free without a union. Unions free you from corporate servitude. They free you to have a living wage, safety on the job, regular working hours, a pension, health benefits, dignity.
If you’re a progressive, you most likely agree with these ideas. If you’re a conservative, you may be apoplectic by now.
It should be clear that most progressive policies follow from these basic, largely implicit and unconscious, principles. When we state them consciously and overtly, we can see where questions (1) and (2) come from.
Why should Trump voters support him when his government does not supply necessary care, when it can hurt them deeply, threatening their health and possibly their lives by, say, taking away their health care? Why should Republicans, who are Americans after all, hate the Affordable Care Act, which was for the people, and which supplies care of the most essential kind for tens of millions of Americans?
From a progressive point a view, questions (1) and (2) are mysterious, especially when you ask them together. What do they have to do with each other — support for a Trump who harms them and hate for government care?
One Answer to Both Questions: Moral Politics
All Politics Is Moral. Progressives and conservatives have opposing moral worldviews. When a political leader proposes a policy, the assumption it that the policy is right, not wrong or morally irrelevant. No political leader says, “Do what I say because it’s evil. It’s the devil’s work, but do it!” Nor will a political leader say, “My policy proposal is morally irrelevant. It’s neither right nor wrong. It doesn’t really matter. Just do it.”
Everyone likes to think of himself or herself as a good person. That means that your moral system is a major part of your identity. To vote against your moral identity would be to reject your self.
What Are Conservative Moral Values?
In my 1996 book, Moral Politics, I examined how political values tend to arise from the fact that we are all first governed in our families. The way that your ideal family is governed is a model for the ideal form of government. This is often a matter of how your real family is governed, though some people rebel and adopt an opposite ideal.
Conservative moral values arise from what I call the Strict Father Family.
In this family model, father knows best. He decides right and wrong. He has the ultimate authority to make sure his children and his spouse do what he says, because what he says is right. Many conservative spouses accept this worldview, uphold the father’s authority, and are strict in those realms of family life that they control.
In this moral worldview, it is his moral duty to punish his children painfully when they disobey. Harsh punishment is necessary to ensure that they will obey him (do what is right) and not just do what feels good. Through physical discipline they are supposed to become disciplined, internally strong, and able to prosper in the external world.
What if they don’t prosper? That means they are not disciplined, and therefore cannot be moral, and so deserve their poverty. In this conservative view, the poor are seen as lazy and undeserving while the rich deserve their wealth. Responsibility is thus taken to be personal responsibility, not social responsibility. What you become is only up to you, not society. You are responsible for yourself, not for others.
The Conservative Moral Hierarchy
The strict father logic extends further. The basic idea is that authority is justified by morality (the strict father version), and that, in a world ordered by nature, there should be (and traditionally has been) a moral hierarchy in which those who have traditionally dominated should dominate.
Why do conservatives love Trump (who harms them) and hate healthcare (which helps them)? It makes more sense when you consider the conservative moral hierarcy.
The Conservative Moral Hierarchy: • God above Man • Man above Nature • The Disciplined (Strong) above the Undisciplined (Weak) • The Rich above the Poor • Employers above Employees • Adults above Children • Western culture above other cultures • America above other countries • Men above Women • Whites above Nonwhites • Christians above non-Christians
• Straights above Gays
Economic View: Why Trying New Things Is So Hard to Do

The Great American Single-Family Home Problem

Economic View: Why Trying New Things Is So Hard to Do
Microsoft Research and Microsoft Azure improve the efficiency and capacity of cloud-scale optical networks

Today, at HotNets 2017, the Sixteenth ACM Workshop on Hot Topics in Networks, we shared with you some important research results from Microsoft Research and Microsoft Azure that show how we can increase the capacity of optical networks without purchasing new fibers.
Data, data, data – it’s all about the data
Our journey to understand and improve optical networks began several years ago. To innovate we first needed to measure the operational efficiency of our optical networks. This proved challenging. Microsoft is one of the largest cloud providers on the planet, with a huge number of optical links in our wide-area networks and data centers. We were unable to locate a tool or reference in the scientific literature about measuring the operational efficiency of massive scale, production operational networks. So, we built what is perhaps one of the world’s largest network monitoring tools to see what was happening under the covers. Sure enough, we found interesting things. But, I am getting ahead of myself, let me step back and cover some basics first.
Optical networking in Microsoft
Microsoft spends hundreds of millions of dollars building datacenter networks across the world and then interconnects them using a wide-area backbone network. Reducing cost and improving the efficiency and availability of these networks is central to our ability to provide cost-effective cloud services.
Our backbone network spans the globe. Within the United States alone we have well over tens of thousands of kilometers of lit optical fiber interconnecting more than 35 cities with well over hundreds of terabytes per second of bandwidth capacity. As Yousef Khalidi, Corporate Vice President of Microsoft Azure, noted in March 23, 2017, blog post about innovating and developing unique solutions in optical networking, optical gear is expensive. For every 100 gigabits per second, Microsoft spends roughly tens of thousands of dollars just on the optical equipment. To support the continuously exploding demand of the cloud, efficient use of deployed fiber, especially in wide area networks, is imperative.
A few years ago, we invented a new software control system called SWAN, short for software-driven wide-area network, which we described in a paper presented at the 2013 conference of the Association for Computing Machinery’s Scientific Interest Group on Data Communications, known as SIGCOMM. With SWAN, we effectively doubled the efficiency of our backbone networks. That effort, however, did not touch on the network’s physical layer. So, we began considering other ideas to enhance the efficiency while reducing the cost of our global networks. We started to investigate how we could optimize the operation of the physical layer of Microsoft networks.
Squeezing additional juice from existing fiber in our backbone network
While optical characteristics are key to the network’s traffic carrying capacity, we found that the research and practitioner communities are only beginning to explore the operational characteristics of deployed fiber. Engineers had performed simulations, but not made measurements. To better understand the operational efficiency of our networks, we began collecting data from all transceivers and amplifiers in our optical backbone. We have been collecting this data since 2015. We augmented static segment-based simulations to wavelength–based measurements by continuously monitoring thousands of wavelengths in our backbone network every 15 minutes. We developed new analysis techniques to quantify their end-to-end quality and ability to carry more data and produced some important results.

This figure shows the cumulative distribution function (CDF) of the capacities of links if they were to be utilized according to their SNR.
Our analysis of the signal-to-noise ratio, or SNR, of optical links over a period of two years shows that there is tremendous opportunity to improve the efficiency of existing fiber deployment. For example, capacity of 99 percent of the 100 Gbps segments in our network could be augmented to 150 Gbps by simply changing the modulation format at the two ends, keeping the fiber and intermediate amplifiers unchanged. Interestingly, 34 percent of the segments could be driven at double their capacity, i.e., 200 Gbps.
Microsoft Research together with Microsoft Azure presented our results at the 2016 Optical Networking and Communication Conference and Exhibition. Since then, we have packaged our measurement and data-driven analysis techniques into a real-time performance and failure monitoring engine for the optical layer.
Helping the industry – Making the Data Available to Data ScientistsOver the last six years, I have seen ~50 papers appear in top networking conference. They study optical WAN topology, failures, performance, routing, and traffic engineering but they mostly focus on the IP-layer. Underneath the IP layer is the physical layer and it includes thousands of miles of optical fiber. Unfortunately, before us the optical layer had gone largely unexamined. After building our massive-scale telemetry system to measure optical signals, in the spirit of collaboration and improving the state-of-art, we released our dataset to our colleagues in academia and industry. This dataset includes 14 months of data from 4000 optical channels carrying live traffic. We believe this dataset is the first public release of a large-scale optical backbone and we at Microsoft hope that it will provide researchers a unique opportunity to study temporal behavior of optical links, their quality of signal, transmit power, dispersion, correlation among channels, correlation among optical links, and more. We presented a few results from our analysis of this data at the 2016 Internet Measurement Conference and were honored with the “best open dataset award” from the community. Specifically, we showed that optical signals are strong predictors of link failures in the WAN and we described how Microsoft’s state-of-art software defined WANs were incorporating optical layer measurement and derived characteristics in our management substrate. For more information about our dataset check out our project, Wide-Area Optical Backbone Performance. |
Adapt when you can – it is good for the network
Building on our earlier work, we concluded that instead of operating our optical networks using fixed link modulation, the smart thing to do is to adapt the modulation, and therefore the capacity, of the optical links based on the receiver’s SNR values. This type of adaptation is a well understood and prolifically used technique in modern-day wireless networking, including the hugely popular Wi-Fi networks.
Based on these results, Microsoft Azure made the decision to purchase bandwidth variable transceivers that can vary modulation to achieve data rates between 100, 150, and 200 Gbps depending on the SNR of the fiber path. Check out the figure above and notice the three colored lines are for different data rates and notice how 100 Gbps networks can easily be operated at 150 Gbps. The measured data convinced us that we should purchase bandwidth variable transceivers instead of the industry standard fixed, higher-order modulators and operate our networks at higher speeds.
Today, when the SNR of an optical signal drops below its pre-determined modulation threshold, the link is declared down and is considered a failure in the IP layer. We analyzed several months of failure tickets and noticed that some of the link failures were caused by SNR degradation and not complete loss-of-light. This finding provided us an opportunity to replace link failures by link flaps wherein the capacity is adjusted according to the new SNR. These results are included in our HotNets 2017 paper. We also analyze the capability of state-of-the-art bandwidth variable transceivers and quantify the hardware switching latency in reconfiguring link capacities. Our results show the possibility of reducing this latency from 68 seconds to 38 milliseconds. We are optimistic that our efforts in this direction can make dynamic capacity links feasible in wide-area networks.
Optical networks are literally the backbone of the Azure Cloud and our quest to extract the maximum out of these networks continues.
Related:
- Lighting up network innovation
- HotNets 2017: Sixteenth ACM Workshop on Hot Topics in Networks
- Achieving high utilization with software-driven WAN
- Evaluation of elastic modulation gains in Microsoft’s optical backbone in North America
- Elastic Optical Networking in the Microsoft Cloud
- Run, Walk, Crawl: Towards Dynamic Link Capacities
- Wide-Area Optical Backbone Performance
The post Microsoft Research and Microsoft Azure improve the efficiency and capacity of cloud-scale optical networks appeared first on Microsoft Research.
Things Many People Find Too Obvious to Have Told You Already
Article URL: https://threadreaderapp.com/thread/936615043126370306
Comments URL: https://news.ycombinator.com/item?id=15826445
Points: 813
# Comments: 481
Pottery Is the New Pilates, and Macramé Takes Away the Crazy

Parents now spend twice as much time with their children as 50 years ago
Article URL: https://www.economist.com/blogs/graphicdetail/2017/11/daily-chart-20
Comments URL: https://news.ycombinator.com/item?id=15800082
Points: 382
# Comments: 321
hnrss is a labor of love, but if the project has made your job or hobby project easier and you want to show some gratitude, donations are very much appreciated. PayPal and Bitcoin both accepted. Thanks!