Shared posts

16 Jul 23:15

Pay The Cost of Tough Compromises

by Richard Millington

A potential client explained they would have to use a community platform neither of us liked because it was part of a CMS package they had just agreed to use.

Another noted their staff wouldn’t be allowed to participate in a community and they couldn’t let members talk about some of the most controversial product topics.

It’s incredibly tempting to agree to concessions like these to move a project forward. Often they’re presented as immovable facts which are impossible to change. But these are community-killing compromises. They will always come back to haunt you.

Organizations are far more flexible than they often admit. It’s down to you to do the hard work of building the relationships internally, putting together a clear (visual) case, and then standing your ground.

For sure, adapt the community’s goals, its concept, and many of the tactics to suit the organization’s objectives, its audience, and its resources. That’s the nature of collaboration. But never use a terrible platform, agree to topic-restrictions, or rules which are clearly going to hurt the community.

16 Jul 23:15

Apple’s new 2018 MacBook Pros

by Rui Carmo

Nice to see there are incremental updates again, but (like many other folk) I’m more curious about the keyboard improvements and whether it’s more reliable now. The new screen and beefier CPUs seem nice, though.

16 Jul 23:15

Changing Twitter, with Statistics

by Nathan Yau

Earlier this year, The New York Times investigated fake followers on Twitter showing very clearly that it was a problem. It’s hard to believe that Twitter didn’t already know about the scale of the issue, but after the story, the social service finally started to work on the problem.

Nicholas Confessore and Gabriel J.X. Dance for The New York Times:

An investigation by The New York Times in January demonstrated that just one small Florida company sold fake followers and other social media engagement to hundreds of thousands of users around the world, including politicians, models, actors and authors. The revelations prompted investigations in at least two states and calls in Congress for intervention by the Federal Trade Commission. In interviews this week, Twitter executives said that The Times’s reporting pushed them to look more closely at steps the company could take to clamp down on the market for fakes, which is fueled in part by the growing political and commercial value of a widely followed Twitter account.

This is statistics driving positive change instead of just advertising. I’m ready for more of this.

Tags: fake, New York Times, Twitter

16 Jul 23:15

Celebrating our teachers

by Dan Fisher

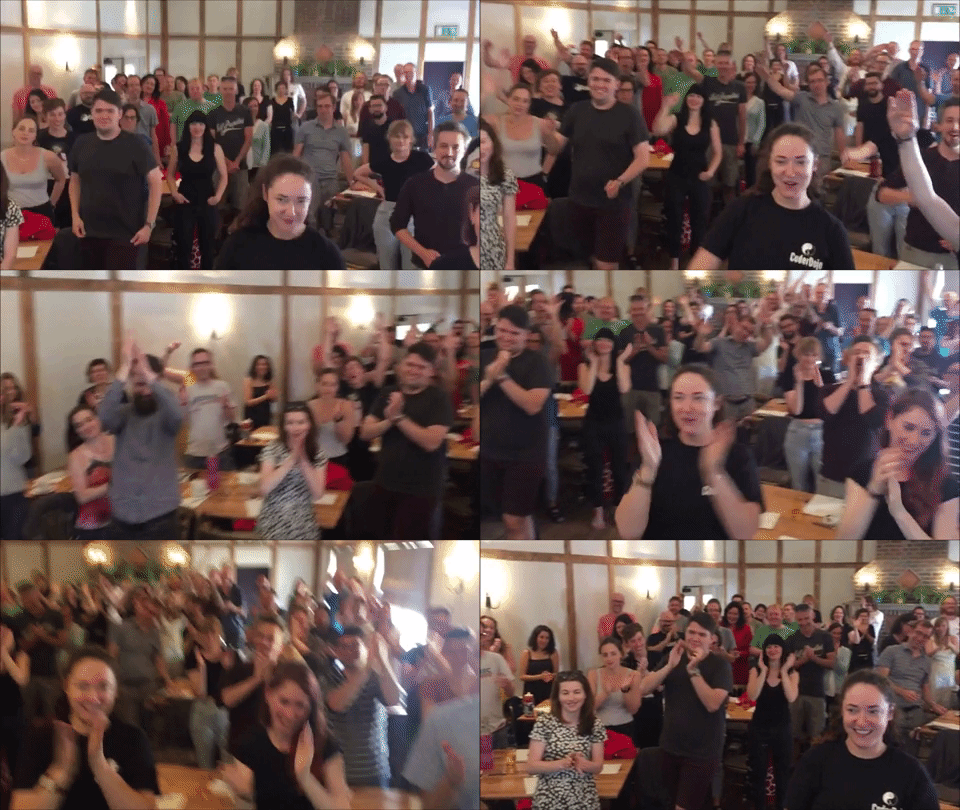
The end of the academic year is here, and we are marking the occasion by celebrating teachers from all over the world.

Raspberry Pi Teachers Computing highlight 2018

For those about to teach, we salute you.

Since last September, we’ve run a whole host of programmes that teachers have been involved in. From training with us at Picademy to building apocalyptic projects for Pioneers, from running Code Clubs, Dojos, and Raspberry Jams to learning tea-making algorithms on our free online training courses, these brilliant people do amazing things on a daily basis. And even more amazingly, they somehow also have the energy to take their knowledge into schools and share it with their learners to get them excited about computing too.

Dr Sue Sentance, the Raspberry Pi Foundation’s new Chief Learning Officer, has trained teachers for many years and understands better than most the impact a good teacher can have:

“When thinking about teaching Computing, we often get so caught up in the technology — what software, what kit, what environment, etc. — that we forget that it’s the teachers who actually facilitate students’ learning and inspire and motivate the students. A passionate and enthusiastic teacher is more important than which device or tool the students are using, because they understand what will help their students. “

In celebration of our education community, we asked teachers around the world to answer one big question:

“What has been your computing highlight of the year?”

Caroline Keep

Raspberry Pi Teachers Computing highlight 2018

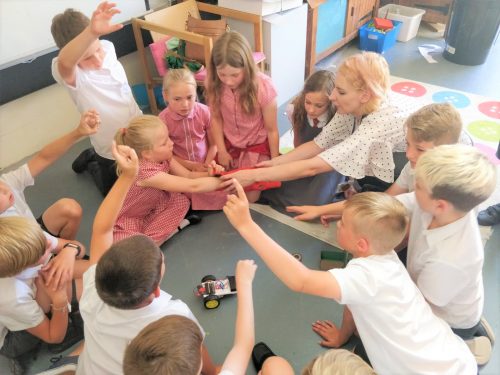
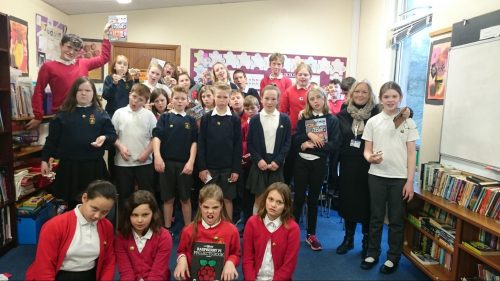
Caroline (top right) and her group of students at Spark Penketh

Caroline Keep won the TES New Teacher of the Year award and runs Spark Penketh, a school makerspace in Warrington. She will also be training with us in August to become a Raspberry Pi Certified Educator. Her highlight of the year was achieving success at the forefront of the UK’s makerspace movement:

“All the physical computing projects we’ve done since February when Raspberry Pi co-founder Pete Lomas opened our school makerspace (the first one in a UK state school) have been amazing! We’ve built and coded talking robots, and gesture-controlled ones on micro:bits with primary schools. We’ve built drones, coded Arduinos for European Maker Week, opened a RoboDojo, used Python and Node-RED on Raspberry Pi to control weather stations, Pi Camera Modules, and robots, and we’ve designed a Digital Creative pathway for Industry 4.0 skills for September. Next up are Google AIY Projects kits, Redfern Electronic’s Crumble, and Bare Conductive’s Touch Board. We can’t wait!”

Heidi Baynes

Raspberry Pi Teachers Computing highlight 2018

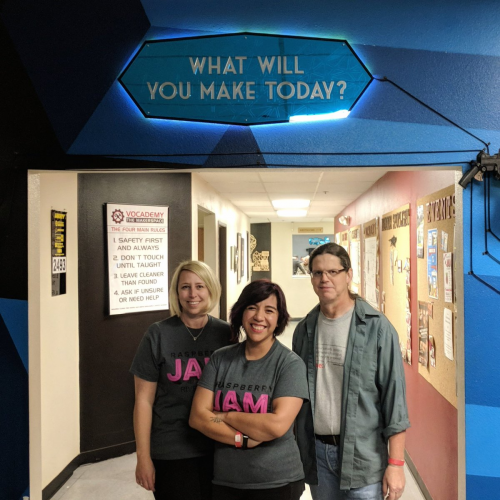
Heidi (left) and two other amazing US-based educators pose under a very apt sign. It’s like they planned it.

Heidi Baynes is an Education Coordinator for the County Office of Education in Riverside, California. Her highlight is a birthday party with a difference:

“The Riverside Raspberry Jam was held on 3 March 2018 as part of Raspberry Pi’s Big Birthday celebration. Fellow Picademy graduate Ari Flewelling and I planned the event in conjunction with Vocademy, and we were thrilled by the overwhelming support from the local community. The event featured a project showcase, workshops, and an introduction to all things Raspberry Pi. We can’t wait to start planning the 2019 Riverside Raspberry Jam! I was also particularly proud of the students from Mountain Heights Academy who shared their Raspberry Pi and micro:bit projects at the Consortium’s #CSforAll event in Riverside. Our student Hailey was able to share her experiences as part of a student panel and even had the opportunity to meet the CEO of code.org, Hadi Partovi!”

Amy Bloodworth

Raspberry Pi Teachers Computing highlight 2018

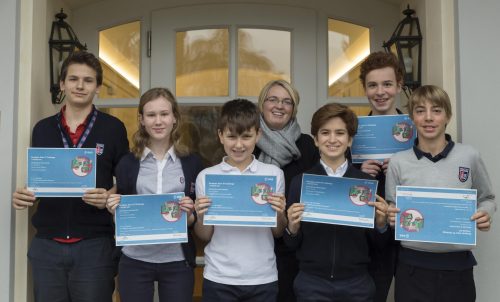
Amy Bloodworth and her Astro Pi–winning students

Amy Bloodworth is a teacher at The American School In Switzerland (TASIS) in Lugano, Switzerland. Her highlight is literally out of this world:

“It has been a busy year for us here in Switzerland. Highlights for me and my students include meeting a computer game designer, competing in the World Robot Olympiad, and participating in the Astro Pi Challenge. With Astro Pi, my students loved that they could send their coded message to the ISS astronauts in any of the languages of ESA. As we are an international school, so this helped the students feel more connected to the task. The Astro Pi Challenge hooked the students in and acted as a springboard for other activities, such as coding an ISS tracker that alerted them when the ISS was overhead, and other science experiments using the Sense HAT. Next year, I plan to start a new after-school club dedicated to competitive robotics.”

Janice Paterson

Raspberry Pi Teacher Computing highlight 2018

Janice Paterson’s lovely class of brain-eating zombies

Janice Paterson is the Principal Teacher at Wormit Primary in Fife, Scotland. Her highlight wouldn’t seem out of place in The Walking Dead:

“We loved the amazing open-ended challenge of a zombie apocalypse, courtesy of Raspberry Pi’s Pioneers programme. It was truly cross-curricular and completely immersive for all the young learners. The books were devoured for information/ideas, and the makeup kits inspired our imaginations and creative side. We had Pi-powered, zombie-detecting robots coded to offer assorted challenges, and micro:bits set up as zombie teacher detectors (their thermometers were used because, of course, teachers have hot bodies!). We all learned loads! The best bit was sharing it all with the rest of our Code Club and the whole school.”

Wojtek Zielinski

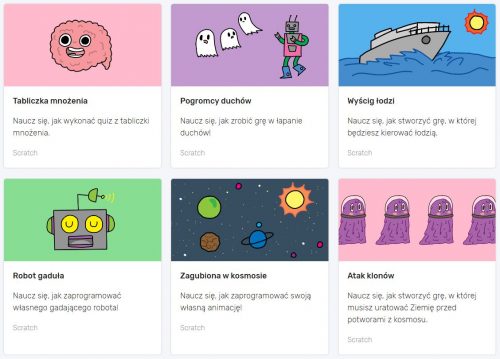
Wojtek Zielinski works in Poland as a teacher. His highlight was a breakthrough he had when working with the translated versions of our resources with his students:

“When children work with resources in English, they often end up following what’s in the pictures. They don’t understand why the game or the program they created works. Translated materials enable them to truly learn and understand programming concepts, and that empowers them to experiment and create more. Translations are therefore essential for learning.”

Our thanks

We are so grateful for everything our teachers do to help us make our programmes a success. Together we’ll be able to achieve our goal of making high-quality computing resources that are accessible to everyone!

As a quick aside, you might also be interested to read a recent interview with Raspberry Pi creator and co-founder Eben Upton about the positive impact his teachers had on him.

Whether you’re a teacher wanting to share your success, or you simply want to share your appreciation for the teachers who inspired you, tell us about it in the comments below.

And from everyone at the Raspberry Pi Foundation, there’s only one thing left to say…

Teachers, we salute you!

The post Celebrating our teachers appeared first on Raspberry Pi.

16 Jul 23:15

Rush Hour puzzle solver and generator

by Nathan Yau

The Rush Hour puzzle game was invented by Nob Yoshigahara in the 1970s and made its way to the United States in the 1990s. There are vehicles of varying length in a parking lot, and you have to figure out how to get one of the cars out by shifting all the others inside a six-by-six grid. Michael Fogleman wrote a solver and generator for the game, resulting in a database of 1.5 million puzzles.

Tags: game, Rush Hour

16 Jul 23:14

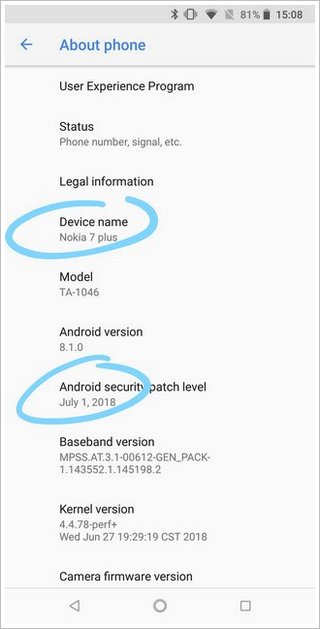
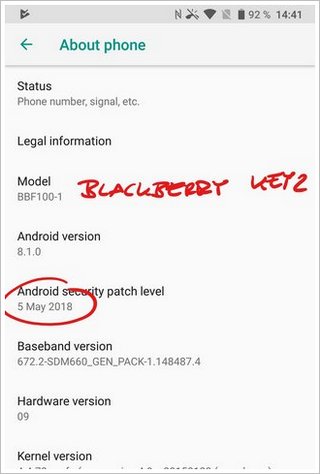
Android Security Updates

by Volker Weber

InkedScreenshot 20180713-150841 LI InkedScreenshot 20180713-144133 LI

16 Jul 23:14

10th Avenue in Vancouver ~ Health Precinct Changes Phase I

by Ken Ohrn

To make it easy for people to choose the bicycle as a way to get from “A” to “B”, you start by planning a network; step two is safe and effective infrastructure.

Vancouver’s 10th Avenue corridor spans Victoria Drive in the east to Trafalgar Street in the west, and connects to several north-south bike routes, like busy-busy Ontario, Heather, Cypress and the Arbutus Greenway.

The corridor sees around 500,000 bike trips per year, a good portion of which passes through the hospital precinct between Heather and Oak streets, which now has mostly-completed separated cycling and walking paths.

Here’s a gallery of some of the facility.

As usual, click any image to see a large size version.

Things to note:

  • separated bike lanes (and bike flow control at Oak & 10th)
  • pedestrian markings
  • motor vehicle zones for drop-offs (note wheelchair accessibility via ramped designs)
  • sidewalk markings for visual emphasis (orange with raised texture)
  • protective bollards to help reduce motor vehicle threats
16 Jul 23:12

Unfollowing Everybody

by Anil Dash
Unfollowing Everybody

At this point, there's nothing novel about noticing that social media is often toxic and stressful. But even aside from those concerns, our social networks are not things we generally think of as requiring maintenance or upkeep, even though we routinely do regular updates on all the other aspects of our digital lives.

Keeping in mind that spirit of doing necessary maintenance, I recently did something I'd thought about doing for years: I unfollowed everyone on Twitter. Now, these kinds of decisions are oddly fraught; a lot of people see their following relationships on social media as a form of status, not merely an indication of where information is flowing between people. But I decided to assume that the people I'm connected to know that me unfollowing everyone isn't personal, but really just a response to the overwhelming noise of having more than 5000 accounts sharing info with me on a single network.


How I did it

Okay, this part is gonna get slightly geeky, if you're not a coder, but I thought I'd explain the process in case anyone wants to repeat it.

Years ago, Twitter used to have a command-line interface for performing bulk or automated actions on an account. They abandoned it after a while, so Erik Berlin created a new command-line tool for power users of Twitter, simply called "t". It's written in Ruby (a language I basically can read but not really write) so it's easy enough to get running if you follow the few simple setup steps.

As Erik mentions in that documentation, you'll then need to set up a new Twitter app on your account, and get the credentials that will let the t tool perform actions on your Twitter account. (Note: I got some errors while updating and authenticating; making these edits to one of the ruby libraries that t depends on fixed the issue immediately.)

The Plan

At that point, I wanted to follow a few simple steps. These took a little longer for me because I was following over 5,000 people on Twitter, but if you're following a more reasonable number, none of these steps should take more than a few minutes to complete. This was my plan:

  1. Copy all the people I was following to a Twitter list, so I could still access them in my Twitter apps on all my devices, and I could still see my old timeline at any point if I wanted to.
  2. Archive all of the people I was following into a spreadsheet, so I could sort through them and filter for geography or how many followers they have or whether they were verified or not — basically any criteria that might be interesting when deciding who to follow (or not follow).
  3. Actually unfollow everybody and start over.

As it turns out, each of these steps is pretty easy.

Copying all your followers to a List

If you want to back up all of your followers, you only need to make a list and then populate it. You can make lists in most regular Twitter apps, but to do it at the command line it's simple: type in t list create following-`date "+%Y-%m-%d"` to make a list named after the current date, so you can easily remember this was a list of who you were following as of today. You can pretty easily understand the t syntax here — commands like list create are pretty self-explanatory.

Next, we have a slightly more elaborate command to copy all of your followers to the new list; you'll dump out a list of everyone you follow, and then pipe that into another t command to add them to your new list. It works like so: t followings | xargs t list add following-`date "+%Y-%m-%d"`. (If you're like me, you'll be doing all this stuff around midnight, and the date will change in the middle of it, and you should just type in the current date instead of using date variables.)

That's it! Now you've got a list of all your followers, and if you browse that list in your Twitter client app, you should see the exact same thing as your regular timeline. Do note, though, that Twitter lists don't function well with more than a few thousand followers. It took hours for all 5,000+ of my followers to show up on the list, and in the interim the counts of how many people belonged to the list were often incorrect.

Archiving your followers into a spreadsheet

This one is just a fun thing to do in general, if you like to slice and dice data about your social network. t supports exporting a pretty broad set of data about your followers, not just their names and Twitter handles, by allowing for a "long format" export with complete data. You get stuff like how many favorites (likes) they have on Twitter, when their account was created, and how many people they follow or are followed by. Frustratingly, Twitter no longer makes it easy for this data export to include whether that person follows you or not; that requires an additional query.

You'll use CSV (comma-separated values) as the format for exporting your data into a spreadsheet. And good news! t supports that natively. So your command will look like this: t followings -l --csv > followings.csv which basically says "Export my followings, in long format, to a CSV file named 'followings.csv'." Once you do that, you can open it up in Excel or Google Sheets in a few clicks, and you're all set.

Unfollowing Everybody

After all the people I followed were in a spreadsheet, I was able to sort by how many followers or followings they had, and also their last update, and I found friends who'd passed away whose accounts had been dormant for years, or joke accounts whose relevance had expired, or quiet voices with small networks that had been drowned out amongst the cacophany of the many other voices I was hearing each day. I found this part to be a really worthwhile exercise, and definitely decided to follow fewer people with huge networks and lots of reach.

Actually unfollowing!

Then, it was time for the main event: actually unfollowing everybody. I don't think this will be as much of a problem for other folks, but trying to run a single process of unfollowing everybody had me repeatedly running into Twitter's rate limits, where they try to keep any app from performing too many actions on your account in too short a period of time. I ended up writing a simple script to do the unfollowing in batches, then pausing for a few minutes, then starting up again.

But with a more reasonable network, the command to unfollow everyone is extremely simple:

t followings | xargs t unfollow

It'll chug away for a few minutes, and then that's it! You're not following anybody anymore. Except it might still look like you are.

In my case, my follower count was wrong for days, and kept showing wildly inaccurate information like insisting that I was following one of Mike Pence's official accounts. (Needless to say, that was never the case.) All of this is due to a architectural decision called eventual consistency, which helps enable Twitter to scale to its massive size, but doesn't do as good a job of handling unusual circumstances like being able to immediately see the correct list of followers for someone who has just unfollowed thousands of accounts.

Nevertheless, the deed was done. I refollowed a few essential accounts (my family, @Glitch and @Prince, and was ready to start anew.

Lessons learned

It's been about a week and a half, and, well... Twitter is a lot more pleasant. I've chosen a handful of accounts to follow each day (most ones that I followed before, some entirely new to me) and it's made a big difference. On the flip side, about 100 people seem to have unfollowed me after I unfollowed everybody, and I hope they hadn't felt obligated just to reciprocate if I was following them before. (That might also just be how many people unfollow me in a given week, I dunno.)

One of the most immediate benefits is that, when something terrible happens in the news, I don't see an endless, repetitive stream of dozens of people reacting to it in succession. It turns out, I don't mind knowing about current events, but it hurts to see lots of people I care about going through anguish or pain when bad news happens. I want to optimize for being aware, but not emotionally overwhelmed.

To that point, I've also basically not refollowed any news accounts or "official" corporate accounts. Anything I need to know about major headlines gets surfaced through other channels, or even just other parts of Twitter, so I don't need to see social media updates from media companies whose entire economic model is predicated on causing me enough stress to click through to their sites.

Similarly, I've focused a lot more on artists and activists and people who write about the stuff I'm obsessed with in general — Prince or mangoes or urban transit or the like. That brings a lot more joy into my life, and people writing about these other topics offer alot more inspiration for the things I want to be focused on. Oddly, given that my job is being the CEO of a tech company, I follow far fewer people in tech, and almost no tech company accounts except for my own. Despite that, I've missed almost nothing significant in the industry since making this change.

The algorithm is learning

Most interesting to me is how the suggested content and accounts on Twitter have changed since I changed my network. Before, much of the suggested headlines or featured Tweets in my Twitter apps would be from categories like "Technology VC"; now they're much more likely to be about "Climate Change" or "Comedians" than about inside-baseball tech talk.

On the less positive side, Twitter still suggests that I follow accounts that are almost entirely men, and overwhelmingly white American men with verified Twitter accounts. This is bizarre to me as I'm now following nearly 100 accounts, and they're basically the same mix of races and genders and geographies that I've always been interested in hearing from. I would have expected Twitter's follow-suggestion algorithm to be at least as adaptive as its content-suggestion one, and hope that it'll get updated to feature accounts that don't fit the usual privileged patterns. (I do still follow a lot of verified accounts, but some of that is due to an oddity I've just realized, which is that a lot of my friends have verified accounts. Look, ma — I'm a big-city elite!)

What Follows

I don't have some grand takeaway about what all this means; obviously, I've been thinking about the design and impacts and best use of social networks on the web for basically as long as they've existed. I strongly believe we should be intentional in how we use our networks, and even spent years building tools to encourage that, though the corporate interest of the major social networks precludes building a business around encouraging healthier use of their platforms.

But I'm happy for making a conscious decision about managing my network, and I lament that it takes a pretty extreme level of technical knowledge to be able to do so. I first wrote about Twitter when it was only a few months old, talking about its promise and predicting that Twitter would adopt @messaging and adapt to other ways its community was inventing new behaviors. Some of that happened, but of course most of what power users (and vulnerable users) wanted was never created.

I've also written a good bit about the peculiarities of having a large network in social media, like Twitter's early practice of suggesting which accounts to follow (including mine!) and what it's like to have the social network of a famous person without actually being famous. I think a lot about why I "favorite" (or like) so many things on various networks. And I also hope people can think more broadly about the ways the design of social networks intersects with how we see ourselves, and how we see social status, as best exemplified by the huge social anxieties around what it's like being verified on Twitter.

And ultimately, I come back to what I wrote a few years ago when I first decided to stop retweeting men (a practice I've followed for about half a decade now):

If you’re inclined, try being mindful of whose voices you share, amplify, validate and promote to others.

It's still a really important point, and to this list I would only add: Also be mindful about who you follow. And don't be afraid sometimes to reset and start over.

16 Jul 23:12

Three Mistakes Cities Keep Making

by Gordon Price

An irresistible article from The Guardian:

Too often, cities think they’re unique and repeat the blunders that others have made before them. Here are three of the worst ideas that keep getting recycled …

Build a big mall to ‘revitalise’ the city

The gigantic out-of-town complex Centro was the centrepiece of Oberhausen’s efforts to halt economic decline and turn the German city toward post-industrial success. …. As much of the retail and service activity in the city gravitated to the new mall, many mom-and-pop businesses downtown couldn’t stay afloat. The once-vibrant streets of the city centre were gradually taken over by discount stores, empty shop fronts and visible decay.

Bury’ cars to improve the downtown core

The “Five Star” development strategy of the city of Tampere involves adding new housing and jobs, a new tram system, and prioritising pedestrians and cyclists. In order to achieve this deluxe downtown experience, the city is building underground parking facilities and a tunnel to clear the roads of cars. A clear and effective concept, one might think.

But congestion in the city wasn’t even an issue before the city completed two costly Five Star projects: a 1,000-space parking garage, and a tunneled highway section. The effect has been to increase the number of cars the city centre can accommodate – and the number of cars has duly increased.

Build a highway on the waterfront

In 2015, despite lengthy community campaigns for tearing it down and plans for high-quality waterfront urbanist interventions, Toronto decided to keep the Gardiner Expressway in place, cutting the city’s waterfront off from the rest of its downtown. …

The Estonian capital of Tallinn has decided to invest in a brand-new downtown highway, in order to grant easier harbor access to trucks. In the process, it will pave over one of the city’s only seaside parks. As a kind of absurd flourish, the city has promised to build a shiny promenade and public space in the only narrow stretch of land that now remains between the sea and multiple lanes of traffic.

Full article here.

16 Jul 23:12

The Fourth Mistake: More Parking

by Gordon Price

Daily Durning found another Great Mistake to add to the list, from Streetsblog: 

Parking spaces are everywhere, but for some reason the perception persists that there’s “not enough parking.” And so cities require parking in new buildings and lavishly subsidize parking garages, without ever measuring how much parking exists or how much it’s used.

Now new research presents credible estimates of the total parking supply in several American cities for the first time. The report from Eric Scharnhorst at the Research Institute for Housing America, an arm of the Mortgage Bankers Association, provides city-level evidence of the nation’s massively overbuilt parking supply and the staggering cost to the public [PDF].

Scharnhorst states:

After decades of requiring parking for new construction, car storage has become the primary land use in many city areas.

In Seattle, one-third of the city’s parking supply is located in downtown garages.  … the parking occupancy rate downtown is 64 percent. …

Scharnhorst concludes that cities should change course, and that in places with excessive parking developers should “allocate capital to non-parking uses” — a.k.a. housing, commercial buildings, and, in general, the sorts of things that make cities habitable for people instead of cars.

Images: Research Institute for Housing America

16 Jul 23:12

I Made a Coptic Stiched Book

by peter@rukavina.net (Peter Rukavina)

One of the challenges I face in learning about bookbinding is a striking inability to think clearly in three dimensions; it’s no wonder that my vocations to date have been firmly rooted in the comfortable two dimensional plane of printing.

No more so was this true than in my attempt to sew together a coptic-stitched book today, helped along by this video how-to.

Coptic binding is simple, at its heart, but it requires the ability to retain a three dimensional picture of where you’ve been, where you’re at, and where you’re going, and this is something almost beyond my abilities.

But I kept at it, and here’s what I made:

Coptic-bound book

Detail of stitching on the coptic-bound book

Coptic-bound book standing up on its end

Coptic-bound book laying open, flat

Inside cover of the coptic stitched book

My stitching went off the rails a few times; most of the time I managed to wrangle things back into order, but there are a couple of gnarly bits there. Coptic stitching is a struggle to maintain just the right amount of tension in the cord to hold things pleasantly together, without making it tight enough to tear nor loose enough to flop around. I didn’t win that battle completely, and my book is a little too floppy for my tastes.

My big error in judgment was opting to use stock 20 pound printer paper for the inside pages; after dealing with the substantial living organism that is St. Armand machine made paper, constituted from rag not wood, stitching through Staples paper feels horrible and unforgiving and deeply unsatisfying. Never again.

That all said, the book does lay open flat rather pleasantly–coptic binding’s strong suit–and I was proud of my ability to translate the stitches on the video into stitches in reality.

I made the covers from the same sheet of “display board” I used to cover my hardbound book earlier in the week; I covered them with some lovely, thick green paper that Catherine gave me last year. The inside covers are Japanese paper from the same odds-and-sods lot I picked up at The Ikebana shop. The stitching is with green linen cord I purchased at the NSCAD art supply store a few years ago.

The only way I’m ever going to crack this thinking-in-3D nut is with practice, so I’ll make more coptic-bound books until I get it down.

16 Jul 23:12

The Fabrication that is OER

by Stephen Downes
Photo by the Author. Yours free to share.

OER stands for 'Open Educational Resources' and as readers know I have been a long-time proponent of free and open learning resources. So why would I call them a fabrication in the title of this post?

It's a response to OER @ 16, "Where are You?" by Gordon Freedman, a column published as a LinkedIn post. The fabrication is that OER is 16 years old. Freedman makes the case, though, with the narrative that has been popularly accepted in the field:
  • "The William and Flora Hewlett Foundation started OER down the path of making knowledge free and ubiquitous globally. From the Foundation's kick start in 2002 OER has not let up"
  •  "Also, in 2002, MIT boldly launched its Open Courseware (OCW) initiative, turning loose its entire faculty's instructional content to the world."
  • "The other critical lynchpin for OER, also in 2002, was the issuance of the first Creative Commons (CC) open licenses."
  •  "In 2002 as well, UNESCO held the 1st Global OER Forum, from whence the acronym "OER" was formally adopted."
The way this is phrased, it's as though this concept came into being in 2002. It is as though OER was an idea that crystallized at places like Hewlett and MIT and UNESCO and was held forth as "a clarion call to other institutions."

Nothing could be further from the truth. 2002 was the year the idea of open content was appropriated by these institutions and rebranded into something that would be institutional, sustainable, and market-driven.

The idea that any of these began in 2002 is absurd. I would be the last person to claim to have initiated open content, but the open access license on my Guide to the Logical Fallacies dates from 1995, a full seven years earlier.

In 1995 I was merely following a convention that had already been long established in the community, the idea that learning resources (and digital content generally) were for sharing. It's a concept that was well-entrenched in the idea of shareware (an idea that began two decades before before OCW).

*   *   *

There's another fabrication in the first few paragraphs of Gordon Freedman's article, a fabrication that it is equally important to note. It is found here:
  • "Since its inception, OER has taken on an almost global religiosity about its intent and purpose, and its opposition to the for-profit textbook and academic journal publishers."
It is restated here:
  • "There exists a tension between freely putting any type of materials, at varying quality levels, into the public domain—the religion, and those who look to the efficacy of these materials and the evolution of true high-quality learning goods and their effects—the science."
It is the depiction of the advocacy of OER as a movement, of the promotion of OER as akin to an article of faith, and overall the idea of open content as something that is fundamentally opposed to more rational approaches to knowledge and learning.

This will ultimately be cast as OER's weakness, and the call made to 'pragmatism over zeal' (if I may borrow the phrase). But this isn't an inherent aspect of sharing free and open content. It has to be invented, and it was invented at once by the institutions promoting OER in 2002 and by those opposing it.

When we made mixtapes in the 1970s, we weren't acting as missionaries, we were just sharing music. When we traded programs on those same tapes in the 1980s, we weren't evangelists, we were just making software. When we posted on Usenet and released Mudlibs in the 90s, we were just doing what we do.

And this hasn't changed. It's like Alessia Cara sings in the 2010s, "we make our breaks, if you don't like our 808s, then leave us alone."

*   *   *

The third fabrication is a bit more subtle but it is no less damaging. It is two-fold. The first part is, in essence, the idea that the proponents of free and open content don't know what they're doing, and hence, in the second part, it is the idea that free and open content has not been successful.

The two concepts are inextricably related. If your objective is to fly an airplane, then the fact that you don't know how to fly an airplane is going to be a direct contributing factor in your failure to actually fly an airplane.

If, however, you never intended to fly an airplane in the first place, then you cannot be said to have failed if you didn't do so, and the inability to fly an airplane becomes pretty irrelevant. It all has to do with what we call 'success'.

First, let's consider the expertise:
  • "Publishers move forward with little transparency managing the market testing, development, editorial, marketing, and publishing very carefully. They are matching well developed content to very specific needs in the market. They are experts at this. OER, to date, is not."
And second, to the failure:
  • "Education loses... it can't make wide use of OER because it is not tied into a system like the publishers', where quality, authorship, editorial, marketing, and publishing processes know how to find what is most appropriate, apply it for the best effect, store the results, and make it easy to re-use."
When put this way, the deception, I think, becomes pretty clear. It is a very clear substitution of a product-oriented philosophy for the one that proponents of free and open content actually have, one that is based on making, sharing and interacting.

*   *   *

I think Gordon Freedman simply misunderstands how the rest of us see the world. Consider this:
  • "There is a battle to produce more and better educated people. This battle needs all the help it can get."
Now there are days where I have the feeling that there are people on the other side fighting against the idea of producing more and better educated people. But this isn't the point. The point is that it isn't a war and we're not in a battle for any such thing.

First, unlike proselytizers, proponents of free and open content sharing are not engaged in an effort to "produce" anything in particular, much less a particular sort of person. It would be nice if people had the opportunity to become better educated, but the idea that this is something we can manufacture on demand (against an unnamed opponent) seems absurd.

But second, and more to the point, even if this were our objective, a 'battle' and a 'war' would not be how we would want to approach it.We don't fight, we work, and we don't compel, we cooperate. There isn't some sort of global narrative driving our actions.

Freedman writes, "Open knowledge is flowing, albeit in a self-organizing way," as though this were a bad thing. But from where I sit, this is open knowledge working as it should.

Feldman sees OER as something that should be harnessed to support a particular objective:
  • "For the small group of players who formed the movement and are still active, it is a rewarding accomplishment to see OER in use worldwide. However, for those devoted to the replacement of textbooks and lowering the costs of learning materials, the OER promise isn’t as bright."
This may be true, but why should we care? We who create free and open content weren't put on earth to serve the interests of those who want some new kind of publishing industry.

The people I know (and maybe it's just me; who knows?) have never thought of education as a matter of finding, organizing and presenting learning content with the objective of producing a certain type of person.

Open content isn't about finding just the right content for reuse; it's about making it out of whatever you have at hand, without someone coming along and telling you that you're not allowed to do that.


*   *   *

Who are we trying to be? What would constitute success?
  • "The five largest companies in the world by market value are Apple, Amazon, Alphabet, Microsoft, and Facebook. These are largely companies that have services that are tied together using content managed by data science."
I think that there's no doubt that these companies are commercial successes. But the idea that they have been successful publishers is a much more contentious point. And let me draw this out more fully:

First, the idea of these companies as content producers would be laughable. Though they have all dabbled, none of them has succeeded as a publisher. They are, all of them, tools and platforms.

That's significant because, without us, none of them would have been successful. Does anyone remember Apple's Rip, Mix, Burn slogan?

All of these hugely successful companies built that success on our freely created and shared content. On our websites, which Google indexed. On our videos, which YouTube shared. On our conversations, which Facebook streamed. And the rest of it - productized, commercialized, and sold to advertisers as 'content'.

This is significant, because the 'success' of these companies, like so many industries before them, has consisted largely in polluting the environment they inhabit, privatizing the commons they share, and ultimately, undermining the core filaments of knowledge, understanding and interaction that inform our democratic institutions and give us a society worth living in.

This isn't success. This may be what Freedman wants:
  • "The keys to content kingdom – natural language processing (NLP), machine learning (ML), and artificial intelligence (AI) – which are the brain children of the best universities or university educations, haven’t picked up the reigns of sorting through what learning resources belong with what education operations for what students toward what careers."
This isn't picking up the reigns. This is picking at the entrails.  It's finding what you can scavenge from the work of other people and then acting like you invented the whole thing.

*   *   *

The final fabrication in this article is that success belongs to those who are in it for the money.

Now to be fair, it's not clear that Rice University's Connexions (later rebranded as OpenStax) and Salman Khan (of the self-styled Khan Academy) started out seeking the money (though Rice, I think, did). The main point here is that they took the money, and that in Freedman's eyes, this is what made them successful.
  • "Each is a gold standard within its domain. OpenStax produces open textbooks that rely on the same diligence of commercial publishers. They can do so because of the ample support from the Hewlett Foundation, the Arnold Foundation, the Gates Foundation, and others."
Now these are only a limited success, because they are essentially subsidized publishing. For Freedman, real success would look something like Netflix or Expedia or Zillow.
  • "If the creators and funders of OER want to change education at scale in an equitable and effective way, not just spawn learning resources generally and park them repositories not known to most educators, it will require a marrying of what Silicon Valley has wrought and with what educators and learners need."
I have never received - nor do I expect to ever receive - funding from Gates or Hewlett or the rest of them. This might be because I am unattractive, but I think it's mostly because I've never dated Silicon Valley and never considered desiring to marry what they do with what I do.

I'm not interested in collecting, institutionalizing, and marketing educational content as a product. Maybe there are some people in OER who are really interested in this aspect of it (and they tend to collect together, write manifestos, work with institutions, and collect all the funding). But I'm not, nor are, I think, the vast majority of people who actually produce and share free and open learning content.

I'm not going to say "it's about community" or "it's about teaching" or any of the things people typically say at this point, because it's about none of these, and all of these, about nothing in particular, and about what each of us wants to do.

*   *   *

And my manifesto is that we're not done.

We have created a beautiful world of billions of images, videos, articles and messages that we've shared back and forth with each other since the 1980s and this world is our heritage and our legacy.

This is the world that we need to protect - not to institutionalize, but to make it so that it can never be institutionalized, but freely used to create and share anew so long as there is a world to do it in.

There's more to come, and we've only just reached the end of the beginning.

16 Jul 23:12

MacBook Pro :: Tasten mit Kondom

by Volker Weber

Die Amis haben einen Ausdruck, der sinngemäß sagt, da stehe ein Elefant im Zimmer, aber niemand spreche darüber. Beim MacBook Pro ist das die Tastatur, die von kleinen Krümeln oder Staubteilchen lahmgelegt werden kann. Apple hat ein vier Jahre gültiges Reparaturprogramm aufgelegt, um das Problem in den Griff zu kriegen. Nun gibt es ein neues MacBook Pro und Apple spricht von einer "leiseren" Tastatur. Hört selbst:

Was macht die Tastatur leiser? Eine Silikon-Membrane zwischen Taste und Mechanismus. Was könnte die noch machen? Staub und Krümel aus dem Mechanismus halten. In einem Land, wo man auf Pappbecher drauf schreiben muss, dass Kaffee heiß ist, damit man nicht auf Millionen verklagt wird, kann das natürlich niemand zugeben.

Ergo: Problem gelöst. Neues MacBook Pro kaufen. Keins der alten kaufen, d.h. alle MacBooks ohne Touch Bar. Das 2015er MacBook Pro 15" mit der robusten Tastatur, Magsafe und den vielen Ports hat Apple aus dem Programm genommen.

16 Jul 22:34

k-means clustering

by Joe Gregorio

A simple demo of k-means clustering. The little squares are the observations and the cirles are the centroids. Press the 'Step:' button to step through the algorithm.

Restart
16 Jul 22:34

Arbutus Centre: Park impact

by Stephen Rees

Block D will replace what now remains of the existing mall. It is a three storey building. The Main Floor now houses the liquor store, bank, Safeway (pharmacy and convenience store only) and the dance studio. The top floor used to be offices but is currently unoccupied. The building sits on a basement car park with what used to be the Village Recreation Centre which is now used by the Dance Co with a pool now rented to a company which teaches children to swim. That part of the building although underneath the stores is at ground level on the park side.

IMG_3565

This views is taken from the path through the park looking south east. Immediately in front is the pool and the roof of the atrium between the liquor store and Safeway can be seen at the top of the building. Behind it is one of cranes in use to construct blocks A and B.

Screen Shot 2018-07-14 at 12.30.11 PM

^

In the drawing, the point where I was standing to take the picture would be on the bottom edge midway, looking south east.  I have put a ^ mark in the title space which ought to line up no matter what screen you are using to view this.

So the pool block gets replaced by the row of town houses set in echelon along the path. Behind that looms Block D. Here are the elevations for that block – west and north respectively.

Screen Shot 2018-07-14 at 12.34.48 PMScreen Shot 2018-07-14 at 12.34.12 PM

Block D will be twelve storeys high or 72m (236ft) geodetic datum. But sits on land one storey above the park ground level – to the right of the image above. The extended Yew Street is on the left of this view.

The crane is currently constructing blocks A and B which were granted permission for 8 and 6 storeys respectively. Since the crane has to work over the 8 storey structure, the tip of the vertical tower of the crane is probably a good indicator of where the roof of the proposed block D will be.

Unbelievably the design panel and staff reports both draw attention to the impact on the park – and use words like “massing” and “shadowing” to characterize the issue. But that is not enough in their view to stop the proposal. They both indicate that somehow this can be mitigated even though the developer will have been granted permission to proceed. I simply do not understand why this council would approve this proposal before any of the necessary changes have been designed. It is not at all clear how these impacts can be reduced. It is also not clear how staff will determine that the concerns have been adequately addressed.

fullsizeoutput_2726

This building was recently completed at the SW corner of West Boulevard and 37th Ave. It is pretty typical of what has been approved in recent years.

The Ridge

This is The Ridge at 16th Avenue and Arbutus.

Both of these are four storey buildings on a major arterial. What is proposed now is a building three times this height, overlooking a park.

AFTERWORD

The tweet below appeared on my Tweekdeck feed on Tuesday July 17 around 2pm

Screen Shot 2018-07-17 at 2.05.02 PM

16 Jul 22:31

It’s not really about immigration, is it?

Last week in London, a taxi cab driver struck up a conversation with me while taking me to Victoria station. “Ah, you’re American are you?” he asked. “Trump’s gonna be in town in a few days, you know,” he added.

Oh yes. I knew. I had been amused earlier that morning when reading that the Mayor of London had approved the Baby Trump Blimp.

“I hear you’ve got quite the welcome planned for him,” I replied.

“Oh yes. He’s doing a great job, you know. Speaks his mind. Doesn’t take the piss from anybody. And, he’s actually doing something about the immigration problem over there.”

Oh, my. It was early morning, and I wasn’t really in the mood for this kind of conversation. So, I tried to mumble my way incoherently to something more neutral.

That got me a minute or so.

“Where in the States are you from?” he asked. Well, at least there’s a way back to a neutral conversation, I thought.

“I actually live in Berlin now.”

“Oh, really!” he exclaimed. “Hell of a lot of immigrants there now. I hear they’re just flooding in, aren’t they? How’s it like living there?”

Shit. Ok, let’s do this.

“Well, actually, it seems better than you what you might be hearing. I know some of the locals are really unhappy about it. From my point of view, however, the only impact on my day-to-day life has been to make for long queues at the local government offices. And, really, given the reality of what they’ve come from, I can handle that.”

“Really?” he asked with surprise. “Still, I can’t imagine living with so many immigrants all around.”

Ah, for fuck’s sake.

“You know, since I’m American, I guess that makes me an immigrant as well,” I said. “My wife too. She’s from Greece.”

Silence.

Fifteen minutes later or so, we arrived at the train station. I paid. The cabbie drove off. And, I’ve been thinking about that conversation a lot in the days since and about how being white means I’m not one of those immigrants. Which means it’s not really about immigration now, is it?

16 Jul 22:30

Let’s Go to the Vancouver Folk Fest!

by Ken Ohrn

“But what about parking?”

“There’s lots, don’t worry”.

At the Vancouver Folk Music Festival 2018, now in its 41st year.

By the way, the infamous “Birkenstock 500” has been modified. Instead of the aggressive, early-morning free-for-all race to the main stage to claim prized spots on the grass for blankets, there is now a lottery among early arrivals, thus spacing out the action in a more civilized fashion.

16 Jul 22:30

Keeping Tabs On Links

by Rui Carmo

I have a long week ahead of me for various reasons (one of which is the need to spend some time in a US timezone to follow an internal event remotely), so I decided to clean up a bunch of things, including following up on last week’s upgrade.

Among other things (including the search buglets I’ve been expecting and an added sepia tinge for pages older than a year), I decided to fundamentally change the way I render tables, for three reasons:

  • Most of the top 10 consistently popular pages on the site (i.e., the ones people keep coming back to) are my “link tables” for various resources (like the Clojure and Python pages)
  • Most of those pages are still written in Textile, which is much better than Markdown for rendering complex tables but is an order of magnitude slower at rendering them, as last week’s profiler diagram hinted at.
  • Maintaining those link pages has grown to be a colossal pain over the years, since I was effectively managing the markup instead of the data in those tables, and cleaning them up was a chore.

So I thought a bit about how I want to manage the data inside all that markup, and decided to go with moving all the table data to YAML, allowing for custom ordering and trivial formatting as well as private comments:

---
head:
  date: Date
  link: link 
  notes: Notes
# I can sort on specific columns, and will 
# eventually add the ability to reverse the sorting order
ordering: [-date, link, notes]
formats:
    link: <a href="{url}">{link}</a>
    date: {date:%Y}
types:
    date: date
body:
- date: 2018
  link: some page elsewhere
  url: http://acme.inc/foobar
  notes: |
    I can edit or append to this programmatically with zero 
    hassle, and even add markup down the line
# this will be grouped with the above
- date: 2018 
  notes: No link here, but no problem either, since the formatter will just null the link column

I don’t really like YAML, but it beats JSON for quick editing over SSH and helps me enforce a schema while preserving the ability to have big dollops of text to annotate resources.

But it parses and renders much faster than Textile when using the C extensions to PyYAML, and makes it much easier to switch to something else down the line and consolidate the data across multiple sections of the site, possibly stuffing it into a ‘real’ database as necessary, and automating link checks for older content.

Data Migration

The painful bit, of course, is converting hundreds of tables across over 7.000 pages on this site, especially considering that, for aesthetic reasons, I always used rowspan to group together categories of resources in various ways–which makes the markup much harder to maintain, for starters, as well as utterly unfeasible to manually convert everything.

So, being fundamentally lazy, I injected a custom XML parser into the site’s rendering pipeline that dumps every table it comes across to a YAML file, and am letting this VM do first-pass conversions as visitors (and various web crawlers) visit each page.

This has the added benefit of making it obvious which are the pages most likely to benefit from the conversion, and turns each update into a trivial read through with occasional minor tweaks instead of a long, winding chore…

16 Jul 22:30

I get things wrong: sorry about that

by Stephen Rees

I was looking forward to a change of pace for a Sunday morning. Normally we get up – instead of lolling around drinking cappuccinos and playing on our iPads – and go to the Kits Farmers’ Market. That is a lot more fun than Safeway. But even so gets a bit predictable. So I was ever so pleased to get this email on July 6

Screen Shot 2018-07-15 at 12.50.49 PM Screen Shot 2018-07-15 at 12.51.13 PM

You might want to bear in mind that last paragraph: the one in bold.

You see, I went on line to Eventbrite and booked two spots – one for me and one for my partner. The webpage I did that from allowed to choose a time and indicated how many people had already booked at that time. In fact since I was on line as soon as I got the email it looked like I was the first to make any booking. I chose 10 am as the first available.

This morning there was another Greenpeace email that said I could, if I wanted to, join the press tour. But I am not press, nor is my partner. And the press tour was later and we had to be back home for something else at lunchtime.

We used transit: early morning Sunday there was not going be any issues – and the #16 gets close enough to SeaBus to make it almost but not quite seamless. This was also the first time I got to ride the new SeaBus: I really appreciate the lower windows. There will be pictures on flickr later.

So we got to the Burrard Dry Dock Pier in plenty of time. They were briefing the volunteers – and we found somewhere to sit in the shade until the 10:00 opening. But that time came and went – and there was now a long line up of people – most of whom had not bothered to book on line. There were not separate lines for those with and without tickets. And when it looked like things might start, all the people who had friends in the line joined them. So we were now at the back of a long line up in the sun. And eventually someone from the ship addressed the assembled throng. It was now 10:15 – and he was saying that they were still getting ready “thank you for your patience and it will only be ten to twenty minutes more”. Except that we were clearly not going to be in the first tour – and we could look forward to a very long wait in the sun before we could get on board.

At this point, we simply walked away.

IMG_3612IMG_3613IMG_3614

This is not the only thing I got wrong. Take a look at this chalk board

IMG_3597

Did you spot the % sign? Since the 1 is much larger than the oo my brain thought that said “one dollar and no cents” not “one hundred percent”

When we got back to Waterfront, I was puzzled why, if only one out of three escalators was working, why the one that was, was going down. There are plenty of installations on SkyTrain where there is only one escalator – and that always goes up. I was even more surprised to find that the #16 would not be picking up on Pender in front of SFU. A stop that I have used frequently. Even the Transit app on my phone did not seem to know that this stop is taken out of use on cruise ship days. Which must make some sense but at midday at a stop some distance from the terminal where the ships dock it was not immediately apparent to me.

But like I said, sometimes the world operates in ways that seem odd to me. I paid attention to the words like “valued” “vital role” “first to know” – just like I missed the % and saw $. Just like I expected the bus stop to be working and Transit app to let me know ahead of time. Just like I thought it might be easy to upload something from the SeaBus using its prominently advertised FREE WIFI. Which is why I spent 15 minutes waiting for this screen to be replaced by the one that would let me in to Create Guest Account

fullsizeoutput_272a


16 Jul 22:29

"A core challenge in the future will be how to redistribute money from the ever richer owners of the..."

“A core challenge in the future will be how to redistribute money from the ever richer owners...
16 Jul 22:28

Otto Frank desperately sought to get his family to safety, seeking asylum

by Andrea

Deutsche Welle: Anne Frank’s family tried to escape to US but couldn’t overcome restrictions: study. “Bureaucracy, war and suspicion prevented Anne Frank’s family being able to emigrate to the US from their home in Holland during World War II. Similarities with the US attitude towards current immigrants have been drawn.”

“New research from the Amsterdam-based Anne Frank House has shown Anne’s father Otto Frank made numerous attempts for the family to emigrate to the United States, starting in 1938.

“I am forced to look out for emigration and as far as I can see the USA is the only country we could go to,” Otto Frank wrote in 1941 to his American friend Nathan Strauss in New York.

The only American consulate in the Netherlands issuing visas had been in Rotterdam but it was destroyed during the German bombing of May 1940. All applications for asylum then had to be resubmitted, and the Frank family’s request was never processed.

As the US closed all German consulates, the Nazi regime reciprocated and ordered all American consulates to close in occupied and collaborationist territory. Frank’s efforts to get a passage to Cuba failed and after the Japanese attack on Pearl Harbor in December 1941, all transatlantic shipping was suspended.

It was then, in July 1942, that the Frank family went into hiding in the annex of his business premises on the Prinsengracht canal in Amsterdam where they stayed for two years before being discovered and deported, first to a transit camp and then to Auschwitz and Bergen-Belsen concentration camps.”

16 Jul 22:28

What does it mean for programs to be built using “whole values”?

by Eric Normand

John Hughes, FP researcher extraordinaire, says Whole Values is one of the principles of Functional Programming. But what does he mean? We explore this important concept.

Transcript

Eric Normand: One of John Hughes’s principles of functional programming is to use whole values. What does that mean?

Hi, my name is Eric Normand. These are my thoughts on functional programming.

Whole values is a subtle idea. It’s something that I think needs to be shored up and made more definite. He doesn’t ever explain it in definite terms anywhere. He just suggests we use whole values and gives some interesting examples of it.

I would like to try to define it, but I don’t know if I’m ready. I’m just going to explore the idea a little bit and see where it goes. The thing is I do believe that he’s right that this is an important thing in functional programming, it really helps.

I do believe in it. I use it myself, and it really feels right, but that doesn’t mean I could put what I’m doing into words. That’s what I’m trying to do right now.

Let’s imagine that we have some imperative algorithm, and this algorithm requires us to keep track of two different numbers. We make two variables, and we update each as they need to be updated.

For instance, if you wanted to calculate the average of sum of a list of numbers, you could initialize two variables to zero. One of them is called the sum and one of them is called the count. You iterate through the list. Every time you see a number, you add it to the sum, and store it back in sum.

Eric Normand profile image
Eric Normand
@ericnormand
twitter logo

To calculate the average of a list of numbers, you initialize two variables to 0, the sum and the count. They’re separate. What if you bundled them together in a tuple, because they are in a relationship. That would be a whole value.

ed.gr/w6pp

Fri Oct 26 15:01:05 +0000 2018
Twitter reply actionTwitter retweet action2Twitter like action4

You add one to the count and store it back in count. At the end you divide them out and you have figured out the answer. At each stage of the loop, each iteration through the loop you got these two numbers. You got the sum and the count, but they’re separate. There’s no indication in your program that they go together. They definitely do.

As you know, I’ve talked about calculating an average using the ratio, so that instead of storing the numbers separately, you put them into a tuple where you have a sum and a count in the tuple. That’s an example of keeping the values together and making them whole. Separately they’re not meaningful, but as a whole they are.

This lets you pass it around like an argument. You can have a much more coherent set of operations on them because you have both values all the time.

Eric Normand profile image
Eric Normand
@ericnormand
twitter logo

You can pass a whole value around like an argument. You can have a much more coherent set of operations on it because you have a whole value all the time.

ed.gr/w6pr

Sun Nov 11 16:01:42 +0000 2018
Twitter reply actionTwitter retweet action0Twitter like action2

When I’ve been reading about Smalltalk — again I bring up Smalltalk for some reason — but I think a lot of this stuff was known by the Smalltalk group. The original group in Smalltalk, the whole purpose of objects is to bundle two values together that need to be in a relationship, so that you can transactionally modify them to maintain that relationship.

That’s all we’re talking about is bundling values together into a composite value that those two values are kept in a relationship. It might be three, whatever.

Let’s come up with another example. I was doing some coding yesterday. It was a recursive descent parser. One of the things I needed was two values coming out of a…let’s say I parsed a number out of this stream of characters. I needed two things, the number that I parsed and the rest of the stream like where did I get to when I finished parsing the numbers. I bundled those up as a tuple.

If you extrapolate that to the whole architecture of the entire parser, not just parsing integers but parsing everything, you start to see that this bundling is very useful to be able to say, “Here’s the value that I’ve got and here’s the rest of the stream at all times.”

Then you could be adding to that stream, I mean sorry, adding to that value. Let’s say, you’re parsing a list, you have to parse one item at a time. Add it to the list. You’re maintaining the entire state of the parser in one value, one single value.

Instead of ad hoc, passing these things around as arguments and sometimes you need one and sometimes you need the other, you just always bundle them together. It just makes for a much cleaner interface to everything. I would like to give one more example. This is the example that John Hughes gave.

He was talking about a system that someone came up with to draw graphics. This was quite an old example. The example was that it was a system where an image was represented as a function. The arguments to that function where the axes on which is supposed to draw that picture.

You skew it to fit in the axis. You could have it whether orthogonal, the two axes and wherever the point is where they meet. That’s the bottom left corner. Then, if you were to…sorry, you’re backwards to what I’m seeing. Is you were to skew them like this or move it, it will move the image to another spot and will squish it.

That’s interesting, but really what it’s saying is that that function was complete as a whole value. It could be drawn anywhere on the screen, contained everything it needed to draw. The thing that was variable, where the arguments like, where it’s going to be drawn or what the axes look like.

It was a complete unit. It did nothing. It could be completely opaque because its interface was very clear. It could be composed in very known ways. That’s the example that he gave. I think that’s another interesting example.

This idea of the whole value. Instead of having an image that was a ray of pixels, and then an algorithm, like a function or something else. I guess a function that would take the image and the two axes, make a new image that would skew it. Then take this skewed image. You could then draw that to the screen.

It was done in a much more elegant way that allowed for interesting patterns because you could pass in the axes to a function and it would change the axes, pass them to the image, made it recursively do it so you had this fractal effect.

It’s much more interesting to do cool stuff with. It’s much easier to do that functional recursive stuff when you’re dealing with it at that level.

I don’t know about how beautiful these images were by the way. I do find that that kind of thing helps where you have the whole value. I don’t know about any other examples, but I’m going to try to define it now.

The real essence of it is that you take two or more values, usually it’s a small number of things, and you put them into a composite value. That could be a tuple or you could define a new type.

Eric Normand profile image
Eric Normand
@ericnormand
twitter logo

The real essence of whole values is that you take two or more values, usually it's a small number of things, and you put them into a composite value. That could be a tuple or you could define a new type.

ed.gr/w6pt

Sun Nov 04 16:01:45 +0000 2018
Twitter reply actionTwitter retweet action1Twitter like action2

You put them into this composite value and the composite value represents a semantic whole that you can then define new operations on top of. This is very much like…When I say it like this, it just sounds so much like object-oriented programming where you are grouping state together and putting an interface on it.

That’s not what I see most people doing with object-oriented programming. Usually what they’re doing is…They’re not thinking in terms of the relationships between the data and how to make operations to maintain those relationships.

They’re thinking more like, “What’s all the data we can put in here? Let’s group it together and call it a person or let’s group it together and call it an inventory manager.” I don’t know what they would call it.

Then one of those operations that we need to do on it. We need to read it. We need to write it. We need…They’re not doing this much more relationship based analysis.

Here’s the tip. If you’re doing object-oriented programming, you should look into doing it like this where you’re thinking about…Instead of doing this for-loop and maintaining two different variables, those two variables should be bundled together.

Does it make sense to bundle them together? Once you’ve bundled them together, it could be that the operations…This make it functionally again. The operations on them have interesting properties.

If they’re associative, that means you can do much more free recursion on them. If they are commutative, it means you can distribute your algorithm, not worry about what order things come back in. You’re going to want to bundle those values together anyway.

Maybe if it’s associative, you can find an identity value, you’ve got a monoid. There’s things that you can do with them once they’re bundled together. You can start to analyze the properties of those operations that maintain the relationship.

It’s actually another principle he talks about. He talks about combining forms, it’s what he calls them. Call them operations, but he’s talking about you take two of these whole values and you combine them in some way.

If it’s an average, you’re taking the two averages, you add them up, you have another average. Take two of these images that take the same skewed axes and you can overlay them or you can put them side-by-side or something like that.

It’s a combining form. I’m about to get on the greenway here, a lot of bikes. It’s like a highway for bikes. I’m trying to define this. Trying to define this, this idea of whole values.

Before I define it, I did want to talk a little bit about this talk I saw by Fred George. Fred George is a…I guess he’s a product manager now or project manager, something like that. He’s an old timer, very experienced programmer.

I started getting into him because he talked about what his management style, which is called Developer Anarchy, or something like that. The idea is just give the programmers some KPI, some goals to hit and let them hit it.

Let them go and figure out ways to increase those metrics and don’t give them user stories and stuff like that. Let them come up with them on their own. It required a whole architecture, like a microservices architecture so that they could work independently without breaking the entire system.

He also had another talk called The Secrets of Agile Programming or something like that. Secret Practices of Agile Programming. It was trying to say that when a lot of the agile practices were invented, a lot of them came from extreme programming.

It was assuming that you were programming, basically, like can’t back. Do all these practices, do pair programming. Do continuous deployment. Do test-driven development. All these things that we think of as agile style things modern software development practices.

They also assume that your programming style, your coding style, was in a certain way, so we’ve described the few of these things. One of them, one of the things they said, was your classes should have two or at most three fields.

The audience was like, “What? That’s not possible.” And he’s like, “Go, analyze your classes and the fields that they have. I’ll bet that you’ll see that some of those fields have a stronger relationship to each other than they do to the others.”

If you have a person class, you’ll see that, “Hey, this street name goes together with the zip code much more than it goes together with their salary. Maybe, those should start to be group together to represent that relationship.”

That the whole point of this is to start representing the semantic information in ways that your programming language supports. If you’re just throwing them together like a big bag, you’re not going to be able to move this fast to program as quickly. You just going to have this big bag objects that just do everything.

The secret is to break them out into smaller objects that have much more coherent between the fields. I think that’s very much related to this functional programming idea of whole values. Don’t have a bunch of values that have a relationship and that they’re split apart.

Like they’re split into even something as simple as the two arguments to a function. Put them together. You’ll notice that composite might have certain properties.

There’s also the idea in a whole value that you could have partial solutions to problems. Instead of saying, “Well, we either have the solution or we don’t,” you might have a partial solution.

Eric Normand profile image
Eric Normand
@ericnormand
twitter logo

There's also the idea in a whole value that you could have partial solutions to problems. Instead of saying, "Well, we either have the solution or we don't," you might have a partial solution.

ed.gr/w6pw

Wed Aug 01 19:00:23 +0000 2018
Twitter reply actionTwitter retweet action0Twitter like action0

It’s like this parser example that I gave where you have some value, and then the rest of the problem is being stored or is part of the answer. I parsed four characters for you, here’s the number that that represents, and here’s the rest of the stream.

This is all the characters that were part of that number. You put them together, and it makes sense together.

I’m going long now. I just want to say thanks for listening. It really helps me to get my ideas out, walking and talking, and sharing them with people. I love it that you…

The post What does it mean for programs to be built using “whole values”? appeared first on LispCast.

16 Jul 22:26

Stuff that works :: Befristete Prime Day Angebote

by Volker Weber

Die Liste wird noch länger werden:

More >

16 Jul 16:47

Twitter officially adds a bottom navigation bar to Android app

by Jonathan Lamont
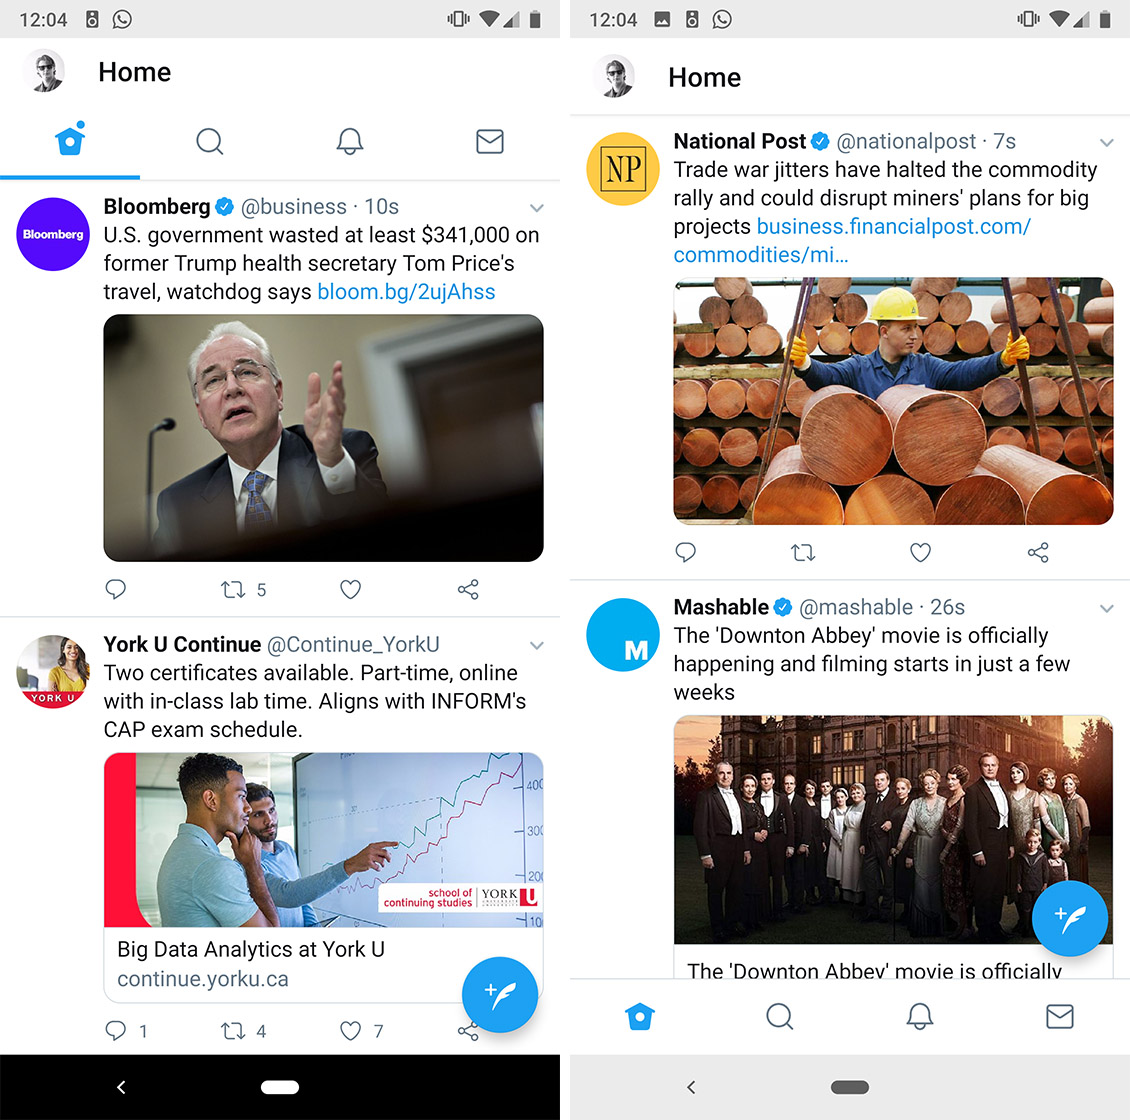
Twitter's bottom navigation bar on a Pixel 2 XL

Twitter announced Friday that it was rolling out a new bottom navigation bar for Android users.

While a small change overall, it’s a welcome one. The bottom navigation bar essentially takes the four tabs that ran across the top of the app and placed them along the bottom.

The tabs — Home, Search, Notifications and Messages — are easy to reach now. In our world of constantly growing phones, this makes a lot more sense.

The change appears to be part of a server side update. It came to my device without an update from the Play Store.

However, some users may be able to force the change by quitting Twitter and restarting the app. I had ‘Force Stopped’ Twitter and discovered the change when I reopened the app. However it’s not clear if it’s related, so your mileage may vary.

Screenshots of Twitter's bottom navigation bar

Despite the nice usability change, few users seem to care. Twitter posted the announcement on Twitter and users flocked to the response with complaints.

On Wednesday the social media network purged locked accounts from users’ follower counts. The move was an act of balancing akin to Thanos’ snap despite Twitter’s good intentions.

While Twitter said most average accounts would only see a drop of four or less followers, some of the bigger accounts lost followers by the thousands.

President Trump lost some 300,000 followers for example, according to the Independent.

Twitter’s CEO Jack Dorsey also lost 200,000 followers during the purge.

Unsurprisingly, many users are quite frustrated at the loss. However, for the health of Twitter it was a necessary evil.

Source: Twitter Via: Android Police

The post Twitter officially adds a bottom navigation bar to Android app appeared first on MobileSyrup.

16 Jul 16:47

Koodo offering existing subscribers $15/3GB bring-your-own-tablet plan

by Sameer Chhabra
koodo mobile

Telus flanker brand Koodo has added a new plan that offers 3GB of tablet data for $15 per month to existing subscribers who bring their own tablets to the carrier.

While the plan costs $15 per month, there is an additional one-time $30 connection fee which includes the cost of a SIM card.

The bring-your-own-tablet offer is currently only available in-store, and is also only available to existing Koodo subscribers who have a mobile phone plan.

How Koodo compares

Canada’s big three carrier all offer tablet plans at various data and pricing structures, but Koodo’s primary tablet data competitors are Fido — the mid-tier Rogers flanker — and Freedom Mobile.

Fido sells a $15 tablet plan that provides users with 3GB of data and is available for BYOD Fido postpaid customers, while Freedom Mobile offers a $15 plan that provides users with 4GB of data. A Freedom representative confirmed to MobileSyrup that customers can bring their own tablet to use the plan.

Bell flanker brand Virgin Mobile doesn’t advertise a BYOD tablet plan and a sales representative confirmed to MobileSyrup that they were not able to offer a BYOD tablet line.

MobileSyrup has reached out to Virgin Mobile’s communications team for confirmation.

It’s important to note that Virgin Mobile, does, however, offer a limited-time $20 per month 3GB plan on a two-year contract and a $15/100MB monthly data plan.

Source: Koodo Via: RedFlagDeals

The post Koodo offering existing subscribers $15/3GB bring-your-own-tablet plan appeared first on MobileSyrup.

16 Jul 16:47

SkipTheDishes delivering free ice cream cones in Toronto this weekend

by Bradly Shankar
SkipTheDishes ice cream truck

This Sunday, July 15th is National Ice Cream Day, and to celebrate, SkipTheDishes will deliver 20,000 free ice cream cones to Toronto this weekend.

To take advantage of the offer, Torontonians can stop by the brand-new SkipTheDishes ice cream truck at the Harbourfront Centre on both Saturday and Sunday from 12pm to 9pm.

The truck, which will be parked in front of the power plant building, will be serving the free ice cream to visitors of all ages, while supplies last.

The Toronto Harbourfront Centre is located at 235 Queens Quay West. More information on the venue can be found here.

SkipTheDishes regularly delivers to over 100 cities in Canada through the web or a free Android and iOS app.

The post SkipTheDishes delivering free ice cream cones in Toronto this weekend appeared first on MobileSyrup.

16 Jul 16:47

Google Chrome’s new Meltdown and Spectre safeguard is a memory hog

by Rose Behar
Google Chrome

Chome has added new protections against the Meltdown and Spectre exploits that target hardware vulnerabilities in modern processors — but the new version of the browser uses a lot more memory.

In a nutshell, Meltdown and Spectre are exploits that allow for malicious programs to steal data that is being processed on the computer by other legitimate programs.

Chrome has introduced a new ‘Site Isolation’ security feature that acts as a second line of defense for attacks where one website tries to access another’s data inside the browser.

It makes sure that pages from different websites are always put into different processes (i.e. instances of computer programs being executed), each running in isolation with limited allowances.

However, additional processes means more Chrome uses more RAM. Google cites that as one of the major known issues with this new, more secure architecture in a security blog post.

The Mountain View-based tech giant writes that overall memory use in Chrome is higher by 10 to 13 percent when isolating all sites with many tabs open.

Still, if you consider that this is keeping you safe from scams that could snag sensitive information from your password keeper, email account or any of the rest of your daily web apps — it’s a fair trade-off for most.

If you’re a Chrome user who has 4GB of RAM or less on your device, though, you may see a noticeable performance reduction when it comes to the amount of tabs you can open.

The new safeguards are enabled by default in Chrome 67 on Windows, Mac, Linux and Chrome OS, and are coming to Android with Chrome 68.

Source: Google Via: Mashable

The post Google Chrome’s new Meltdown and Spectre safeguard is a memory hog appeared first on MobileSyrup.

16 Jul 16:45

Amazon Canada teases Prime Day discounts

by Ian Hardy
Amazon Echo 2nd Gen

Amazon’s massive Prime Day sale, which is reserved only for Prime members, starts today at 3:00pm EST.

While many of the deals are not known, Amazon Canada has teased a few products that will see deep discounts. Here is a quick roundup of what you can expect to see:

Amazon Devices

  • Save $40 on Echo
  • Save up to 35% on Echo and TP-Link smart plug bundles
  • Save up to 35% on Echo and Sengled smart light bulb bundles
  • Save $40 on Echo Spot
  • Save up to 30% on Echo Spot and TP-Link smart plug bundles
  • Save up to 35% on Echo Spot and Ring video doorbell bundles
  • Save $65 on Echo Plus
  • Save $35 on Echo Dot
  • Save up to 40% on Echo Dot and TP-Link smart plug bundles
  • Save up to 40% on Echo Dot and Sengled smart light bulbs bundles
  • Save up to 40% on Echo Dot and Philips Hue bundles
  • Save $20 on the Fire TV Stick Basic Edition
  • Save $20 on the Fire 7
  • Save $30 on the Fire HD 8
  • Save $40 on the Kindle Paperwhite

Amazon Brands

  • Spend $35, save 30% on select everyday essentials
  • Save up to 30% on AmazonBasics and Pinzon
  • Save up to 27% on AmazonBasics office chairs
  • Save up to 50% on select fashion for the family

Fashion

  • Save up to 50% on select diamond jewelry
  • Save up to 60% on best sellers from top watch brands
  • Save up to 50% on select Ray-Ban sunglasses
  • Save up to 50% on select jeans for men, women, and kids
  • Save up to 50% on select men’s and women’s fashion shoes and accessories
  • Save up to 50% on select athleisure shoes and clothing

Electronics

  • Premium Brand 65-inch 4K Smart TV, only $1,898
  • Premium Brand 49-Inch 4K Smart TV, only $849.99
  • Save up to 40% on select PC monitors
  • Save up to 50% on select Bose headphones and speakers
  • Hisense 43-inch Smart TV, only $329.99
  • Save up to 40% on select PC gaming hardware and accessories
  • Save up to 40% on Sennheiser headphones
  • Save up to 45% on SanDisk memory products
  • GoPro Hero Session Bundle, only $239.99
  • Save up to 25% on select laptops and Chromebooks
  • Save up to 30% on Samsung tablets, wearables, phone bundles and more
  • HP Sprocket Portable Blue Photo Printer, only $119.99
  • Save up to 50% on Sony wireless headphones

Video Games

  • Save on an Xbox One S with Rare Replay
  • Save on the Nintendo Switch value bundle

Kitchen & Home

  • Save up to 38% on select Instant Pot pressure cookers
  • Save up to 30% on select Vitamix blenders
  • Save up to 30% on Hill’s pet food and treats
  • Save up to 30% and more on select indoor and outdoor furniture
  • Save up to 30% on select air conditioners, dehumidifiers and air purifiers
  • Save up to 34% on select Rowenta garment care products
  • Save on select Dewalt and Makita power tools

Toys & Games

  • Save up to 40% on select Beyblade, Play-Doh, and other toys and games
  • Save up to 30% on toys and baby gear from Fisher-Price
  • Save up to 30% on select STEM toys
  • Save on What Do You Meme? Adult Party Game

Sports & Outdoors

  • Save up to 30% on Ten Toes paddle boards
  • Save up to 35% on select Under Armour gear
  • Save on the LifeStraw Personal Water Filter
  • Save up to 30% on select Marmot equipment and apparel
  • Save up to 30% on Joola table tennis tables

Miscellaneous

  • Save $70 on AncestryDNA, the No. 1 selling DNA test
  • Save up to 70% on Samsonite 2-Piece spinner sets
  • Harry Potter collections starting at $44.99

Source: Amazon Canada

The post Amazon Canada teases Prime Day discounts appeared first on MobileSyrup.

13 Jul 05:46

Why do political science and policy sciences shun homelesness as a research focus?

by Raul Pacheco-Vega

homeless tentDespite the fact that I study comparative public policy using environmental issues as the core focus of my work, I’ve always been interested in tackling policy issues facing vulnerable populations, regardless of whether they’re associated with environmental issues.

After all, I study commmunities facing water insecurity, toilet insecurity, informal waste pickers. All of these groups are highly vulnerable. I even have an in-press coauthored journal article with Dr. Kate Parizeau (University of Guelph) on the ethics of ethnography within marginalized communities.

This is a topic near and dear to my heart. It doesn’t need to be an environmental issue. Individuals facing homelessness, elderly folks are both communities at the margins.

The policy solution space for issues these populations face is quite important and also very understudied. So even if neither of these policy areas are environmentally-focused, I’m very strongly interested in older persons policy and homelessness policy, and I look forward to doing some research on both of these topics (either with coauthors or students of mine).

homeless tent

Part of a tent city in downtown Vancouver (British Columbia, Canada)
Because of my work on the right to sanitation and publicness, I’ve had to examine policy issues that affect homeless populations (or, as they call them in the British literature, “rough sleepers”). One of the first things I had to learn is that homelessness is a temporary and temporal property. This means, individuals may enter and exit homelessness. It’s not a permanent state, but individuals may experience homelessness, rather than “be homeless”.

As a political scientist who also publishes in policy sciences journals, I’m flabbergasted that neither discipline (political science nor policy sciences) have really had homelessness as a major research focus. This, to me, is one of the greatest failures of the discipline. I know the topic isn’t as sexy as elections, or international development, or political behaviour, but…

I argued that we had an excess of electoral studies’ political scientists (which didn’t earn me accolades, I must say), not because I don’t think elections aren’t important (they are), but because so much journal space has been taken up by electoral studies, whereas there is NOT A SINGLE JOURNAL ARTICLE in the three major journals for political science (American Journal of Political Science, American Political Science Review and Journal of Politics) focused on homelessness. This, to me, is atrocious. A few fellow political scientists helped me find some political science-related work, but it’s really minimal compared to the magnitude and importance of this policy area.

My plea is not for electoral studies’ scholars to stop doing that kind of work, but for political scientists and policy sciences’ researchers to focus on an under-studied area. One that sociology, anthropology, social work and geography have done extensive work on, but that remains under-researched within our discipline.

13 Jul 05:43

Teaching R to New Users - From tapply to the Tidyverse

Abstract

The intentional ambiguity of the R language, inherited from the S language, is one of its defining features. Is it an interactive system for data analysis or is it a sophisticated programming language for software developers? The ability of R to cater to users who do not see themselves as programmers, but then allow them to slide gradually into programming, is an enduring quality of the language and is what has allowed it to gain significance over time. As the R community has grown in size and diversity, R’s ability to match the needs of the community has similarly grown. However, this growth has raised interesting questions about R’s value proposition today and how new users to R should be introduced to the system.

NOTE: A video of this keynote address is now available on YouTube if you would prefer to watch it instead.

Introduction

If we go to the R web site in order to discover what R is all about, the first sentence we see is

R is a free software environment for statistical computing and graphics.

I haven’t been to the R web site in quite some time, but it struck me that the word “data” does not appear in that first sentence.

If we similarly travel to the tidyverse web site, we find that

The tidyverse is an opinionated collection of R packages designed for data science

It turns out that these two sentences, found on these two web sites. say a lot about the past, present, and future of R.

Intentional ambiguity

R inherits many features from the original S language developed at Bell Labs and subsequently sold as S-PLUS by Insightful (and now owned by Tibco). So it’s useful look back into some of the S history to gain some insight into R. John Chambers, one of the creators of the S language, said in the “Stages in the Evolution of S” (sadly no longer available online except via the Internet Archive):

The ambiguity [of the S language] is real and goes to a key objective: we wanted users to be able to begin in an interactive environment, where they did not consciously think of themselves as programming. Then as their needs became clearer and their sophistication increased, they should be able to slide gradually into programming, when the language and system aspects would become more important.

Chambers was referring to the difficulty in naming and characterizing the S system. Is it a programming language? An environment? A statistical package? Eventually, it seems they settled on “quantitative programming environment”, or in other words, “it’s all the things.” Ironically, for a statistical environment, the first two versions did not contain much in the way of specific statistical capabilities. In addition to a more full-featured statistical modeling system, versions 3 and 4 of the language added the class/methods system for programming (outlined in Chambers’ Programming with Data).

In discussing the rationale for developing the S system, Chambers writes

We were looking for a system to support the research and the substantial data analysis projects in the statistics research group at Bell Labs.

He further writes

…little or none of our analysis was standard, so flexibility and the ability to program were essential from the start.

From the beginning flexibility and the ability to program were two key needs that had to be satisfied by the S language.

R Enters the Fray

It was into this world that R came to be. As a dialect of the S language, R proved easy to adopt for previous users of S-PLUS. The fact that R was also free software didn’t hurt adoption either. But it’s worth noting that for the most part, people already had tools for analyzing data. They came in the form of SAS, Stata, SPSS, Minitab, Microsoft Excel, and my personal favorite, XLisp-Stat (thanks Luke Tierney!). But the commonly used data analysis packages had some key downsides:

  1. The graphics were too “quick and dirty” and did not allow much control over the details; they plotted the data, but that was about it;
  2. There was relatively little ability to build custom tools on top of what was available (although some capability was added to most packages later).

R solved these two key problems by providing an “environment for statistical computing and graphics”. Like with S, R provided flexibility and the ability to program whatever one needed. The graphical model was similar to the S-PLUS system, whereby total control was given to the user and data graphics could be built up piece by piece. In other words, few decisions were made by the system when creating data graphics. The user was free to make all the decisions.

With the non-graphics aspects of the R system, the user was similarly free to handle data however the language would allow. This feature was well-suited to the academic audience that initially adopted R for implementing new statistical methodology. Furthermore, those who already knew programming languages like C (or Lisp!) found R’s programming model very familiar and easily extended. R’s package system allowed developers to extend the existing functionality by adding new kinds of models, plots, and tools.

R for Data Analysis?

Going back to Chambers’ philosophy of S and the “user-developer” spectrum, it’s interesting to think about how R fit into this spectrum, given the population of users that were drawn to it.

User-developer spectrum

While Chambers thought of S as covering the entire spectrum at the time, it seems clear in retrospect that R actually fell quite squarely on the “developer” end of the spectrum. That is, the features that made R stand apart, given the context in which R was initially released, were really developer features. The programming language and the ability to take fine control over all the details are things that would appeal to people who are developing new things.

What this meant is that initially, R was not a great system for doing data analysis. The truth is it was harder to do data analysis in R than it was in most other systems. Programs like SAS, Stata, and SPSS had been designed as interactive data analysis environments and had simple ways to do complex data wrangling.

Imagine a new user to R who’s interested in doing data analysis. Consider the basic task of splitting a data frame according to the levels of some grouping (factor) variable and then taking the mean of another variable within the groups. Today, you might do something like

library(dplyr)
group_by(airquality, Month) %>% 
	summarize(o3 = mean(Ozone, na.rm = TRUE))

This code uses the dplyr package from the tidyverse set of packages to take the monthly mean of ozone in the airquality dataset in R. To understand it, you need to understand the concept of a data frame and of tidy data. But beyond that, the code is reasonably self-explanatory.

Using just the functionality that came with the base R system, you’d have to do something like

aggregate(airquality[, “Ozone”], 
          list(Month = airquality[, “Month”]), 
          mean, na.rm = TRUE)

Right away, questions arise:

  1. What are the square brackets [ for? They are used for subsetting a data frame.
  2. What is list()? It’s a type of R object.
  3. Why is the mean() function just sitting there all by itself? It is being passed to the subsets of the data frame via a kind of internal lapply(). (Follow up: What is lapply()?)
  4. Is na.rm = TRUE an argument to aggregate()? No, it is an argument to mean(), but it is being passed to mean() via the ... argument of aggregate().

In other words, in order to take the mean within groups of a variable in a data frame, a pretty basic data summary operation for almost all other packages, you had to explain

  1. different kinds of R objects;
  2. subset operators;
  3. functional mapping;
  4. and variable argument lists.

At this point, you were basically describing R as a programming language to people who likely had no interest in programming (at least not yet).

As confusing (and possibly ridiculous) as this list of requirements might sound, it often was not a barrier to people back in the year 2000. The reason is that people who were new to R had not chosen to learn R because they needed a system for doing data analysis. They already had a system for doing data analysis. Rather, they were looking for a system to do the things their current system didn’t allow them to do. In other words, they were looking for a system that had “flexibility and the ability to program.” R was a great system for that.

Making R a “Real Programming Language” Almost Killed It

As is so often the case with technological products, the aspects of those products that are considered its advantages can quickly become their key weaknesses. R’s flexibility and focus on programming language power served as a major barrier to those who simply wanted to analyze data. However, like with many classic case studies of disruption, this barrier was not immediately recognized as such. The result was continuing efforts to make R a better programming language.

One of the major developments of the 2000s was the development of the S4 class/methods system. In many ways, the S4 system was a major advance, because it provided a “real” system for doing object oriented programming in R. The system was formal, unlike the ad hoc S3 system which contained within it many ambiguities. Other features added to R during this time (to name a few) were the namespace system for packages and the localization/internationalization features. All of these features made up for key deficiencies in the system and provided powerful new tools for developers to create more sophisticated R packages. They brought R closer to a “real” programming languages that could be discussed in the same breath as python or perl. While these features benefited users (particularly the localization and internationalization efforts), none of them directly empowered non-programming users to do more with R. They were primarily developer-focused.

At this point in R’s development the user who simply wanted to analyze some data was being “over-served”. They did not need a formal system for object-oriented programming and did not need a mechanism to allow others to provide translations for their R packages. They just wanted to take the mean of a bunch of columns within groups in a data frame. We still had no simple solution for that problem. This state of affairs left a substantial gap to be filled for simple R-based data analytic tools.

Tidyverse Disruption with a Twist

When tidyverse-related tools, including ggplot2, first started showing up (long before the name “tidyverse” existed), long-time users of R did not see why they were needed. It was difficult for many of us to see the perspective of the new user who had basic data analytic needs. These new users

  1. were not familiar with a collection of existing data analysis packages;
  2. had not used S-PLUS previously;
  3. did not necessarily have experience with other programming languages like C or Perl;
  4. were likely encountering data analysis and statistics for the first time

The people with this set of characteristics represented a new and fast-growing population of potential R users. Many were being turned away from R because of

  1. flexibility –> complexity; and
  2. ability to program –> requirement for programming

Suddenly, the flexibility and ability to program so valued by a previous population of R users were lead weights dragging the system down for new users. A different interface was needed.

The tidyverse set of tools, in addition to providing that different interface for new users, adopted a particular point of view on how the various tools would work together. The focus on “tidy data” as a unifying principle allowed a relatively small set of tools to provide a wide range of operations when it came to data wrangling. The opinionated nature of the tools naturally limited somewhat the flexibility of how things could be done. But this reduced complexity was what made the tools so appealing to new users. There were just fewer things to learn. The use of non-standard evaluation was (perhaps ironically) more intuitive for data wrangling tasks because there was no need to quote variable names and see everything from the perspective of a developer or programmer.

Furthermore, the tidyverse did not abandon all that had come before it. Rather, it built on top of the infrastructure that had been built previously:

  1. The tidyverse tools are built as R packages, eliminating the need to make direct changes to the core R system (and to get permission to do so);
  2. Although the packages eschew the formal S4 class/methods system, they make extensive use of the S3 class/method system, which when coupled with the namespace mechanism for R packages are a powerful alternative.

In addition to all this, the ggplot2 package exploded in popularity, largely because it provided an easy way to make good graphics quickly (one might dare say “quick and dirty”). It “shortened the distance between the mind and the page” and removed the need for R users to learn intricate plot arguments and incantations. Rather than carefully building plots piece by piece as with the base R system, most of the defaults for ggplot2 were good enough and the beginner did not have to make a lot of decisions. Between ggplot2 and the initial tidyverse tools, R users finally had a system for doing data analysis in the manner of packages that came before it. However, that functionality was not simply replicated; it greatly improved upon it, as is evidenced by the popularity of both ggplot2 and the tidyverse.

With traditional technological disruption, the members of the old class are left behind. But far from wiping the slate clean, as perhaps might have occurred with other software packages, the tidyverse provided functionality that all R users could choose to take advantage of or not. People with long-standing workflows could keep their workflows. The tidyverse essentially built a new “language” on top of the existing language without breaking anything fundamental for existing users. Ultimately, the tidyverse was able to disrupt the existing R system without needing to leave previous users behind. Everyone could come along for the ride and benefit.

Intentional Ambiguity Redux

With the tidyverse “interface” to the R language, along with its existing programming paradigm dating back to the system’s origin, we could argue that R has achieved Chambers’ original vision of “intentional ambiguity”. For some users, R is a flexible system allowing the ability to program and develop new things. For other users, R is a powerful data analysis system that contains tools for data wrangling, visualization, and statistical modeling. The system spans the entire “user-developer” spectrum without anyone having to make a hard choice between either end. Rather, R users are free to wander back and forth between the two ends.

But nothing ever stands still, and users of the tidyverse system will need a system for programming too. However, they will not want to program in the style of the original R system. This would be like asking a user of laptop computers to go back to using a desktop computer. No, they want more power in their laptop.

One thing to be wary of going forward is that one of the tidyverse’s greatest assets–the generous use of non-standard evaluation–could end up being a critical liability. While non-standard evaluation greatly simplifies interactive work in R, programming in a world with non-standard evaluation can be confusing, especially when one must simultaneously deal with other tools that make use of standard evaluation. Tools and infrastructure are needed to allow users to become developers in this new paradigm without too much pain. Thankfully, many are working on this and I have little doubt that a new programming environment will exist in the near future that allows for the easy development of “tidyverse tools” by a large segment of the R community.

Selling R

At this point, one might have some difficulty describing the value proposition of R to someone who had never seen it before. Is it an interactive system for data analysis or is it a sophisticated programming language for software developers? Or is system for developing reproducible workflows in data analysis? Or is it a platform for developing interactive graphics, dashboards, and web apps? Or is it a language for doing complex data wrangling and data management? Or…

The confusion over how to “sell R” is reflective of the increasingly diverse audience of people using R. The open source nature of R gives it quick entry into many different fields, as long as there are interested users intent on adapting R to their needs. Over time we have seen R enter many scientific communities, including ecology, astronomy, high throughput biology, neuroimaging, and many others. Outside academia, we have seen R adopted in journalism, tech companies, and various businesses for data analysis. The spread of R is in part because members of those communities saw something attractive about R that could be applied in their field. Yes, free and open source is a big win, but not every organization is short of cash and there are other systems (like Python, or even XLisp-Stat) that share those same properties. So there must be other reasons to adopt R.

In the distant past, my pitch for using R usually involved three things:

  • Free. R was both free as in cost and free as in free software. The free cost part made it a highly accessible package and the free software part allowed for anyone to tinker with the package, inspect its code, and make improvements. This was particularly important in the old days when R was unknown and it’s “accuracy” was put in question.

  • Graphics. R was able to produce high quality “publication ready” graphics and it gave you detailed control over all the graphical elements. S-PLUS could also do this but S-PLUS didn’t come with the free part mentioned above.

  • Programming language. Unlike packages like SAS, Stata, or SPSS, R came with a robust and sophisticated Lisp-like programming language that was well-suited for data analysis applications. In addition, you could use it to build packages that could extend the core R system. Furthermore, it was a language designed for doing data analysis. That made it appear weird to people familiar with traditional programming languages.

Much has changed since those early days and I’ve varied my pitch quite a bit to focus on a few different things that didn’t exist back then. In particular, the audience has changed. I talk to many more people who are just getting started in data analysis and therefore are a bit more open-minded about which software to use. They don’t have years of SAS baked into their brains. They may have heard of Python as an alternate system, but they are much more likely to be open-minded about what system to use.

Some of the things I focus on now are

  • Reproducibility, Reporting, and Automation. With the development of knitr and its combination with R Markdown, the writing of reproducible reports was made infinitely easier. (Markdown itself, probably deserves its own discussion, but it’s not specifically R-related.)

  • Graphics. R still has the ability to make great data graphics and with the introduction of ggplot2, it has become easier to make and extend good graphics.

  • R Packages and Community. With over 10,000 packages on CRAN alone, there’s pretty much a package to do anything. More importantly, the people contributing those packages and the greater R community have expanded tremendously over time, bringing in new users and pushing R to be useful in more applications. Every year now there are probably hundreds if not thousands of meetups, conferences, seminars, tutorials, and workshops all around the world, all related to R.

  • RStudio. The development of the RStudio IDE has made getting started with R much easier. Having a powerful IDE was important to me for learning other languages and I’m glad R finally has something solid for itself. RStudio has significantly simplified the development of R packages via devtools and roxygen2. While it’s not yet perfect, these tools have changed what used to be a labor-intensive and finicky process into a more manageable and easier to learn work flow. In addition, RStudio has funded the development of many critical R packages, including the members of the tidyverse.

At a recent unconference held in Melbourne, a number of people had different approaches to convincing others to use R. Here is just a summary:

  • Someone mentioned Bioconductor, which is a huge resource for those doing research in the world of high throughput biology. Not many other analysis packages have something similar so it makes an obvious selling point to people working in this area.

  • The idea of using R end-to-end came up, meaning using R to clean up messy data and taking it all the way to some interactive Shiny app on the other end. The idea that you can use the same tool to do all the things in between made for a compelling case for using R.

  • For the spreadsheet audience, the dplyr package specifically was sometimes a good selling point. The idea here was that you could show people how much time could be saved by automating analyses and using dplyr to clean up data.

  • The open source nature of R came up a few times, primarily as a means for developing transferable skills. If you work at a company/institution that specializes in some proprietary package, it’s often difficult to transfer those skills somewhere else if your new job doesn’t use that package. The fact that R is open source means that, in theory, you could use it anywhere and the skills that you build up in R are (again, in theory) applicable everywhere.

  • Someone mentioned that if you want to convince someone to learn/use R, just show them the multitude of jobs available to R programmers (and in particular, the salaries attached to them).

  • The fact that R is obtainable for free is still important, given that Matlab and SAS licenses have not gotten any cheaper over time. In my experience, this is particularly important in non-industrialized countries where for many people paying for expensive licenses is not an option.

The reasons for using R are as varied as the people using R, and that’s a great thing. Moving forward, we must resist the urge to view R through a narrow window and to sell it as a single thing with a few features. The freedom given to the R community to characterize it the way they see best fit is what will give R increased relevance over time.

Conclusion

R has grown significantly over the past 20 years, but has only recently has developed all the elements of John Chambers’ original vision of a full-fledged data analysis system coupled with a sophisticated programming language. With the variety of tools that have been tacked on to the core system via packages, R’s chimera-like appearance can be a bit baffling to long-time users. But this appearance reflects R’s greatest feature, and it’s most valuable selling point, which is its ability to disrupt and reinvent itself to suit the needs of a new population of users.

It’s worth noting in closing that R is a language for data analysis. If R seems a bit confusing, disorganized, and perhaps incoherent at times, in some ways that’s because so is data analysis. The fact that we can have one language serve the infinite possible ways that people might approach any data analysis problem is pretty remarkable. But it does lead to a little bit of head scratching for people who are used to more “normal” programming languages.

As time goes on, R will be confronted with a new population of users who take different things for granted (e.g. the tidyverse) and will have very different requirements. When this happens, we must ensure that the things that make R great now do not become the very reasons for resisting change. That said, I believe we can be confident that the R language is flexible enough to meet the requirements for future new users.