Rolandt
Shared posts
Just refusal


Lakeshore Blvd during #ActiveTO
After much hemming and hawing from City Hall, the city finally decided to close some streets to both promote active transportation, and to reduce crowding for both pedestrians and cyclist along especially crowded routes. In particular, the Martin Goodman Trail has been very crowded on weekends, making social distancing rather difficult. In response to this issue, the city closed the east bound lanes of Lakeshore Blvd between Windermere and Stadium Rd. What a great enhancement of the Lakeshore, even if it is just for this long weekend.
Approaching Lakeshore from Ellis Ave.

Right away, we see a safety issue. There are northbound cyclists waiting to cross the westbound lanes that are not closed. Unfortunately, the newly installed bike crossing cannot be activated by cyclists waiting at the median.

Just as a side note, I’ve had issues with the new northbound bike crossing. The bike signal lights rely on a video sensor, and my success in being detected has only been about 50%.
What I think is going on is that the video camera’s view of cyclists (the blue arrow), is somewhat occluded by some wires that were hung up at the same time (red arrow).

I’ve had a little more success with the sensor if I stand right on this yellow dot.

If I stand closer to Lakeshore from this point, I don’t get detected. At any rate, I am disappointed that the city did not make the northbound bike crossing automatically triggered for every cycle since there is no car traffic making a left turn from Ellis to Lakeshore this weekend.
This issue aside, it was absolutely glorious to see bikes everywhere.


We were on the tandem.

Headed home.

For those of you downtown near the lake, I hope you got a chance to check this out. If not, the forecast for Sunday morning is still clear of rain.
I hope that they keep at least one lane closed for bidirectional bike traffic after this weekend to reduce crowding on the MGT, but I’m not holding my breath.

AirPods Pro und AirPods reduziert

AirPods und AirPods Pro sind die meistverkauften Kopfhörer und die erfolgreichsten Apple-Produkte bisher. Amazon bietet die AirPods Pro aktuell um 60 (22 %) reduziert an. Bei den AirPods der zweiten Generation sind es minus 43 (24 %).

Für den harten sportlichen Einsatz empfehlen sich die Powerbeats Pro mit 50 Rabatt. Die haben die gleiche Software wie die AirPods und sitzen bombenfest im Ohr. Einziger Nachteil: Das Case ist deutlich größer.
Headsets fürs Homeoffice

Ob im Großraumbüro oder am Küchentisch: Wer in einer lebhaften Umgebung arbeitet, kann sich mit den richtigen Kopfhörern Ruhe verschaffen. Ich habe mir für Spiegel Online sechs Headsets angesehen, mit denen man gut von zu Hause aus arbeiten kann. Die beiden ersten sind besonders gut bei der Sprachübermittlung, aber weniger gut bei der Dämpfung von Umgebungsgeräuschen.
- Der alte Bekannte Poly Voyager Focus UC (ehemals Plantronics) überträgt auch unter widrigsten Umständen nichts außer der eigenen Stimme. Durch die Verarbeitung klingt sie ein wenig künstlich.
- Das flammneue Jabra Evolve2 65 ist eine sehr gute Alternative. Die Stimme klingt natürlicher, weil es weniger bearbeitet. Dafür rutschen mehr Raumgeräusche durch.
- Microsoft Surface Headphones hat die genialste Bedienung. Ich mag das Design sehr, aber das Headset ist wirklich riesig.
- Poly Voyager 8200 UC ist ebenfalls ein alter Bekannter und kann sich beim aktuellen Stand der Technik nicht mehr wirklich absetzen. Dafür hat es eine sehr wuchtige Basswiedergabe.
- Jabra Elite 85h ist das pfiffigste Modell aus diesem Feld. Sehr solide, ganz dicke Ohrpolster und ziemlich unauffällig, fast langweilig. Leider die schlechteste Sprachübermittlung.
- Das Bose NC 700 war eine dicke Überraschung. Es macht eigentlich alles besser als die andere Over-Ears. Einziger Nachteil ist die persönliche Registrierung mit übergriffiger Datenschutzvereinbarung.
Bose bleibt für mich die Messlatte für die Geräuschunterdrückung. Und anders als das alte QC 35 kann das NC 700 auch die eigene Stimme gut übermitteln.
Ich werde an diesem Thema dranbleiben. Große Hoffnung habe ich für das Jabra Evolve2 85, weil es einen ausklappbaren Mikrofonarm hat. Das ist die überlegene Technik für die Sprachaufzeichnung. Außerdem hat Microsoft gerade eine neue Version der Surface Headphones angekündigt, die ich mir ebenfalls anschauen werde.
Earlier this month I added ‘last edited’ to pag...
Earlier this month I added ‘last edited’ to pages in this site, as an expression of their wiki nature. Today I came across a phrase that expresses it even better, on the site of Maggie Appleton (where I ended up through a mention by Neil Mather)

“Last tended” is what she uses for her pages, and that fits much better with the concept of wiki as a digital garden to maintain, to tend to. So, I immediately copied that. Also rephrased the menu item from Kbase to Digital Garden, less pretending solidity, more suggestive of emergence and change.
The Lockdown diaries week 8: a bit of a mini break and some service design
Another week of lock down and the death toll in the UK is now over 33,600. Well, when I say another week of lock down, it has been here in Scotland (and Wales and Northern Ireland), but not in England where some restrictions have been lifted.
Last week I, along with millions of others watched the UK Prime Minister give what can only be described as confusing address to the nation. In his haste to give give some “good news” he seemed to forget that the measures he was describing only applied to England and not the rest of the “great nation” he claims to love so much.
The confusion, derision this statement caused compares so starkly with other countries such as New Zealand who not only have keep their death toll and infection rates low, but have also manage to provide clear, consistent messaging to their citizens and even more excitingly have allowed hairdressers to re-open. The clumsiness of the change of messaging to “stay alert” has exposed the rising challenges within our political system around the importance of people over profit. We all need to “get back to work” and stop enjoy this self enforced holiday!
This week I had a bit of a break, not quite a holiday, but I did enjoy a few email and twitter free days. At the start of this year I promised myself I would be better at taking “proper” holidays. When you work for yourself, there is a temptation to work as much as you can and never be too far from your email, just in case something pops up. I was a good decision and I feel much better for it. I even managed to get a bit of painting done. This is my reaction to the tracking app I wrote about 2 weeks ago. The beauty of the tulip representing the apparent beautiful ease and simplicity of using an app to track and trace people, without enough attention being applied to the wider implications of data gathering and civil liberties.

So my week of online conferences were pretty much all social. Apart from Friday morning when I joined the Service Design in Education webinar.
I have an awareness of service design from a quite a few years ago when I was at CETIS and we were staring to look at learning analytics. I wrote a couple of briefing papers with Jean Mutton (who at that point was working at the University of Derby) and her developing use of service design approaches. It was lovey to catch up with Jean again too on Friday.
There is now an emerging service design community across the education sector, and it was really interesting to get an overview of some of the work that is being done, Katie Murrie and the team at the Service Design Academy in Dundee and August college have been doing some really fabulous work across all education sectors through service design approaches. I need to find out more about the differences an similarities between service design and universal design at some point too. I think my natural instincts for educational/learning design is a mish-mash of both!
I have to say it was also a really well designed and delivered session which added to the overall high levels of engagement from all the delegates – design really does matter! It was the first time I have actually been in a zoom session using breakout rooms and that all worked well. I’m certainly going to keep an eye on developments in this community. You can find out more about the emerging community here.
During the week I became even more convinced that we need to be using the term physical distancing more than social distancing. I wrote about this a few weeks ago, but just now I think it’s really not getting through to people that the physical distance between us is really important. Wearing a mask doesn’t mean you can ignore that 2 meter guidance. But I know it’s hard.
Like everyone I miss people, I really do. So when I heard an interview with the wonderful Benjamin Zephaniah, this poem really resonated with what we are experiencing right now. So I’ll leave you with this version of it, dear reader. Until next week stay safe.
You Are Not Being Censored, You Just Can’t Demand Amplification
Conspiracy theorists, or those with fringe opinions all are ‘snowflakes’ at heart, judging by the consistent accusations of being censored they make. You are not being censored, you merely don’t have your expectations met. The expectation that platforms won’t care what you publish, as they will care if it hurts their bottom line in some form. The expectation that your opinions will be amplified in the outrage machine. You are not being censored. You may be denied the use of someone else’s channel and infrastructure, you may be told you’re not welcome on someone else’s turf. You can still say whatever you want, and put it online on your own dime. You can’t demand anyone else paying attention though, or have attention automagically arranged for you in the walled garden of your choosing.
It reminds me of a group of protesters in my hometown some years ago. For about two weeks they were on the front page of the local paper almost daily, with photos and all. Towards the end one of them tweeted “we’re not being heard”, and I answered “you’re heard plenty, it just doesn’t automatically mean people agree and do as you wish”. I’m probably still blocked. Which ironically is how they confirmed my point precisely. They heard me, but didn’t agree, so I got ‘censored’.
Lack of amplification and attenuation are not censorship.
What will happen to car traffic?
Traffic went effectively overnight to nothing at all. Didn’t expect that.
But what now? Will it return to previous levels – maybe even drop a little, given that so much else has changed, from working at home to not working at all.
Or will a significant percent of people, fearful of transit, take their cars and compete for the remaining space. Result: congestion city.
In this real-time experiment we now live in, we can watch from day to day to see what happens. For instance, here’s the Causeway on Friday, May 15 in the afternoon.
Better yet, check the video.
Then take a guess as to which way it’s going to go.
Focusing
Tomorrow’s the first day at my new job. Exciting!
Starting a new job has led me to look at my entire list of responsibilities — which is too long — and figure out what I need to drop so that I can pay enough attention to the projects that need it most.
My most important projects (outside of my job) are NetNewsWire and this blog. This blog, because, well, blogging is part of how I breathe. And NetNewsWire because I love the app — and it’s a real thing in the world now, with users, a team of developers, and great features coming up.
I wanted to do another half-dozen or so apps alongside NetNewsWire, starting with Rainier, but I’m dropping development on those so I can concentrate entirely on NetNewsWire. This is personally disappointing, but it’s honest: I just don’t have time for Rainier and these other apps. Work on these would take away from NetNewsWire, and that would be wrong.
Another move I’m making: Manton Reece has agreed to take over the repo and website for JSON Feed. I’ve been the bottleneck here with a 1.1 version, and I shouldn’t be. Manton will take care of this way better than I’ve been able to. (I hope to get everything transferred over to Manton in the next few weeks.)
Learning to plan
 I often find that I give myself pretty good advice as long as I remember to revisit what that advice was.
Two years ago I read Peter Morville’s Planning for Everything: The Design of Paths and Goals and managed to post a review here—Review: Planning for Everything: The Design of Paths and Goals.
My advice then was that this was a book worth rereading. It is and I just have.
There’s a separate discussion to be had about whether there are better strategies than rereading. I’ll save that for another day.
Morville observes that “while a plan may be defined as a series of steps, planning itself is nonlinear.” This is something that you come to understand over time, but is easily overlooked. You can forget it as an experienced planner because it is down at the level of muscle memory; it happens too fast to be noticeable. It can be harder to discern when you are learning how to plan.
We tend to focus on the artifacts of planning; project charters, statements of work, work plans, schedules, Gantt charts. We gloss over the complexities of developing those artifacts as our understanding of a problem evolves.
This is akin to when we are learning to write complex arguments. How many of us wrote the outlines to our papers after the fact? That’s because we didn’t recognize then that the struggle to find and impose order on our notes and research or the multiple iterations of our opening paragraphs were essential to the creative process. We were inclined to see them as accidental complexities that threatened to reveal our ineptness when, in fact, they were essential to the creative process.
Perhaps this simply reveals my naïveté, but for many years it never occurred to me that books weren’t written in the order that we read them. How did Orwell dream up “it was a bright cold day in April, and the clocks were striking thirteen,” out of thin air?
Our first encounters with plans are much like our first encounters with writing; we see the finished product neatly ordered and polished. The iterations, false starts, and multiple revisions don’t show up in the final product, but they are essential to getting there. Learning to plan, like learning to write, requires rolling around in the messiness. We need to acknowledge and accept that.
Becoming adept at planning is as much about attitude and expectations as it is about technique.
The post Learning to plan appeared first on McGee's Musings.
Slow and Muddled at 12th and Cambie
Sandy James and I were both struck by Daphne Bramham’s recent column in The Sun. She asked the question many have been wondering:


By the end of May, Seattle will have permanently banned cars from more than 30 kilometres of city streets, making permanent a temporary response to the COVID-19 pandemic’s imperative that people maintain physical distance.
In Vancouver? The city has closed a single street — Beach Avenue along English Bay — and parking lanes on 10 streets to allow space for people to wait to enter the few stores that are open. …
While other jurisdictions have acted boldly and swiftly, Vancouver council’s pandemic response has been slow and muddled.
It’s true, there’s not a lot of overt enthusiasm from Council on reallocating street space, even when it seems to be a win-win-win: good for local community, climate change, active transport and good health. Council is supportive of all that, of course; they’re just not rah-rah. Maybe it’s too Visiony, too associated with different politics and priorities. Urban design is not the Mayor’s forte.
 It’s not that Council has failed to articulate its ambition. With recognition of a climate emergency and the approval of Six Big Moves, Council committed to accelerating things we coincidentally need to do now to respond to the covid emergency. Here’s what they moved just one year ago:
That Council accelerate the existing sustainable transportation target by 10 years, so that by 2030, two thirds of trips in Vancouver will be by active transportation and transit …
The pandemic response seemed the obvious time to compress that 10-year commitment into a month. And it looked, briefly, that the City and Park Board were on their way. In what seemed like a weekend (but must have involved a lot of preliminary planning), Park Drive in Stanley Park and Beach Avenue were turned into flow ways with cones, signs and not much consultation.
But in the weeks that followed, except for a few queuing lanes in commercial zones … not much.
As Daphne noted, that required ignoring a lot of what was happening in the rest of the world.
All through March and April, city after city announced a slow or open street strategy of some kind. From Oakland to Milan, from Edmonton to Seattle, Vancouver was practically surrounded by ambitious plans and responses. Yet in that time, no enthusiastic embrace from the Mayor of Vancouver, even when the mayors of Toronto and New York, after initial tepid responses, came back with more ambitious agendas for immediate action. Not Vancouver.
 Little response emerged from City Hall until late April when, surprisingly*, NPA councillor Lisa Dominato came forward with a call for action – and a motion to instruct staff to do two big things:
- Expedite identifying and implementing reallocations of road space
- Come back in the fall 2020 with options for mobility and public realm use.
The motion made it on to the agenda on Tuesday, May 12, with a briefing before the final vote expected on Wednesday. CBC reported:
At Wednesday’s city council meeting, conducted via conference call, senior Vancouver staffers mapped out a vision for “short-term actions for long-term transformations” of city streets in response to the health crisis.
The coming weeks will see 50 kilometres of Vancouver roads designated as “slow streets” with traffic-calming measures to promote walking, rolling and cycling, while other side streets could be closed to car traffic altogether to make way for temporary plazas.
An easy vote, one would think – an opportunity for Council to reinforce the city’s leadership in sustainable transportation. Vancouver has been a world leader in what are now called complete, open or slow streets – from the traffic calming in the 1970s, to the greenways and bikeways of the 1990s, to the reallocation of street space on bridges and arterials in the 2000s. We had the experience, the staff and the political will – and here was a chance for the Mayor and Council to make their mark.
Instead, when the motion finally came up for debate, hours were taken up addressing the issue in the Downtown East Side, a neighbourhood that, despite complaints, gets a considerable amount of council and staff attention. Then more time taken to ensure layers of consultation. Then more process, more procedure. Add in misunderstandings among tired councillors, and hours later, council ran out of time and post-posted the whole thing for two weeks. That hissing sound was oxygen being sucked from the room.
In a supposed emergency, whether climate or covid, “slow and muddled” is not the impression you want to leave.
But it won’t be the last impression: in two weeks, councillors will have an opportunity to express their latent enthusiasm before the final vote. Maybe even the mayor.
I’ve been wondering for some time now why a left-of-centre dominated council and park board, with strong environmental credentials, are so slow and reluctant to take action. My guess is that they’re gun shy, given the controversies and bad blood over bike lanes downtown or in Kits Park – or wherever the status quo is being disturbed. Maybe some of them just don’t want to spend a lot of political capital on something associated with past councils and gentrification.
Not even in an emergency.
*Surprising, since the NPA had been dog-whistling an anti-bike lane agenda for the last three elections, and the NPA commissioners on the Park Board have ably assisted in keeping new bike infrastructure out of the parks.
Same day:
[contact-form]
ed.
Beneath The Surface
Nothing much to report on the creative front. Work has been exhausting, but it has also taken another unwelcome twist: As it gets progressively warmer, my Surface Pro 4 is collapsing slowly under the effect of near-constant video calls, and has already shut down on me once.
Wall-to-wall meetings and the lack of client-settable performance/quality settings in Teams mean that I have had to resort to turning off both outgoing and incoming video in order for CPU temperature to drop and the fans to throttle down into something bearable.
Update: In the meantime, turning off GPU acceleration seems to help considerably, although I now keep Teams closed and use a browser tab to chat throughout the day. I suspect the Intel Integrated Graphics are more hindrance than help in this regard.
I have ranted before about the cultural swing from audio-only conference calls to full-on video, but the net effect is that I can’t have Outlook, PowerPoint and Teams simultaneously open during a meeting without it overheating, and I’m having to shut it down during lunchtime to cool down, so the way I see it, there are at least three possible fixes:
- Have less meetings and do more Real WorkTM (which is another matter altogether)
- Buy a new AC for the office (something I’ve long resisted due to my allergies, which are now in full swing again)
- Throw more hardware at the problem
I can’t run Teams or anything work-related on my iMac to access my corporate network without enrolling it into Intune (something I don’t want to do as a matter of principle) and the usage pattern I now have pretty much demands a Windows desktop machine, so this boils down into either:
- Fetching my KVM host from the closet and adding a second SSD to boot Windows directly (which means I’ll have more fans, more noise and more heat in the office).
- Get more hardware (which is a challenge because whatever I get has to be absolutely quiet, and a setup like Fabien Sanglard’s is expensive).
Now, I have been looking at the current AMD Ryzen range, and it would be nice to get a Ryzen 7 and an NVIDIA discrete GPU to run Tensorflow, but given the kind of work I do right now I don’t think I would have a decent return on investment, and I’m pretty sure a Ryzen 7 and an RTX board would max out the Streacom DB4‘s thermal budget.
I do have a 65W TDP i7 CPU on hand, though, so… Maybe switching that to a bigger case and getting a cheap NVIDIA is feasible–but that needs a lot more research than I currently have time for.
The Nuke And Pave Scenario
Anyway, there are other peculiarities to my current setup that are worth noting, like my having gotten a cheap LG 29WL500 ultrawide as a third monitor recently, which has had an interesting effect in the way I work–I’ve been using Amethyst, and despite some quirks, it’s been a good way to manage all that real estate.
So much so, that if I ever have the guts (and the budget) to buy entirely new office hardware, I’m pretty sure I’m not going to get an iMac again–the built-in Retina display is indeed a thing of wonder, but it just takes up too much space, so the top 3 billing items would likely be:
- Mac mini: 3.2GHz i7 16GB RAM, 1TB SSD, ~€2000
- Monitor: LG 49WL95C or Dell U4919DW 49” Ultrawide, ~€1500
- Windows/Linux machine: AMD Ryzen 7 (or Ryzen 5 3600X) PC with NVIDIA RTX GPU, ~€1500
This is a far cry from my ideal setup of “just” an absolutely silent, (moderately) cool Raspberry Pi 4 thin client and dual 4K displays to tap into remote resources, but nothing’s perfect.
FOCI: a new method for feature selection
It’s been a while since I’ve posted here, not for lack of material but just having too long a TO DO list. I’ve added some important features to my regtools package, for instance, and hope to discuss them here soon.
For the present post, though, I will discuss FOCI, a highly promising new approach to feature selection, developed by Mona Azadkia and Sourav Chatterjee of the Stanford Stat Dept. There is now an R package of the same name on CRAN.
I am one of the authors of the package, but was not involved in developing the method or the associated theory. My connection here was accidental. A few months ago, Sourav gave a talk on FOCI at Stanford. I must admit that I had been skeptical when I read the abstract. I had seen so many proposals on this topic, and had considered them impractical, full of unverifiable assumptions and rather opaque indications regarding asymptotic behavior. So, I almost didn’t attend, even though I was on the Stanford campus that day.
But I did attend, and was won over. The method has only minimal assumptions, explicit asymptotic behavior, and lo and behold, no tuning parameters.
I tried FOCI on some favorite datasets that evening, and was pleased with the results, but the algorithm was slow even on moderate-sized datasets. So I wrote to Sourav, praising the method but suggesting that they parallelize the software. He then asked if I might get involved in that, which I did.
You can find Mona and Sourav’s arXiv paper at https://arxiv.org/pdf/1910.12327.pdf, which extends earlier work by Sourav. The theory is highly technical, I’d say very intricate even by math stat standards, thus not for the faint of heart. Actually, it was amusing during Sourav’s talk when one of the faculty said, “Wait, don’t leave that slide yet!”, as the main estimator (T_n, p.3) shown on that slide, is a challenge to interpret.
The population-level quantity, Eqn. (2.1), is more intuitive. Say we are predicting Y from a vector-valued X, and are considering extending the feature set to (X,Z). The expression is still a bit complex — and please direct your queries to Mona and Sourav for details, not to me  — but at its core it is comparing Var(Y | X,Z) to Var(Y | X). How much smaller is the former than the latter? Of course, there are expectations applied etc., but that is the intuitive heart of the matter.
So here is a concrete example, the African Soil remote sensor dataset from Kaggle. After removing ID, changing a character column to R factor then to dummies, I had a data frame with n = 1157 and p = 3578. So p > n, with p being almost triple the size of n, a nice test for FOCI. For Y, there are various outcome variables; I chose pH.
The actual call is simple:
fout <- foci(afrsoil[,3597],afrsoil[,1:3578])
This specifies the outcome variable and features. There are some other options available. The main part of the output is the list of selected variables, in order of importance. After that, the cumulative FOCI correlations are shown:
> fout$selectedVar
    index    names
 1:  3024 m1668.14
 2:  3078    m1564
 3:  2413 m2846.45
 4:  3173  m1380.8
 5:  3267 m1199.52
 6:  1542 m4526.16
 7:  2546 m2589.96
 8:  3537 m678.828
 9:  3469 m809.965
10:  2624 m2439.54
11:  1874  m3885.9
12:  2770 m2157.98
> fout$stepT[1:12]
 [1] 0.1592940 0.3273176 0.4201255 0.5271957 0.5642336 0.5917753 0.6040584
 [8] 0.6132360 0.6139810 0.6238901 0.6300294 0.6303839
Of course, those feature names, e.g. ‘m1564’, are meaningful only to a soil scientist, but you get the idea. Out of 3578 candidate features, FOCI chose 12, attaining very strong dimension reduction. Actually, the first 8 or so form the bulk of the selected feature set, with the remainder yielding only marginal improvements.
But is it a GOOD feature set? We don’t know in this case, but Mona and Sourav have a very impressive example in the paper, in which FOCI outperforms random forests, LASSO, SCAD and so on. That, combined with the intuitive simplicity of the estimator etc., makes FOCI a very promising addition to anyone’s statistical toolkit. I’m sure more empirical comparisons are forthcoming.
And what about the computation speed? Two types of parallelism are available, with best results generally coming from using both in conjunction: 1. At any step, the testing of the remaining candidate features can be done simultaneously, on multiple threads on the host machine. 2. On a cluster or in the cloud, one can ask that the data be partitioned in chunks of rows, with each cluster node applying FOCI to its chunk. The union of the results is then formed, and fed through FOCI one more time to adjust the discrepancies. The idea is that that last step will not be too lengthy, as the number of candidate variables has already been reduced. A cluster size of r may actually produce a speedup factor of more than r (Matloff 2016).
Approach (2) also has the advantage that it gives the
user an idea of the degree of sampling variability in the FOCI
results.
So there you have it. Give FOCI a try!
BigBlueButton – The Terabyte Week
 An interesting piece of data when operating a video conferencing server is how much data is transferred over the course of a week or a month. When I initially calculated the potential amount of data my BigBlueButton server could potentially consume over the course of a month with 70 people in 4 sessions all showing their videos, 10 hours a day, 5 days a week, I came up with around 25 TB per month. That would have been all right since my virtual server rental contains 20 TB of traffic a month, and each additional TB is billed at a euro or two. But that was the theory, how about practice?
After two weeks of operation I have some actual numbers. As not all of the 70 people were in video calls all the time and not all people show their videos for a number of reasons, the real world number is significantly lower. Also, I spun up a second server that was configured as ‘moderator-only’ video for video conferences in which people with old and restricted devices participate that can’t handle 20 simultaneous video streams. In this setup, only the moderator sees all videos while all participants only see the moderator’s video but not those of other participants.
So in this mixed setup, data traffic over the week was 1 TB, or around 5 TB a month. That’s quite far away from my initial theoretical worst case calculation. Still, an incredible number!
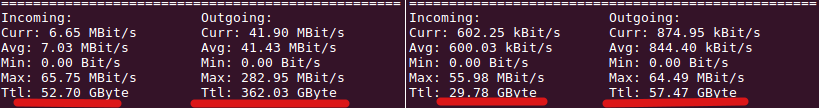
The screenshot on the left shows incoming/outgoing traffic of both servers on Wednesday afternoon, i.e. about halfway through the week. The values on the left is the N:N video setup while the values on the left are from the 1:N video setup. As you can see the ratio between outgoing and incoming is 362 GB out / 52 GB in = 6.9 for N:N video. That means that each incoming video was streamed out again to an average of 6.9 participants. In practice, I noticed that even when 20 videos were steamed to a client, the client’s downlink data rate was around 3.5 Mbit/s. For 20 original videos at 300 kbit/s that should have been twice that rate. So perhaps, some compression is done on the server? If that is the case, then the real ratio would have been 14 streams outgoing for each incoming stream.
For the 1:N video setup the ratio between outgoing and incoming traffic was 57/29 = 1,9 for 1:N video. That means each incoming video was streamed to 1.9 other people. This is because the moderator sees all videos while participants only see one video. Also, CPU load on this server per participant is less than 50% of the load on the N:N video server. A significant difference!
Working For A Community vs. Working With A Community
Are you working for a community or with a community?
The former is usually when projects go wrong.
The community leader comes up with ideas and then launches them to a community that didn’t ask for it or wasn’t involved in the process of developing it.
This happens time and time again. Companies develop features or ideas which are just a bad fit for their community.
Developing a project with a community is different. You come with a blank slate, research their needs and desires, develop and test ideas to find the one that works best. Then you scale the idea to the entire community.
If you can get past some jargon, this is one of the best reads on the community development process today.
You might also be able to get a free PDF here.
Please Excuse the House Cleaning Around Here…
Neue Apple Sportbänder

Apple verkauft ab heute zwei neue Sportbänder und liefert mit dem nächsten kleinen watchOS-Update auch die passenden Zifferblätter nach. Gerade gestern erst habe ich gedacht, dass ich gut mal wieder ein anderesfarbiges Sportband hätte. Da passt das gut. Für mich sind die Sportbänder ideal. Angenehm zu tragen, leicht sauber zu halten, und sie halten einfach bombenfest. Was man unbedingt meiden sollte, sind allderdings die billigen Nachahmungen auf Amazon. Was ähnlich aussieht, kann trotzdem richtig schlecht sein, im schlimmsten Fall auch ungesund.
Der Regenbogen mit sechs Farben steht für Toleranz und Frieden (Pace), eine Symbolik, die mir gefällt. Der Paragraph 175 des StGB wurde erst in meiner Jugend reformiert (und 1994 endlich gestrichen). Einer der engen Freunde meiner Jugend musste seine Homosexualität stets geheim halten. Eine Farce!
Granville Island from above

This 1950 image shows Granville Island crammed with industrial businesses. It had once been a sandbar, used by the Squamish natives to catch fish while they occupied their nearby winter settlement of Snauq. They had a fish weir, built of twisted vine maple, that led flounders and smelts into a fish trap. As development of the new city forced them off their traditional lands, and the forest was cut down, various attempts were made to acquire and develop on the sandbars, none successful. A lumber and planing mill was established on the muddy foreshore, next to the bridge that had been piled across the Creek in 1889. By 1903 the mill’s footprint had been extended, with the insurance map identifying ‘land made of slabs and sawdust’, but the sandbar remained undeveloped. By 1912 the mill was larger, operated as the Rat Portage Lumber Co, with a new bridge alongside the first, and the Hanbury Lumber Company’s mill to the east, on the southern shore. They leased moorings from Canadian Pacific in the creek, where miles of log booms were tethered, awaiting processing in the mill.
In 1913 everything changed with the creation of the Vancouver Harbour Commission. Given control over all tidal waters, they set about creating solid land to expand industrial operations. Hanbury’s lost the water rights in front of their mill; the Federal Government announced that CPR had never had the rights in the first place. CPR’s foreshore rights wouldn’t be settled until 1928. In the meantime the Harbour Commission started piling a bulkhead around the sandbars, and building a rail track and a road from the south shore. They raised $300,000 from the sale of bonds that paid 5% interest, and hired Pacific Dredging to deepen the channel and pile the fill inside the bulkhead. With a brief stop while wartime priorities interupted, by 1916 a million cubic yards of mud had been sucked from the creek, and ‘Industrial Island’ had been built at a cost of $342,000.
Tenants soon moved in; Wallace Shipyards followed Vulcan Ironworks, with BC Equipment Ltd first to build a corrugated tin repair and assembly shop on the island’s north-west corner. Leases were for 21 years, ranging from $500 to $1,500 per acre. There were two miles of rail tracks, and all services; water, gas and electricity. Businesses fabricated wire ropes; built band saws; assembled steel chains. Transport businesses occupied huge warehouses. By 1930 there were 1,200 workers on the island. By 1936 the National Harbours Board were running the island, and arguing that as tenants of a federal agency, the businesses stopped paying taxes to the city. Only an appeal in the House or Lords in London reinstated the revenue, several years later. Business boomed during the war, with demand for the ropes, chains and other products coming from the expanded ship-building operations up and down False Creek.
By 1950, when the photo was taken, business was still strong, but the creek had become run down and lined with semi-derelict buildings. Alderman Jack Price proposed that, rather than rebuilding the ageing Georgia Viaducts, and crumbling Cambie and Granville bridges, the entire creek should be filled in. The CPRs William Van Horne had first suggested the idea decades earlier. The 1950 campaign, supported by mayor Fred Hume, was derailed because a new Granville Bridge was already well advanced in planning. The new alignment can be seen in the picture; the piers were constructed through the existing buildings in some places. A further study shut the idea down completely; the engineering, compensation for lost riparian rights, and new infrastructure would have cost $50m, and created land worth $9m.
By the mid 1960s many of the businesses had closed, and an arsonist had destroyed several of the buildings. Demand for the remaining businesses that supported the lumber mills disappeared as those too burned down, and were not rebuilt. The plans to transform the island into a different kind of place were started in the early 1970s, as the remainder of South False Creek started redevelopment. It took until 1978 for the unique mix of new uses, retained and repurposed buildings, and shared street space to become an adopted plan. Designed by Hotson Bakker, the Island has gradually changed over time, but continues under federal ownership to offer locally owned markets, restaurants, arts enterprises and spaces for craft manufacturing seen in this 2018 image.
Image source: City of Vancouver Archives CVA 216-39 and Trish Jewison, Global BC helicopter on twitter.
0974
Apple Releases New Pride Edition Watch Bands Ahead of Pride Month, New Watch Faces Coming Soon

In anticipation of Pride month in June, Apple today has announced the release of two new Pride Edition bands for the Apple Watch, and new Pride watch faces that will be available soon as part of the watchOS 6.2.5 release.
It’s become an annual tradition for Apple to debut a new Pride band for Apple Watch and an accompanying watch face, but this is the first time there have been two new options launching. The Pride Edition Sport Band features the traditional rainbow pattern similar to last year’s offering, though that previous band was a Sport Loop, rather than the first-time Sport Band option available this year. The Nike Pride Edition Sport Band follows the unique design style of Nike’s other bands, but with its rainbow colors adorning the white band’s holes. The Nike Pride face arriving in the next watchOS update is unique as well, with colored dots representing the face’s hour markings.
The new Watch bands will be available today from the Apple Store, and watchOS 6.2.5 is anticipated to release some time in the next month leading up to WWDC.
Support MacStories Directly
Club MacStories offers exclusive access to extra MacStories content, delivered every week; it’s also a way to support us directly.
Club MacStories will help you discover the best apps for your devices and get the most out of your iPhone, iPad, and Mac. Plus, it’s made in Italy.
Join NowI don’t know right now
Every so often when I look away from this screen to look out of the window, I am struck by the fact that what I am looking at is three dimensional. A screen, of course, isn’t. Though there are increasingly frequent images which try to get around this.
I looked away because I had just read Elizabeth Warren’s experience of dealing with one of her brother’s death from COVID-19. I do not know her, of course. I just know of her. Of her relationship to her brothers, not at all. Until now. And, for reasons that I am at a loss to explain, this one hit home. Hard.
And she is right. It did not have to happen like this.
"While the world searches for a vaccine for the virus, the vaccine for its coming crises — not least..."
Former Nintendo boss Reggie Fils-Aimé’s new charity gaming podcast premieres today

A few weeks ago, former Nintendo of America president Reggie Fils-Aimé announced plans to co-host a new gaming podcast in support of charity.
Today, the seven-part series premieres with its first episode at 12pm ET. Titled “Talking Games with Reggie and Harold,” the series follows Fils-Aimé and journalist Harold Goldberg as they discuss gaming-related subjects with various guests.
The first episode will feature Henry Love, program director at Gateway Housing NYC, a nonprofit that aims to help homeless children in New York. To that end, Love will discuss how video games can positively impact young people facing poverty and homelessness.
The following week’s episode will have a gaming industry guest who will be revealed closer to the time. So far, Canadian gaming entrepreneur Geoff Keighley, who’s curating the ongoing digital Summer Game Fest, is set to appear on “Talking Games with Reggie and Harold” at some point.
The main reason for the show, however, is to raise money for the New York Videogame Critics Circle, which will use the proceeds to donate video games and consoles to homeless shelters in New York. You can donate through this GoFundMe campaign.
The podcast will be free to listen to without a donation, but there are still several good reasons to pitch in. Besides just supporting a good cause, donating will give you exclusive perks, such as the option to submit questions to Fils-Aimé and access to a private action for rare items — most notably, a Nintendo Power magazine signed by Mario creator Shigeru Miyamoto.
Once it goes live at 12pm ET, you can listen to the podcast here.
The post Former Nintendo boss Reggie Fils-Aimé’s new charity gaming podcast premieres today appeared first on MobileSyrup.
Woz Sez: Take Some Time To Get To Know Your Program Better
Steve Wozniak in Founders at Work:
If you can just quickly whip something out and it's done, maybe it's time, once in a while, to think and think and think, "Can I make it better than it is, a little superior?" What that does is not necessarily make the product better in the end, but it brings you closer to the product, and your own head understands it better. Your neurons have gone through the code you wrote, or the circuits you designed, have gone through it more times, and it's just a little more solidly in your head and once in a while you'll wake up and say, "Oh my God, I just realized a bug that's in there, something I hadn't thought of."
Or, if you have to modify something, or add something new, you can do it very quickly when it's all in your head. You don't have to pull out the listing and find out where and maybe make a mistake. You don't make as many mistakes.
Many programmers know this feeling, of having a program in your head and moving in sync with it. When programs are small, it's easy for me to hold a program in my head. As it grows larger and spreads out over many functions, classes, and files, I have to live with it over an extended period of time. Taking one of Woz's dives into the just to work on it is a powerful way to refresh the feeling.
Beginning programmers have to learn this feeling, I think, and we should help them. In the beginning, my students know what it's like to have a program in their head all at once. The programs are small, and the new programmer has to pay attention to every detail. As programs grow, it becomes harder for them. They work locally to make little bits of code work, and suddenly they have a program that does fit naturally in their head. But they don't have the luxury of time to do what Woz suggests, because they are on to the next reading assignment, the next homework, the next class across campus.
One of the many reasons I like project courses such as my compiler course is that students live with the same code for an entire semester. Sure, they finish the scanner and move on to the parser, and then onto a type checker and a code generator, but they use their initial stages every day and live with the decisions they made. It's not uncommon for a student to tell me 1/2 or 3/4 of the way through the course, "I was looking at our scanner (or parser) the other day, and now I understand why we were having that problem I told you about. I'm going to fix it over Thanksgiving break."
In my programming languages course, we close with a three week three assignment project building an interpreter. I love when a student submitting on Part 3 says, "Hey, I just noticed that some parts of Part 2 could be better. I hope you don't mind that I improved that, too." Um, no. No, I don't mind at all. They get it.
It's easy to shortchange our students with too many small projects. I like most of my courses to have at least some code grow over the course of the semester. Students may not have the luxury of a lot of free time, but at least they work in proximity to their old code for a while. Serendipity may strike if we create the right conditions for it.
I have already begun to think about how I can foster this in my new course this fall. I hope to design it into the course upfront.
Realising You Now Have a Distributed Organisation
A public sector client announced last week that working from home will be their default until September 1st for certain, and maybe until January 1st. I can imagine why, there is no real way to house their 1600 staff under distancing guidelines, and the staff restaurant (that usually caters to some 1200 people in 90 minutes each day) has no real way of accomodating people for lunch in meaningful numbers. Three similar organisations in a different part of the country announced they would keep working from home until January.
I wonder how this may shift modes of working over time, now that centralised working is replaced by distributed working. When will public sector organisations realise they now have eyes and ears on the ground everywhere in their area, and put that to good use? In our experience not ‘going outside’ for real stories and feedback from directly involved people often reduces the quality of choices and decisions made, as observations get replaced by assumptions. This is true for any type of larger organisation I think, but now we all of a sudden have turned them into a distributed network.
If you’re in a larger organisation working from home, do you have a notion of where all your people are, and is that geographical spread a potential instrument in your work?
iA Writer Now Supports Micropub
Boris wrote that iA Writer has support for Micropub now. That sounds interesting, as it would allow me to write locally, and publish to several of my sites, both online and on my local system.
Somehow I can’t get the iA app to talk to my IndieAuth endpoint yet. Not sure what the issue is, but duckduckgo-ing the error message seems to indicate it has to do with some system settings on my laptop?
The resource could not be loaded because the App Transport Security policy requires the use of a secure connection

This is a second attempt to write to my blog fr...
This is a second attempt to write to my blog from iA writer via Micropub. I wonder how to determine categories, and tags.
#timeline #indieweb #wordpress
Added: it correctly adds timeline as category. It does not add wordpress or indieweb as tag. Ideally you would be able to also indicate post kind (note or article e.g.), and determine draft or published status.
one weird trick to shorten public transit transfers quickly and easily! transit planners HATE him! twitter.com/derspiegel/sta…
|
mkalus
shared this story
from |
one weird trick to shorten public transit transfers quickly and easily! transit planners HATE him! twitter.com/derspiegel/sta…
In Hamburg ist ein Bus durch die Glasfassade eines Bahnhofs gefahren - dennoch ging der Unfall glimpflich aus. "Wir haben mächtig Glück gehabt", sagte ein Feuerwehrmann. spiegel.de/panorama/hambu… pic.twitter.com/hNxZGaAcHc

139 likes, 33 retweets


37 likes, 4 retweets
Attach Your R Code To Charts You Tweet For Reproducible R Tweets!
I caught this tweet by Terence Eden about using Twitter image alt-text to “PGP sign” tweet and my mind immediately went to “how can I abuse this for covert communications, malicious command-and-control, and embedding R code in tweets?”.
When you paste or upload an image to tweet (web interface, at least) you have an opportunity to add “alt” text which is — in theory — supposed to help communicate the content of the image to folks using assistive technology. Terence figured out the alt-text limit on Twitter is large (~1K) which is plenty of room for useful R code.
I poked around for something to use as an example and settled on using data from COVID Stimulus Watch. The following makes the chart in this tweet — https://twitter.com/hrbrmstr/status/1261641887603179520.
I’m not posting the chart here b/c it’s nothing special, but the code for it is below.
library(hrbrthemes);

x <- read.csv("https://data.covidstimuluswatch.org/prog.php?&detail=export_csv")[,3:5];

x[,3] <- as.numeric(gsub("[$,]","",x[,3]));
x <- x[(x[,1]>20200400)&x[,3]>0,];
x[,1] <- as.Date(as.character(x[,1]),"%Y%m%d");

ggplot(x, aes(Award.Date, Grant.Amount, fill=Award.Type)) +
  geom_col() +
  scale_y_comma(
    labels = c("$0", "$5bn", "$10bn", "$15bn")
  ) +
  labs(
    title = "COVID Stimulus Watch: Grants",
    caption = "Source: https://data.covidstimuluswatch.org/prog.php?detail=opening"
  ) +
  theme_ipsum_es(grid="XY")
Semicolons are necessary b/c newlines are going to get stripped when we paste that code block into the alt-text entry box.
We can read that code back into R with some help from read_html() & {styler}:
library(rtweet)
library(rvest)
library(stringi)
library(magrittr)

pg <- read_html("https://twitter.com/hrbrmstr/status/1261641887603179520")

html_nodes(pg, "img") %>%
  html_attr("alt") %>%
  keep(stri_detect_fixed, "library") %>%
  styler::style_text()
library(hrbrthemes)
x <- read.csv("https://data.covidstimuluswatch.org/prog.php?&detail=export_csv")[, 3:5]
x[, 3] <- as.numeric(gsub("[$,]", "", x[, 3]))
x <- x[(x[, 1] > 20200400) & x[, 3] > 0, ]
x[, 1] <- as.Date(as.character(x[, 1]), "%Y%m%d")
ggplot(x, aes(Award.Date, Grant.Amount, fill = Award.Type)) +
  geom_col() +
  scale_y_comma(
    labels = c("$0", "$5bn", "$10bn", "$15bn")
  ) +
  labs(
    title = "COVID Stimulus Watch: Grants",
    caption = "Source: https://data.covidstimuluswatch.org/prog.php?detail=opening"
  ) +
  theme_ipsum_es(grid = "XY")
Twitter’s API does not seem to return alt-text: (see UPDATE)
rtweet::lookup_statuses("1261641887603179520") %>%
jsonlite::toJSON(pretty=TRUE)
## [
## {
## "user_id": "5685812",
## "status_id": "1261641887603179520",
## "created_at": "2020-05-16 12:57:20",
## "screen_name": "hrbrmstr",
## "text": "Twitter's img alt-text limit is YUGE! So, we can abuse it for semi-covert comms channels, C2, or for \"embedding\" the code ## that makes this chart!\n\nUse `read_html()` on URL of this tweet; find 'img' nodes w/html_nodes(); extract 'alt' attr text w/## html_attr(). #rstats \n\nh/t @edent https://t.co/v5Ut8TzlRO",
## "source": "Twitter Web App",
## "display_text_width": 278,
## "is_quote": false,
## "is_retweet": false,
## "favorite_count": 8,
## "retweet_count": 2,
## "hashtags": ["rstats"],
## "symbols": [null],
## "urls_url": [null],
## "urls_t.co": [null],
## "urls_expanded_url": [null],
## "media_url": ["http://pbs.twimg.com/media/EYI_W-xWsAAZFeP.png"],
## "media_t.co": ["https://t.co/v5Ut8TzlRO"],
## "media_expanded_url": ["https://twitter.com/hrbrmstr/status/1261641887603179520/photo/1"],
## "media_type": ["photo"],
## "ext_media_url": ["http://pbs.twimg.com/media/EYI_W-xWsAAZFeP.png"],
## "ext_media_t.co": ["https://t.co/v5Ut8TzlRO"],
## "ext_media_expanded_url": ["https://twitter.com/hrbrmstr/status/1261641887603179520/photo/1"],
## "mentions_user_id": ["14054507"],
## "mentions_screen_name": ["edent"],
## "lang": "en",
## "geo_coords": ["NA", "NA"],
## "coords_coords": ["NA", "NA"],
## "bbox_coords": ["NA", "NA", "NA", "NA", "NA", "NA", "NA", "NA"],
## "status_url": "https://twitter.com/hrbrmstr/status/1261641887603179520",
## "name": "boB • Everywhere is Baltimore • Rudis",
## "location": "Doors & Corners",
## "description": "Don't look at me…I do what he does—just slower. 🇷 #rstats avuncular • pampa • #tired • 👨🍳 • ✝ • Prìomh ## Neach-saidheans Dàta @ @rapid7",
## "url": "https://t.co/RgY1wHjoqM",
## "protected": false,
## "followers_count": 11886,
## "friends_count": 458,
## "listed_count": 667,
## "statuses_count": 84655,
## "favourites_count": 15140,
## "account_created_at": "2007-05-01 14:04:24",
## "verified": true,
## "profile_url": "https://t.co/RgY1wHjoqM",
## "profile_expanded_url": "https://rud.is/b",
## "profile_banner_url": "https://pbs.twimg.com/profile_banners/5685812/1398248552",
## "profile_background_url": "http://abs.twimg.com/images/themes/theme15/bg.png",
## "profile_image_url": "http://pbs.twimg.com/profile_images/824974380803334144/Vpmh_s3x_normal.jpg"
## }
## ]
but I still need to poke over at the API docs to figure out if there is a way to get it more programmatically. (see UPDATE)
If we want to be incredibly irresponsible and daft (like a recently semi-shuttered R package installation service) we can throw caution to the wind and just plot it outright:
library(rtweet)
library(rvest)
library(stringi)
library(magrittr)

pg <- read_html("https://twitter.com/hrbrmstr/status/1261641887603179520")

html_nodes(pg, "img") %>%
  html_attr("alt") %>%
  keep(stri_detect_fixed, "library") %>%
  textConnection() %>%
  source() %>% # THIS IS DANGEROUS DO NOT TRY THIS AT HOME
  print()
Seriously, though, don’t do that. Lots of bad things can happen when you source() from the internet.
UPDATE (2020-05-17)
You can use:
paste(as.character(parse(text = "...")), collapse = "; ")
to “minify” R code for the alt-text.
And, you can use https://github.com/hrbrmstr/rtweet until it is PR’d back into {rtweet} proper to send tweets with image alt-text. The “status” functions also return any alt-text in a new ext_alt_text column.
FIN
Now, you can make your Twitter charts reproducible on-platform (until Twitter does something to thwart this new communication and file-sharing channel).
Since twitter status URLs are just GET requests, orgs should consider running the content of those URLs through alt-text extractors just in case there’s some funny business going on across user endpoints.