A new investigation reveals that children as young as five can easily access inappropriate content and interact unsupervised with adults on Roblox, despite the platform's child-friendly image and recent safety updates. The Guardian reports: Describing itself as "the ultimate virtual universe," Roblox features millions of games and interactive environments, known collectively as "experiences." Some of the content is developed by Roblox, but much of it is user-generated. In 2024, the platform had more than 85 million daily active users, an estimated 40% of whom are under 13. While the company said it "deeply sympathized" with parents whose children came to harm on the platform, it said "tens of millions of people have a positive, enriching and safe experience on Roblox every day."
However, in an investigation shared with the Guardian, the digital-behavior experts Revealing Reality discovered "something deeply disturbing ... a troubling disconnect between Roblox's child-friendly appearance and the reality of what children experience on the platform." [...] Despite new tools launched last week aimed at giving parents more control over their children's accounts, the researchers concluded: "Safety controls that exist are limited in their effectiveness and there are still significant risks for children on the platform."
There’s a lot going on in our wireless world, and the number of packets whizzing back and forth between our devices is staggering. All this information can be a rich vein to mine for IoT hackers, but how do you zero in on the information that matters? That depends, of course, but if your application involves Bluetooth, you might be able to snoop in on the conversation relatively easily.
By way of explanation, we turn to [Mark Hughes] and his Boondock Echo, a device we’ve featured in these pages before. [Mark] needed to know how long the Echo would operate when powered by a battery bank, as well as specifics about the power draw over time. He had one of those Fnirsi USB power meter dongles, the kind that talks to a smartphone app over Bluetooth. To tap into the conversation, he enabled Host Control Interface logging on his phone and let the dongle and the app talk for a bit. The captured log file was then filtered through WireShark, leaving behind a list of all the Bluetooth packets to and from the dongle’s address.
That’s when the fun began. Using a little wetware pattern recognition, [Mark] was able to figure out the basic structure of each frame. Knowing the voltage range of USB power delivery helped him find the bytes representing voltage and current, which allowed him to throw together a Python program to talk to the dongle in real-time and get the critical numbers.
It’s not likely that all BLE-connected devices will be as amenable to reverse engineering as this dongle was, but this is still a great technique to keep in mind. We’ve got a couple of applications for this in mind already, in fact.
Ambient mode is the new sidecar-less data plane introduced in Istio in 2022. When ambient mode reached Beta status in May this year, I watched users kick the tires and run load tests to understand the performance implications after adding their applications to the mesh.
Inspired by Quentin Joly’s blog about the incredible performance of Istio in ambient mode and similar feedback from other users in the community that sometimes applications are slightly faster in ambient mode, I decided to validate these results myself.
Test Environment:
I used a three-worker node Kubernetes cluster with 256GB RAM and a 32-core CPU in each node.
Istio uses a few tools to make consistent benchmarking easy. First, we use a load testing tool called Fortio, which runs at a specified number of requests per second (RPS), records a histogram of execution time and calculates percentiles — e.g., P99, the response time where 99% of the requests took less than that number.
We also provide a sample app called Bookinfo, which includes microservices written in Python, Java, Node.js and Ruby.
Each of the Bookinfo deployments has two replicas, which are evenly distributed to the three-worker nodes. Using a pod anti-affinity rule, I made sure that Fortio was placed on a different node than the details service.
Initial Test Result
I installed the Bookinfo application from the Istio v1.22.3 release. Using the Fortio tool to drive load to individual Bookinfo services (for example, details) or the full Bookinfo app, I noticed near-zero latency impact after adding everything to the ambient mesh. Most of the time they are within the range of 0-5% increase for the average or P90. I have noticed consistently that the details service in Istio ambient mode is slightly faster, just like Quentin reported in his blog.
Load Testing the Details Service
I did the same test as Quentin, sending 100 RPS via 10 connections to the details service, and collected results for no mesh and ambient.
No Mesh: 100 RPS to the details service.
Ambient: 100 RPS to the details service.
Just like Quentin, I had to run multiple tests to validate that ambient mode is slightly more performant than no mesh — which is very hard to believe! In the case of the Bookinfo details service, adding ambient mode improved latencies by 6-11% on average — as well as adding mTLS and L4 observability!
Fortio to details
Average
P50
P75
P90
P99
Differences
No Mesh run 1
0.89ms
0.64ms
0.74ms
0.85ms
2.67ms
11% slower on average and 5% slower for P90
Ambient run 1
0.80ms
0.6ms
0.71ms
0.81ms
1.4ms
No Mesh run 2
0.86ms
0.65ms
0.75ms
0.86ms
1.71ms
6% slower on average and 4% slower for P90
Ambient run 2
0.81ms
0.61ms
0.72ms
0.83ms
1.56ms
No Mesh run 3
0.90ms
0.65ms
0.76ms
0.88ms
1.92ms
10% slower on average and 5% slower for P90
Ambient run 3
0.82ms
0.63ms
0.72ms
0.84ms
1.5ms
Table 1: Fortio to the details service 100 RPS 10 connections.
Why Are Apps Sometimes Faster in the Ambient Mesh?
We’ve been taught that service meshes add latency. Quentin’s results, replicated here, show a case where a workload is faster when running through a service mesh. What is happening?
First Theory
When your applications are in the ambient mesh, the load requests travel first through a lightweight local node proxy called ztunnel, then to the destination ztunnel, and onward to the service. The details service is using HTTP/1.1 with the Webrick library in Ruby and we have seen poor connection management and keep-alive behaviors in older or poorly configured HTTP libraries. My first hypothesis was that when the client and server are on different nodes, proxying through client and server ztunnels could actually be faster if the applications are not using efficient HTTP/2 connections. Ztunnel uses connection pooling and HTTP Connect to establish secure tunnels between nodes to leverage parallelism and HTTP/2 stream multiplexing under loads.
However, this theory has some challenges. Why have I only observed this consistently with the details service but not any other Bookinfo services?
Researching further, I discovered that our Fortio load tool has connection keep-alive enabled by default. With 10 connections from Fortio to the details service and the details service (using the WEBrick Ruby library) respecting the connection keep-alive settings, the connections can be reused effectively without ambient.
Load Testing With Connection Close
Next, I explored running the same load testing with setting the Connection: close header. This forcibly disables any HTTP connection pooling which is a good way to test this hypothesis.
No Mesh: Fortio to the details service 100 RPS 10 connections with connection close.
Ambient: Fortio to the details service 100 RPS 10 connections with connection close.
Fortio to details
Average
P50
P75
P90
P99
Differences
No Mesh
1.90ms
1.72ms
2.28ms
2.77ms
3.98ms
Ambient
2.06ms
2.15ms
2.65ms
2.94ms
4ms
8% slower for average & 6% slower for P90
Table 2: Fortio to the details service 100 RPS 10 connections with connection close.
Compared with Table 1 results, Table 2 numbers have much higher response times, which is expected as each connection is closed immediately after each response from the details service. Given P50, P75, P90 and P99 are all slower from the ambient run with connection close, it seems safe to rule out connection pooling in ztunnel from the first theory could make requests faster.
Second Theory
I noticed there is a performance-related PR from John Howard in the details and productpage services of the Bookinfo application in our new Istio v1.23 release. For the details service, the PR enabled the TCP_NODELAY flag for the details WEBrick server, which would reduce the unnecessary delay (up to 40ms) from the response time of the details service. For the productpage service, the PR enabled keep-alive on incoming requests, which will reuse existing incoming connections and thus improve performance.
With the newly updated details deployment that includes the fix, I repeated the same tests sending 100 RPS via 10 connections to the details service. The results for no mesh and ambient are really close so I ran each of the tests three times to ensure the results are consistent. Below are screenshots of the first run for each scenario:
No Mesh: Fortio to the new details service 100 RPS 10 connections.
Ambient: Fortio to the new details service 100 RPS 10 connections.
I built a table for the three runs for each scenario:
Fortio to details
Average
P50
P75
P90
P99
Differences
1
No Mesh
0.76ms
0.58ms
0.69ms
0.81ms
1.56ms
5% slower on average and P90. 25% slower on P99
Ambient
0.72ms
0.57ms
0.66ms
0.76ms
1.24ms
2
No Mesh
0.72ms
0.59ms
0.7ms
0.82ms
1.6ms
3% slower on P90and18% slower on P99
Ambient
0.76ms
0.59ms
0.69ms
0.8ms
1.37ms
5% slower on average
3
No Mesh
0.77ms
0.58ms
0.7ms
0.8ms
1.49ms
1% slower on average and 8% slower on P99
Ambient
0.76ms
0.59ms
0.69ms
0.81ms
1.38ms
1% slower on P90
Table 3: Fortio to the new details service 100 RPS 10 connections.
Compared with the previous result from Table 1, the no mesh numbers from Table 3 have improved quite a bit (more substantially at higher percentage than the ambient numbers) and are now closer to the ambient numbers. Ztunnel has TCP_NODELAY enabled by default, which contributed to the ambient performance improvement over no mesh in Table 1 when the old details service doesn’t have TCP_NODELAY enabled. When the new details service has TCP_NODELAY enabled, it has also improved the ambient response times slightly.
Table 3 also shows there is not much difference for average, P50, P75, and P90 between no mesh and ambient runs for this type of load testing to the new details service with TCP_NODELAY enabled. The differences between these runs are likely noise with the exception of P99 where the no mesh is consistently 8% or more slower.
Third Theory
Continue reviewing the test results from Table 3, why would there be similar latency between no mesh and ambient when there are extra hops to ztunnel pods and significant benefits provided by ambient such as mTLS and L4 observability between the Fortio and details service? For the P99 case, why would the details service in the ambient mode be faster consistently?
Ztunnel provides great read/write buffer management with HTTP/2 multiplexing, which could effectively minimize or sometimes even eliminate the overhead added by the extra hops through the client and the server ztunnel pods. I decided to measure this with syscalls using strace from both the Fortio and details service by getting into their Kubernetes worker nodes and attaching the pids using strace while filtering out the irrelevant traces:
Output 1: No mesh or ambient — attach strace to the details service’s PID.
The strace outputs from the Fortio service for no-mesh vs ambient are different. In the no-mesh case, we see Fortio executed two reads, one for the HTTP headers and another for the body.
Output 3: Ambient mesh — attach strace to Fortio’s PID.
Why would this happen? It makes sense that the write calls are unchanged since they are entirely based on the application behavior which is not changed in this case. Ambient coalesces these multiple application writes and converts them into a single network write and by implication a single read in the peer.
In the test scenario above I observed a 60% reduction in total syscalls by the Fortio service with ambient enabled. This is very substantial and explains the majority of the improvement in latency and ~25% CPU reduction of the Fortio pod at peak time with ambient. The reduction in syscalls is more than offsetting the cost of mTLS and the other features of ztunnel. I expect this pattern to be quite common in enterprises with some HTTP libraries and applications doing a better job of buffering and flushing and some not so much. Often this will correlate with the age of applications and the SDKs they were built on.
No mesh and ambient runs: Fortio to the details service 100 QPS 10 connections.
What About the Entire Bookinfo Application?
With the newly updated details and productpage deployments, I started with sending 1000 RPS via 100 connections to the Bookinfo application, and observed great results for no mesh and ambient.
No Mesh: Fortio to the new Bookinfo app 1000 RPS 100 connections.
No Mesh: Fortio to the new Bookinfo app 1000 RPS 100 connections.
Fortio to Bookinfo
Average
P50
P75
P90
P99
Average Differences
No Mesh
1.39ms
1.32ms
1.42ms
1.67ms
2.19ms
Ambient
1.40ms
1.34ms
1.48ms
1.68ms
2.94ms
Less than 1% slower for average and P90
Table 4: Fortio to the new Bookinfo app 1000 RPS 100 connections.
For comparison, I also ran the same test against the old Bookinfo sample shipped in v1.22.3, and you can see that the new Bookinfo made 5-10X improvements on response times, for either no mesh or ambient!
Fortio to Bookinfo
Average
P50
P75
P90
P99
Average Differences
No Mesh
6.35ms
4.68ms
7.44ms
11.4ms
36.63ms
Ambient
6.74ms
4.9ms
7.79ms
12.12ms
41.14ms
6% slower
Table 5: Fortio to the old Bookinfo app 1000 RPS 100 connections.
Increased the load to 4000 RPS with 400 connections with the new Bookinfo deployments:
Ambient: Fortio to the new Bookinfo app 4000 RPS 400 connections.
Ambient: Fortio to the new Bookinfo app 4000 RPS 400 connections.
The response times are still very good, way better than the old Bookinfo app with only 1000 RPS and 100 connections (Table 5):
Fortio to Bookinfo
Average
P50
P75
P90
P99
Average Differences
No Mesh
1.54ms
1.33ms
1.54ms
2.25ms
3.98ms
Ambient
1.58ms
1.37ms
1.57ms
2.33ms
4.9ms
3% slower on average and 4% slower on P90
Table 6: Fortio to the new Bookinfo app 4000 RPS 400 connections.
It is really nice to see that Bookinfo handles 4000 RPS without any errors and ambient mode is about 3-4% slower than no mesh with all the benefits of encryption in transit with mTLS and L4 observability. I recall I could only reach up to 1200 RPS with the old Bookinfo app, which already resulted in a small percentage of errors. Now I can increase loads to 4000 or higher RPS without errors.
Wrapping Up:
Ambient mode at L4 introduces only a very tiny impact — and occasionally even an automatic improvement! — to users’ application latencies. Combined with the simple UX by labeling the namespace to enroll your application to ambient without restarting any workloads, it provides a delightful experience to users that we intended when we initially named it ambient.
I would like to thank all of our Istio maintainers who built such a delightful project and CNCF for providing the Istio project access to the infrastructure lab where I performed the test. I would also like to thank Quentin Joly and many users who provided me with the “ambient is slighter faster than no mesh sometimes” feedback which triggered me to run the above benchmark tests to experience the improvement or tiny latency impact under load for myself.
Getting started with Kubernetes is a handful. From(re)learning how to architect an application for cloud native infrastructures to coming to grips with a declarative and mostly YAML-driven approach to application configuration, the Kubernetes adoption process is full of challenges difficult to overcome.
Maybe the most challenging, if not to say urgent, obstacle occurs when you discover that not all YAML is created equal, secure or compliant. Introducing a tool to help you and your team(s) by providing guardrails for correctly crafting YAML configurations from the get-go becomes essential to adoption success.
Initially, you might opt for linting tools, or IDE plugins to help you with your YAML crafting, but you’ll realize that enforcing configuration rules (or “policies”) locally isn’t enough as configurations can easily “slip between the cracks” and end up in your git repo or cluster without being locally validated, resulting in another tedious debugging session.
Or you might start by installing a dedicated policy tool in your cluster, like Kyverno or OPA Gatekeeper. But quickly you’ll find out that although these tools are powerful, they aren’t made for someone new to Kubernetes who just wants to get basic security policies into place. You’ll end up having to learn more YAML and their respective “policy languages” before you get some basic policies into place.
What you really need is a policy solution that gets you and your team started with common-sense security policies and best practices across the entire development life cycle in a quick and straightforward way without having to learn a new policy language, but with advanced features that you can grow into as you continue to mature on your Kubernetes journey.
Behold Monokle!
What Is Monokle?
Monokle is a comprehensive open source platform for Kubernetes policy enforcement. Monokle greatly simplifies the tasks of:
Defining and managing configuration policies.
Enforcing policies across the entire development life cycle.
Identifying and fixing misconfigurations in your code and clusters.
To achieve this, the Monokle platform provides three sets of tools:
1. Policy enforcement Tools that you can use across the development life cycle to check your YAML configurations against your defined policies. They include:
Monokle VS-Code Extension
Monokle CLI
Monokle GitHub Bot and Action
Monokle Admission Controller
Monokle Desktop
2. Policy management console
A browser-based console used to manage and track the policies that will be used in the enforcement points listed above.
Monokle Cloud runs the console in the cloud.
Monokle Enterprise is an on-premises deployment of Monokle Cloud, with single sign-on integration capabilities.
3. Configuration IDEs
Visual developer tools dedicated to identifying and fixing misconfigurations in your configurations and clusters.
Monokle Desktop
Monokle Web IDE (part of Monokle Cloud)
80+ Configuration Policy Rules — No Coding Required
Monokle comes with more than 80 policy rules out of the box, with no need to learn any policy languages to get started. The included rules are all you would expect of a modern policy platform:
Security rules to ensure that your deployments don’t expose an exploitable attack surface, including compliance with NSA/CIS frameworks.
Resource usage to ensure that your applications make use of resources correctly.
Resource metadata to ensure that your resources have the correct metadata.
Kubernetes version compliance ensures/validates compliance with target Kubernetes versions.
Resource links to ensure that resources don’t refer to invalid/unknown peer resources.
If these don’t cover your validation needs, creating custom policies is of course possible (more on that below).
Policy Enforcement Everywhere
Monokle makes it easy to enforce your policies across the entire development life cycle:
The VS-Code extension integrates real-time misconfiguration detection in your local development workflows.
The Monokle CLI allows you to validate your YAML configurations locally or as part of your CI/CD/GitOps workflows.
The Monokle Github App/Bot integrates policy enforcement into your GitHub pull request and build workflows.
The Admission Controller enforces Monokle policies in your clusters, ensuring that no misconfigurations slip through the cracks on their way to deployment.
All these tools can be run either standalone or integrated with Monokle Cloud to ensure that the same policies are enforced across all your teams and workflows.
Centralized Policy Management
While all the above-mentioned tools can be used standalone, tying them together into a coherent policy platform with Monokle Cloud is where you can make big gains in the consistent use of policies across your development workflows. Not only does Monokle Cloud allow you to quickly define, manage and distribute policies across your projects, repositories and clusters, but it also provides a browser-based IDE and a wealth of advanced features to help you make the most of your policies going forward.
Configuration IDEs to Save You Time
Monokle includes both browser and desktop versions of a configuration-focused IDE, with a wealth of features geared toward misconfiguration detection and remediation, including:
Hot fixes – one-click action to fix common misconfiguration errors (Monokle Cloud).
Real-time policy development – develop ValidatingAdmissionPolicies and see their impact in real time.
Dry-runs – perform dry-runs of Kustomize overlays and Helm charts to validate their output and compare them to deployed applications.
Cluster inspection – Inspect your clusters for misconfiguration and fix them in real time if needed (Monokle Desktop).
And much more.
Policy Powers at Your Fingertips
Although Monokle strives to make basic policy-related tasks easy, it also understands and embraces more advanced needs and workflows related to policy management in a complex and evolving application infrastructure.
Suppressions
It is a common need to be able to suppress individual rules for specific resources, for example, certain pods might need to be able to act as root or access the file system of their container to do their work. Monokle Cloud provides a point-and-click approach to suppressing desired misconfigurations, including an approval-based workflow where administrators can ensure that only authorized suppressions are allowed.
Custom Validators
If the built-in rule library isn’t enough you can, of course, craft your own validator plugins using Monokles plugin-development tooling. For example if you might want to enforce conventions for custom resource definitions (CRDs) being used in your application infrastructure. When installed in Monokle Cloud, custom validation plugins are automatically distributed to all aforementioned enforcement-points (VS Code, CLI, cluster), making it easy to ensure that everyone is using the right version of custom validation plugins and their corresponding rules.
Validation Insights
Tracking misconfigurations over time in your git repositories helps you both detect unexpected diversions from a steady path to zero misconfigurations and keep track of your team’s progress in improving the quality of your YAML configurations.
Policy Composition
When applying policies to different runtime namespaces/clusters it’s common to need to enforce a “base policy” across all and then overlay namespace/cluster-specific policies. Monokle allows you to achieve this, either manually or by the point-and-click interface available in Monokle Cloud, making advanced policy enforcement scenarios both possible and easy to put in place.
Helm/Kustomize Dry-Run Validations
Using a tool like Helm or Kustomize to template and generate large sets of Kubernetes resources is a common approach to scaling application configurations to different environments with different requirements. Just as applying policies to vanilla YAML configurations, Monokle allows you to validate the output of these tools as part of your local or CI/CD workflows, ensuring that the generated manifests comply with your policies before they get committed to source control or deployed to your clusters.
Embracing Open Source
All Monokle enforcement-point tooling and the core validation plugin framework are open source, MIT licensed and available on GitHub. Using these tools separately without the centralized policy management and extra features provided by Monokle Cloud is a great way to “kick the tires” of the Monokle validation engine and ecosystem before tying them into a coherent solution with Monokle Cloud to roll out across your organization.
Is Monokle for You?
There is one way to find out: Give it a try!
Sign in to Monokle Cloud to try the Policy Management functionality and Cloud IDE.
Most parents yell at their kids from time to time. Sometimes it’s out of frustration, and sometimes it’s instinctual in the moment to keep them from harming themselves or someone else. But at the heart of it, yelling is about control, and it can be exhausting—not just for you but also for your kids. It can also scare…
Bitwarden is one of the best password managers on the market. Not only does it include features that make it perfectly at home with teams and organizations, but you can also deploy your own instance of the tool, so you never have to worry about your company’s most sensitive data ever being synced, shared, or saved on a third-party server. This is a great option for businesses that work with highly sensitive account details, notes, and identities.
And, thanks to Docker, the process of deploying Bitwarden in-house is actually pretty easy. I’m going to walk you through the steps, so you can use this password manager service within your LAN. You can deploy it to a single machine in your data center or even a VM hosted on a third-party cloud-based service.
What You’ll Need
Here’s what you’ll need to make this work:
A running instance of an operating system that supports Docker (I’ll demonstrate this on Ubuntu Server 22.04).
A user with sudo privileges.
An SMTP server (I’ll demonstrate using the Gmail SMTP service).
That’s it. Let’s get to work.
How to Install Docker CE
On the off-chance you haven’t installed Docker, here are the steps for doing so.
First, add the official Docker GPG key with the command:
Once that downloads, run the install command with:
./bitwarden.sh install
During the installation, you’ll be asked the following questions:
Enter the domain name for your Bitwarden instance — if you don’t have a domain, you can use the IP address of your hosting server.
Do you want to use Let’s Encrypt to generate a free SSL certificate? (y/n) — if you don’t have a domain associated with this server, you must select n.
Enter your installation id — this is accessed by visiting https://bitwarden.com/host
Enter your installation key — this key will be presented on the same page as the installation id.
Do you have an SSL certificate to use? (y/n) — if you have an SSL certificate, type y, otherwise type n.
Do you want to generate a self-signed SSL certificate? (y/n) — if you don’t have an SSL certificate, answer y.
It is absolutely crucial that you use an SSL certificate, otherwise, you will not be able to create an account or use a number of the Bitwarden features.
Once the installation completes, you’ll need to configure the environment variables for the SMTP server. If you use the Gmail SMTP servers and you have 2FA enabled for your account, you’ll need to create an app password, which can be done here.
Configure the SMTP Server
To configure the SMTP server, open the global env file with the command:
If you’re using the Gmail SMTP servers, change everything marked REPLACE to:
Replace replyTo_email with your email address.
Replace smtp__host with smtp.gmail.com.
Replace smtp__username with your Gmail address.
Replace smtp__password with the app password you generated.
If you’re using a different SMTP server, make sure to configure it as necessary.
Save and close the file.
Restart the Bitwarden instance with:
./bitwarden.sh restart
Once the Bitwarden service has restarted, open a web browser and point it to https://SERVER (where SERVER is the IP address or domain of your hosting server). You will be greeted by the Bitwarden login screen (Figure 1).
Figure 1: The Bitwarden login screen.
Click Create Account and, in the resulting window (Figure 2), fill out the necessary information for the new account and click Create Account.
Figure 2: Creating a new account for your Bitwarden in-house instance.
You will then be kicked back to the login screen, where you can log in with your new account. In the resulting window (Figure 3), click Send Email in the Verify Email box. You’ll be sent an email where you can then verify the new account.
Figure 3: The main Bitwarden window, showing the need to verify the initial account.
And that’s all there is to deploy an on-premises instance of the Bitwarden password manager server. Enjoy that added level of privacy for your most important secrets.
Large language models continue to colonize the technology landscape. They’ve broken out of the AI category, and now are showing up in security, programming, and even the web. That’s a natural progression, and not something we should be afraid of: they’re not coming for our jobs. But they are remaking the technology industry.
One part of this remaking is the proliferation of “small” large language models. We’ve noted the appearance of llama.cpp, Alpaca, Vicuna, Dolly 2.0, Koala, and a few others. But that’s just the tip of the iceberg. Small LLMs are appearing every day, and some will even run in a web browser. This trend promises to be even more important than the rise of the “large” LLMs, like GPT-4. Only a few organizations can build, train, and run the large LLMs. But almost anyone can train a small LLM that will run on a well-equipped laptop or desktop.
AI
NVidia has announced Nemo Guardrails, a product whose purpose is to keep Large Language Models operating safely. It prevents LLMs from straying off-topic and answering questions that it is not allowed to answer, checks facts (using other LLMs), and only allows it to access third-party applications known to be safe.
QuiLLMan is an open source voice chat. It uses the Vicuna-13B model, with OpenAI Whisper to transcribe the user’s audio, and Metavoice Tortoise to convert the response back to spoken audio.
The RedPajama project intends to create a fully open source large language model. The first step in this process is the release of a 1.2 trillion token dataset for training.
AI does fashion: Researchers (in Italy, where else?) have developed a Multimodal Garment Designer that uses diffusion models to create realistic images of humans wearing clothes described in prompts.
We talk casually about prompt engineering; Mitchell Hashimoto (founder of Hashicorp) discusses what it means for prompt engineering to be a real engineering discipline.
WasmGPT provides yet another way to run a ChatGPT-like AI chatbot in the browser, this time with WebAssembly. It uses a version of the Cerebras-GPT-1.3B model. Although it is very prone to hallucination, it demonstrates what can be done with WASM and without exotic hardware.
Stability.ai, the creator of Stable Diffusion, has just announced a new large language model, StableLM. The model is open source, and can be used in commercial applications. It was trained with a new dataset, based on The Pile but much larger.
LLaVA (Large Language and Vision Assistant) is a new multimodal language model that allows you to upload images and ask questions about them.
Just as there are techniques for training specialized LLMs, it’s possible to train specialized diffusion models for image generation. Dreambooth is one practical technique for personalizing diffusion models.
GPT-4’s image capabilities are still disabled. A research group has created MiniGPT-4, which allows users to upload and chat about images. It is based on Vicuna, so it can (probably) run on a well-equipped laptop or desktop.
Web LLM is a project that runs the Vicuna 7B large language model entirely in the Chrome browser, using the WebGPU (in the current Chrome beta). Its performance is surprisingly good.
AWS has released its own large language model called Titan, plus a new service for training and deploying LLMs called Bedrock. Their goal is to help users develop their own chatbots, which will presumably run on AWS.
What’s beyond ChatGPT? AutoGPT means the creation of ChatGPT agents that execute tasks for the user without intervention. These tasks typically include additional ChatGPT requests, with automatically generated prompts.
Databricks has released Dolly 2.0, a 12B parameter model that is entirely open source and has been trained with data that is independent of the GPT models (unlike Alpaca and other small LLMs). The model and its training data are available on GitHub and HuggingFace.
One of GPT-4’s plugins is a sandbox that allows it to run Python programs. GPT-3.5 and 4 frequently wrote programs, but could only “guess” about their output. This could be a big step forward in GPT-4’s accuracy, at least for programming tasks.
Alibaba has announced that it will roll out a ChatGPT-like bot, named Tongyi Qianwen. It plans to integrate the bot into all of its products, starting with Alibaba’s workplace messaging app.
Facebook has developed SAM, a universal segmentation model that can detect and mark all of the individual objects in an image. Natural language prompts specify which objects in an image you want to isolate.
Generative agents use large language models and other generative AI tools to simulate human behavior. In a simulation which was prompted only by a suggestion that the agents throw a party, they planned, sent invitations, made acquaintances, and executed many other human behaviors.
We are experiencing a proliferation of small large language models: based on Meta’s LLaMA with 6B to 13B parameters and capable of running on a well-equipped laptop or desktop with GPU, with additional training based on prompt/response pairs from ChatGPT. The latest are Vicuna and Koala; there will no doubt be others.
On at least three occasions, Samsung employees have inadvertently disclosed technology secrets by using ChatGPT. Their prompts and ChatGPT’s responses were incorporated into ChatGPT’s language model, from which they leaked to the outside world.
Researchers have created a new AI architecture that combines neural networks with symbolic models in a way that overcomes the limitations of both.
The generative art application Midjourney appears to have temporarily suspended its free trial accounts program in response to deep fakes that have been generated on the platform. Free trials have been suspended until the next “improvement to the system” has been deployed.
Programming
Pushup is a new web framework for Go. It is an “opinionated” template-based framework in the style of Ruby on Rails or Django. Ignore the ill-informed Java bashing; the framework looks like it’s worth investigating.
Docs-as-Code: Etsy has built tools to make the development of documentation as rigorous and maintainable as the development of code, integrating documentation into their development and deployment pipelines.
AWS has opened up CodeWhisperer, a competitor to GitHub Copilot, for use. It is free for personal use.
According to a survey, Kubernetes deployments are trending towards “Managed Kubernetes,” in which responsibility for running Kubernetes is delegated to another company, typically a cloud vendor.
FerretDB is a new open source database that’s an alternative to MongoDB. Because it uses the Server Side Public License (SSPL), MongoDB can no longer be considered open source.
An important report highlights the security risks of AI systems. AI has all the vulnerabilities of traditional software, in addition to its own; and while it isn’t yet an attack vector of choice, attacks have been seen in the wild, and will no doubt proliferate as AI is deployed more widely.
There are many ways to get cryptography wrong—and the problems are a lot more subtle than “don’t implement cryptographic algorithms yourself.” Here’s a post on Cyptographic Best Practices that shows how to get it right.
A new prompt injection attack allows an attacker to steal chat data by tricking the user into copying and pasting a prompt into ChatGPT.
SAP has created a Risk Explorer that can help users evaluate the risks in their software supply chains. It’s a hierarchy of known attacks, with explanations, that can be explored through a graphical interface.
PassGAN is an AI-based password cracking tool. Despite fear-mongering hype, it is not better than brute force methods. More important, its developers are recommending that users change their passwords every 3 to 6 months, a change that makes sites more vulnerable, and that goes against recommendations from NIST, the FTC, Microsoft, and others.
An attack against most modern cars requires hijacking the CAN bus (Controller Area Network), which connects all of a car’s systems. It requires some vandalism; on a locked car, the easiest way to access the CAN bus is through the headlights. The attack has been seen in the wild.
Workload Security Rings are a new approach to isolating workloads based on their security requirements while minimizing compromises to efficiency. Workloads fall into one of three classes: sensitive, hardened, and trusted.
The FBI has shut down Genesis Market, an online store for stolen data and malware.
A research project at CMU installed hundreds of networked sensors, including microphones, throughout a new CS department building. This installation has created a significant controversy about the meaning and future of privacy.
Fake Ransomware sounds like an April Fool’s joke, but it’s real. Some threat actors threaten to sell or reveal stolen data, without having actually obtained the data. It’s a weird kind of phishing, and surprisingly effective.
Security Copilot is a chat assistant to help IT staff with incident response. It is based on GPT-4, with an additional model integrating data from Microsoft’s knowledge of security incidents.
Web
Consent-O-Matic is a browser plugin that automatically fills in annoying cookie popups in a way that maximizes privacy. It is available from browsers’ web stores; source code is in GitHub.
Google’s Environmental Insights Explorer provides access to data about the environment and sustainability for over 40,000 cities worldwide.
Perseus is a new high performance Web framework for Rust. It runs on WebAssembly.
WebGPU is shipping in Chrome 113 (currently in Beta), and development is in progress for Firefox and Safari. WebGPU is a JavaScript standard for interacting with GPUs and other advanced graphics hardware from the browser.
Salesforce has created a platform that allows companies to create NFT-based customer loyalty programs. These programs give companies direct access to customer data, eliminating the need to work within restrictions on the use of cookies. Are crypto wallets the new cookies?
Is privacy possible in virtual reality? Probably not. So much relies on motion, and motion is identifiable. Headsets leave a trail of data that will be very hard to anonymize.
Augmented reality isn’t dead. Snap is launching AR “mirrors” for stores that show customers what they will look like wearing clothes without trying them on.
Enlarge / An AI-generated and human composited image of "Wolverine programming on a computer." (credit: Benj Edwards / Midjourney)
Debugging a faulty program can be frustrating, so why not let AI do it for you? That's what a developer that goes by "BioBootloader" did by creating Wolverine, a program that can give Python programs "regenerative healing abilities," reports Hackaday. (Yep, just like the Marvel superhero.)
"Run your scripts with it and when they crash, GPT-4 edits them and explains what went wrong," wrote BioBootloader in a tweet that accompanied a demonstration video. "Even if you have many bugs it'll repeatedly rerun until everything is fixed."
GPT-4 is a multimodal AI language model created by OpenAI and released in March, available to ChatGPT Plus subscribers and in API form to beta testers. It uses its "knowledge" about billions of documents, books, and websites scraped from the web to perform text-processing tasks such as composition, language translation, and programming.
Along with global satellite provider Lynk, 2degrees has announced a trial of technology that enables customers to connect from areas outside of terrestrial mobile coverage - bringing 2degrees closer to providing mobile connectivity everywhere in New Zealand.
We often write quick bash scripts and judging by the comments, half of us use bash or a similar shell to pop out quick, useful scripts, and half of us think that’s an abomination, and you should only use bash for your command line and resort to something more like a traditional language to do anything else. If you’re in the former camp, you’re probably cursing your allegiance when you need to make your bash scripts more interactive.
Gum can help. It’s a utility that can handle your script input and output with a little flair while requiring almost no effort on your part.
The command looks simple, but it has twelve subcommands, each with myriad options. But you can break down the functions into a few simple categories. The input commands let you prompt for a line of input or a bunch of lines of input. You can also create a pick list or a yes/no type of prompt. There’s also a file picker and a filter, sort of like fzf.
The output commands let you display markdown, code, and tables. You can make output look nice with borders and colors. There’s a pager for lengthy output and a spinner for showing that something is happening. You can also use template strings with different placeholders.
In Practice
The gum demo file in action
Perhaps the best way to see the kinds of things that gum can do is to watch the little animated demo from the project page and read the associated source code.
Everything is a subcommand of the main gum executable: choose, confirm, file, filter, format, input, join, pager, spin, style, table, and write. You can guess what most of these do, but a few are less obvious. Running gum by itself will give you a little reminder:
Commands:
choose Choose an option from a list of choices
confirm Ask a user to confirm an action
file Pick a file from a folder
filter Filter items from a list
format Format a string using a template
input Prompt for some input
join Join text vertically or horizontally
pager Scroll through a file
spin Display spinner while running a command
style Apply coloring, borders, spacing to text
table Render a table of data
write Prompt for long-form text
You can get more help by picking a command and adding –help. The join command glues text together with alignment and works even if the text has more than one line. The write command accepts multiline input. One of the examples, for instance, uses it to gather a Git commit message.
If you browse the script, you might note that you can use HTML-style color numbers like:
echo "Do you like $(gum style -- foreground "#04b575" "Bubble Gum?")"
Note that any leading zeros are not optional. As far as I can tell, though, it doesn’t accept named colors, which would be handy. Of course, you could always do something like:
According to the project’s GitHub page, many distributions already know about gum, so you can install it using your normal package manager. I used Neon, so I had to follow the Debian instructions to get it, but that’s not hard to do at all. You can also download prebuilt binaries or packages. The program is written in go, so you can use go to install it, also.
A More Practical Example
One of my favorite ways to exercise a new language is to write a simple program to have the computer guess your number in a high-low game using a binary search algorithm. If the number you pick is between 1 and 1000, the program will guess 500. If you tell the computer that the number is too high, it will guess 250 next time. If 500 was too low, it would guess 750. You get the idea.
Try it out. For a shell script, it is reasonably attractive, and I’m not known for my aesthetic design sensibilities. I’m sure you can do better, but the point is the tools made it relatively painless to create the prompts and the nicely-formatted output. I didn’t even scratch the ability to handle markdown or tables. You will notice, though, that something seems to have broken recently with the syntax coloring of source files.
Walk and Chew Gum
We like how easy gum is to use. We did notice a few oddities. Bold text didn’t work in Konsole, at least not the way ours is set up, since the “intense” foreground color was set to be the same as the normal color. That isn’t really gum’s fault, but it does mean you can’t depend on the user having a configuration that will show all of your pretty layouts.
The format subcommand has a readme file in its subdirectory. (It is the only one, by the way.) In it, you’ll find some tidbits that might help. For example, formatting markdown, code, and emojis are actually done by something called Glamour, so reading its documentation might be helpful. Chroma ultimately handles the source code formatting. In particular, until we read through the Chroma docs, we were unsure how code formatting identified languages or which ones might be supported. Reading about Glamour and Lipgloss will help explain the themes, joining, and colors, too. Doesn’t hurt to read some of the go code, too.
Still, with a light learning curve, you can create or refit scripts to be more user-friendly and appealing quickly, even if they aren’t going to run under a GUI. In the examples directory, you can even see how to embed gum inside things like Python or Ruby.
Sure, there are tools like dialog, and for more advanced scripts, you might need that. But for a quick one-off that just needs a little pizazz, think about gum. If you are going to write serious bash, think about some of the gotchas. You might even consider running through shell check as opposed to spell check.
We can illustrate this by comparing how people react to an
upcoming talk by a speaker they disagree with. High-rung thinkers
find a lot of value in having their beliefs challenged. Low-rung
thinkers, not so much. But only the idea supremacist tries to
cancel the event.
Low-rung thinkers may not be great at learning, but as long as
they don’t prevent others from learning, it’s fine. Even the
social bully is fine — they only hurt people who choose to be
their friend.
But idea supremacy is a direct affront to the workings of a
liberal society.
A short thread, but a good one. If you refuse to listen to people you disagree with, let alone try to prevent them from even speaking, how do you even know you disagree with them? Perhaps because I was young at the time, I often think back to Bob Dole’s “nightmares of depravity” broadside against popular movies and music in 1995, when he began his campaign for president:
Natural Born Killers, the story of a couple on a killing spree
as they cross the country, was one example of films and
recordings cited by Mr. Dole as “nightmares of depravity” for
their depictions of gratuitous sex and violence. He also attacked
the film True Romance and the rap groups Cannibal Corpse, Geto
Boys and 2 Live Crew. Aides to Mr. Dole said he had not seen the
movies he cited but had read about them and had also read
offending rap lyrics.
The thing that got me then and still gets me now is that Dole had not seen the movies. Railing against a movie you haven’t seen is more offensive to me than the actual contents of any movie could be.
Candidates supported by Morocco-backed group fail to win a single seat on Executive Council
Candidates advocating for a major overhaul of the Asia Pacific Network Information Centre (APNIC) have failed to win any of the four seats available on the organization's Executive Council, and current members are welcoming changes aimed at preventing future attempts to stack the board.…
The BBC reports:
It was an innocuous-looking photograph that turned out to be the downfall of Zheng Xiaoqing, a former employee with energy conglomerate General Electric Power. According to a Department of Justice indictment, the US citizen hid confidential files stolen from his employers in the binary code of a digital photograph of a sunset, which Mr Zheng then mailed to himself. It was a technique called steganography, a means of hiding a data file within the code of another data file. Mr Zheng utilised it on multiple occasions to take sensitive files from GE....
The information Zheng stole was related to the design and manufacture of gas and steam turbines, including turbine blades and turbine seals. Considered to be worth millions, it was sent to his accomplice in China. It would ultimately benefit the Chinese government, as well as China-based companies and universities. Zheng was sentenced to two years in prison earlier this month. It is the latest in a series of similar cases prosecuted by US authorities. In November Chinese national Xu Yanjun, said to be a career spy, was sentenced to 20 years in prison for plotting to steal trade secrets from several US aviation and aerospace companies — including GE.
It is part of a broader struggle as China strives to gain technological knowhow to power its economy and its challenge to the geopolitical order, while the US does its best to prevent a serious competitor to American power from emerging.... Last July FBI director Christopher Wray told a gathering of business leaders and academics in London that China aimed to "ransack" the intellectual property of Western companies so it can speed up its own industrial development and eventually dominate key industries. He warned that it was snooping on companies everywhere "from big cities to small towns — from Fortune 100s to start-ups, folks that focus on everything from aviation, to AI, to pharma".
At the time, China's then foreign ministry spokesman Zhao Lijian said Mr Wray was "smearing China" and had a "Cold War mentality".
Thanks to long-time Slashdot reader schwit1 for sharing the article.
Many people have pointed out that there are a handful of commands that are overwhelmingly run by attackers on compromised hosts (and seldom ever by regular users/usage). Reliably alerting when a user on your code-sign server runs whoami.exe can mean the difference between catching a compromise in week-1 (before the attackers dig in) and learning about the attack on CNN.
Introducing our new Sensitive Command Canarytoken.
This quick/simple Canarytoken alerts you any time your chosen command is executed on a host.
For example: This token creates registry keys to alert you anytime whoami.exe runs on a host.
If an attacker lands on the server and runs whoami.exe (as most attackers almost instinctively do) they get the results they expect.
And you get an alert to let you know that something bad is afoot.
Why this token?
In nearly every ransomware report, we can see attackers running a series of predictable commands on endpoints.
Some of those commands are almost never run by regular users through regular usage. This means that they become high quality markers of “badness”.
Wouldn’t it be great to get an alert the moment someone runs WMIC on your code-signing server? Or the moment someone runs whoami.exe on your SQL-Server? Many organizations will use EDR (Endpoint Detection and Response) tools to do this. However these complex telemetry streams, and detection logic may not be available to small organizations, may not be comprehensively deployed and often require specific configuration changes to alert on these invocations.
We want to know, and we want the setup to be dead-simple.
tl;dr - Just show me the token
If you visit https://canarytokens.org and view the list of available tokens, you will notice a new Canarytoken type: “Sensitive command token”
Choose the Sensitive command token.
Next, like other Canarytoken configurations, we add some quick details:
[1] Where to send the alert, (email or webhook, or both);
[2] A reminder note, that will help you react when you receive an alert from this token;
[3] Choose the process that you want to monitor execution for (e.g., wmic.exe, whoami.exe, klist.exe, nltest.exe).
The Canarytoken server will create a .reg file for you to download and import onto a Windows 10, or Windows 11 system (or use GPO to deploy across multiple systems).
Once you have downloaded the .reg file, you can import this to the system (or systems) you want to monitor.
reg import <path\filename.reg>
Remember this will require local Administrator permissions.
That's it! If a user on this host ever runs that (sensitive) command, you will receive an alert!
It's worth noting that this Canarytoken does not impede or alter the original command in any way, it simply sends you a near real-time alert that someone has executed our tripwire.
In the alert you will see the details of the time of the alert, the user that executed the command, and the computer name the command was executed from.
Note:
A subtle benefit of how this token is designed allows you to deploy the same token on multiple machines without making any changes. Running reg import across a host of machines will tripwire them all, and when an attacker runs her command on any one of them, you will know.
There you go!
We can now create a Canarytoken to alert us on Sensitive Commands that execute.
These commands may be sensitive due to the fact that they are rare, used by attackers, or are sensitive to your organization. How you choose to pick the executable is up to you.
Bonus: the executable does not need to be present on the system. Suppose your organization never uses adfind.exe. You could add this tripwire, so that if someone ever downloaded that to your system and executed it you would be notified.
Additionally you sometimes don't want to run AV/EDR on some machines, or 3rd party systems that won’t allow you to install software, but here you can monitor an executable or five.
That is all you need to get started using this new Canarytoken. If you would like to learn more about the architecture and mechanics under the hood: continue reading.
Under the hood
Problem Statement:
We wanted to see if we could find a way to generate an alert to our console when a suspicious command is executed on a system. Without interfering with the original command execution.
The best candidate command for this alert is one that is rare, short lived, and used by attackers.
In short, if you want to receive an alert if someone runs wmic.exe on a workstation, this may be the Canarytoken for you. This token creates a .reg file with three registry entries that you can import to the system. You will need Windows 10 or 11, and Administrator access to the systems you want to add this to.
Token Architecture:
Our team spent a number of cycles trying various experiments and approaches to generating an alert based on process execution. From doskey, to wmi, to performance monitoring. We settled on an older Pentesting Persistence trick that in the end met all our requirements.
In his blog post on "PERSISTENCE USING GLOBALFLAGS IN IMAGE FILE EXECUTION OPTIONS", Oddvar details how to persist in the registry and execute a command on a Windows system that runs in the background. This technique meets our requirements exactly. We needed a tripwire that would run in the background, not interfere with the original process, and allow us to make a custom callback/alert over DNS to alert a system administrator, or security team, that a suspicious command had been executed on the system.
(We have also seen a debugger variation of this technique used by high profile attacks as well.)
“The attackers achieved this by having the SolarWinds process create an Image File Execution Options”
We will repurpose the mechanics of this attacker technique and turn it into a defender tripwire!
Oddvar demonstrated his technique to establish persistence and run an arbitrary executable, we will use it to reliably generate a remote alert.
This Canarytoken does not add any new executable to your system thanks to the wonders of Oddvar’s technique, built-in tools and the Canarytoken server. We will be using Microsoft's built-in SilentProcessExit monitoring, documented here:
The specific registry settings we are interested in:
Image File Execution Options\{ProcessName}
SilentProcessExit\
MonitorProcess
ReportingMode
You will see in the registry output above, we set this to the value 0x200. You may need to ensure that the process you wish to monitor isn’t impacted by this setting.
Next we set the ReportingMode to 0x1.
“When silent exit is detected, the monitor process (specified in the Monitor Process box) is launched.”
The bulk of the work for this alert is what we configure in the MonitorProcess value.
Let’s break down the command to trigger this alert:
The various \\\ sequences are to ensure proper escaping for both the command to run and to import into the registry.
First we call “cmd.exe /c start /min”. We do this as a trick to make the execution of our alert appear to run in the background. Even when we set -windowstyle hidden, with PowerShell, a window would appear, briefly but this wasn’t acceptable to our goals. We also added some code to remove the non-unicode characters and to remove spaces. To ensure the alert data can be passed over a DNS query.
Next we run a PowerShell command to resolve our Canarytoken DNS.
We can leverage our ability to encode data into the DNS request. This is documented here
Our lookup captures computername.username.token. Why PowerShell? We had some interesting collisions with trying to use the %computername% environment variable in say an nslookup command, due to the fact that MonitorProcess parses the registry key and uses the %c to report a status code. So after a few iterations, and experiment we found PowerShell the easiest way to collect the variables we need and add them into the alert.
Risks/challenges/considerations.
Installing the .reg file requires admin privileges;
Selecting the wrong "sensitive executable" will yield false-positive alerts;
Hostname and Username are sent in clear-text in the alert;
Process level alert: we only see that the process was executed, this approach does not give us command line granularity;
These commands may, upon installation, look like attacker commands . Not the alert itself, but the installation, this is due to the fact we are repurposing an attacker trick;
This alerts on all executable matches for the filename. If you need further refinement, you can customize this by setting the FilterFullPath registry key;
Image Architecture, these keys were tested for x64. You may need to customize the settings if you are hoping to alert on x86/32 bit execution. C:\Windows\SysWOW64\whoami.exe may evade the alert. Again, something to be aware of if you are looking into these for critical areas;
This alert won’t catch a renamed binary since the alert triggers on the process name.
For example, our Canarytoken alert won’t fire if the binary has been renamed, but that is ok. If you need a tool that alerts on Process Execution, by OriginalFilename, Location and Command Lines, there are several to choose from. We just wanted to call that out, so you are aware of some of the limitations of these types of alerts.
We do also see utility for teams to set tripwires for executables they never wish to see executing. Suppose we want to set a tripwire for mimikatz.exe. We can create the registry key, even though mimikatz.exe is not present on the system. Then if anyone ever executes a file with that name, we will receive an alert! You may also extend this to internal tools or executables as well.
Choosing a binary to monitor:
Candidate sensitive commands:
Short lived, exits quickly
Low frequency
Low execution prevalence
Indicative of suspicious or unusual activity.
Each organization will need to look at command frequency, look into various threat reports and make that decision. If you need to disable a Canarytoken like this, you could for example set the Image File Execution Options \GlobalFlags value to 0x0, then set it back to 0x200 if need be.
For example: We’ve seen in nearly all ransomware attacks, schtasks.exe be leveraged. This binary at first blush seems like the ideal candidate to token but it turns out that schtasks runs frequently in the background, so it doesn’t meet the candidate criteria of Low frequency.
Additionally Windows will create an event in the Application log when these events occur. These may allow teams further investigation data. The only requirement to record these events is that the Image File Execution Options\{ProcessName}\ GlobalFlags key be set to 0x200.
For those interested in additional details, you will also see the EventID 3000 in the Windows EventLogs to indicate Process Exit Monitor has occurred. Teams that are interested in a lightweight process monitoring record. Can simply create and set a GlobalFlags == 0x200 , and they can observe over time whether or not the process is frequent or not. Also they can determine if the process runs and ends quickly. This may also be a good Indicator of Compromise , for teams not expecting to see a particular process with this flag set.
As an example you can see below a quick way to search for these events and extract the Usernames.
We looked at creating a new Canarytoken type that allows us to receive an alert when we specify an executable name that we want to watch for. We can do this by adding three registry keys and a PowerShell command to trigger a DNS lookup for us. We overload the DNS request with sufficient data to generate a meaningful alert for defenders. (We wrap all of this up in one simple .reg file import).
We discussed some of the advantages and disadvantages of this approach. We are able to do this by leveraging the alert pipeline that you have, perhaps already used. If you would like to customize these tokens you certainly can too (and you can always run your own custom version of the free Canarytoken server. See the GitHub repo here https://github.com/thinkst/canarytokens).
Thank you for taking the time to read, and we welcome feedback on ways to improve and refine this new Sensitive command Canarytoken. Thanks again to the Applied Research team at Thinkst for all the testing and feedback to help us bring an idea forward that may prove helpful.
It doesn’t happen often, but every once in a while we stumble upon someone who has taken obsolete but really cool phone-switching equipment and built a private switched telephone in their garage or basement using it. This private analog phone exchange is not one of those, but it’s still a super cool build that’s probably about as ambitious as getting an old step-by-step or crossbar switch running.
Right up front, we’ll stipulate that there’s absolutely no practical reason to do something like this. And hacker [Jon Petter Skagmo] admits that this is very much a “because I can” project. The idea is to support a bunch of old landline phones distributed around the house, and beyond, in a sort of glorified intercom system. The private exchange is entirely scratch-built, with a PIC32 acting as the heart of the system, performing such tasks as DTMF decoding, generating ring voltage, and even providing a CAN bus interface to his home automation system.
The main board supports five line interface daughterboards, which connect each phone to the switch via an RJ11 jack. The interface does the work of detecting when a phone goes off-hook, and does the actual connection between any two phones. A separate, special interface card provides an auto-patch capability using an RDA1846S RF transceiver module; with it, [Jon Petter] can connect to any phone in the system from a UHF handy-talkie. Check out the video below for more on that — it’s pretty neat!
We just love everything about this overengineered project — it’s clearly a labor of love, and the fit and finish really reflect that. And even though it’s not strictly old school, POTS projects like this always put us in the mood to watch the “Speedy Cutover” video one more time.
This is the second in a three-part series on continuous security.
In our previous post we outlined Jit’s philosophy behind continuous security, and how elite and modern engineering teams who will embrace this approach will actually increase velocity despite common misconceptions around security bogging down engineering.
Security is here to stay and needs to be embedded early. We’ve learned this from “shift left,” which is already proving to not be early enough, and born-left security is now an emerging practice — embedding security as early as the first line of code.
However, applying this in practice requires some realignment of process and practice. By identifying fixes that can be made immediately and prioritizing the rest, we can then create a good framework and baseline security posture to maintain and improve.
When we talk about continuous security, it also consists of a few pillars that will help bring security closer to engineering practices and unleash the true potential of developer-owned security.
These pillars include:
Security as Code (SaC): Embedding security as code through code-driven plans aligned with industry and custom security frameworks
Security orchestration: Orchestrating the processes and workflows around embedding security, including the automation, tooling and remediation
Continuous monitoring: Having the tools and processes in place to continuously monitor that we are maintaining our security posture and ultimately improving it
Security Needs a Fix-First Mindset
We spoke about this briefly in our previous post, but to unpack this more deeply, let’s take a look at what elite engineering looks like, and what security can take from this approach. When we talk about the metrics that quantify elite engineering, there are two primary categories DORA looks at: speed and safety.
With the continued evolution of the attack surface and sophistication of exploits as the stakes get higher with each breach, safety must stop being an afterthought in engineering. While this is usually quantified in metrics such as change failure rate (CFR) and mean time to restore (MTTR), another extremely important focus gaining more and more centrality in engineering processes is security risk management.
But this begs the question: Why hasn’t security been a native citizen in development processes until now despite all of the efforts to shift it left and farther left, and even make it born left.
This is because of the entire mindset of security is issue-driven, versus the engineering mindset is fix-driven.
Jit is a self-serve DevSecOps orchestration platform that makes it easy for high-velocity engineering teams, of any size, to achieve continuous security & compliance while increasing dev velocity. Jit implements security-as-code and offers remediation recipes with a Dev-native experience. Jit and TNS are under common control.
Learn More
The latest from Jit
Let’s take a look at the DORA safety metrics, that are measured in CFR and MTTR. Even if you have introduced failure into your systems (where CFR measures how often this even happens), MTTR measures how quickly you can introduce the fix and restore your systems, which are largely regarded as metrics that define elite engineering teams. However, security tools today only introduce noise with the many issues they flag, and very few tools take a fix-first approach.
The most common OSS tools in use today are laser-focused on detection and much less on remediation. Even those that provide guidance for how to fix the issue, rarely point you to the exact line of code to fix.
Engineering teams focused on high velocity aren’t interested in what is wrong. They’re interested in how to fix it when it has gone wrong (they’ll reserve the “what happened” for the post-mortem or the sprint retrospective). Resolving the issue becomes the highest value in software delivery.
DevOps and automation have introduced best practices and eventually even playbooks that can be automated with the most common failures.
If we start with the first pillar of continuous security, security as code (SaC) is aligned with developer workflows and provides fixes to known problems throughout the coding process. Even more importantly, it also provides extensibility since security is codified and therefore programmable, which ultimately allows people to manage their own custom risks and processes.
Security orchestration is achieved by evolving remediation processes to be more automated, batch-oriented and simpler. Finally, continuous monitoring serves to ensure no new threats are introduced, and those emerging threats in running services are rapidly caught and mitigated.
While the fix-first mindset enables us to not introduce new issues, this doesn’t negate the specific effort and resources you should dedicate to continuously reduce your security debt of existing critical issues. Which is the orchestration part of it.
By aggregating similar issues and processing them as a batch, you can achieve greater security efficiency and minimize your backlog more rapidly (many security products now take this approach.). Continuous monitoring and security orchestration go hand in hand, as once you are aware of existing problems and discover production issues, a good automation process will help mitigate these risks more rapidly than former processes.
This is similar to fixing a breach in a boat. You start by making sure to fix the hole before removing the water. Once you can nail down the mechanism for fixing new issues as they come up and instill a fix-first mindset, it is then possible to decouple this from the effort of fixing existing problems and automating this process as well.
Yet, this is basically where security fails. A laundry list of vulnerabilities simply doesn’t do the job any longer.
While visibility and observability are the first steps to fixing failure, understanding how to actually follow through and fix issues rapidly will be the true measure of making security a first-class citizen in engineering and delivery, and then automating what’s possible and prioritizing the rest.
Great, so how’s that done?
Embedding the Security Fix-First Mindset
Once we understand this fundamental mind shift, we can reverse engineer how to go about applying a fix-first approach to security for modern engineering processes — where the primary goal is to ship code to production as rapidly as possible with security already embedded.
In our previous post, we discussed the three core pieces to making this possible: differentiation, prioritization and remediation. Below we’ll take a deep dive on how to apply this in your engineering practices right away.
In-Code Security
Let’s talk about current security gating and where this can be optimized, automated or moved to the backlog when necessary. When we talk about continuous integration and deployment, the typical diagram includes Build >> Test >> Release >> Deploy.
To this, over the years, we’ve added layers for pre-coding, coding and post-deployment — so this now looks like: Plan >> Code >> Build >> Test >> Release >> Deploy >> Run / Operate
To each one of these phases we have tried to embed security as seamlessly as possible, and this has had some successes and some failures.
One of the great successes of the DevSecOps approach was embedding security checks in a way that is code-centric, and in a place that in any case has other gates, during the pull request (PR) (with different controls for build, test and release).
This made it possible to include actionable security fixes into other code and bug fixes, while still in the same context of engineering that same piece of code. It’s a method that has proven highly effective for embedding security into code early, and before merging and deploying code to production.
Dynamic Application and Infrastructure Security Management
What has proven less successful are the ways that security vulnerabilities have been handled at runtime both at the level of the cloud provider infrastructure and the application. The common practice for this layer is to run these checks on a predefined schedule and alert the DevOps or cloud engineer to any issue (during the run/operate phase). This is completely decoupled from any engineering process, and often leaves this area in no man’s land or opens the door to creating infrastructure drift. The same type of problem occurs with security findings discovered against the runtime application.
Once the code is deployed and running in production, tracking down the code owner is difficult and bringing them back into this piece of code’s context, even more so. Infrastructure security issues that arise after the fact are a common contributor to infrastructure drift, as many times engineers prefer to make changes in the console or UI instead of through infrastructure as code. This would require the code to be redeployed through the regular pipelines and checks and adds other humans to the process.
The other half of it is even when debugging is done in production, many times due to the urgency of the fix, these changes also often bypass code gating as well. This also assumes that the fix is simple and detection as well, where in reality neither of these is true. Rarely is a solution provided as code, as these have the tendency to be error-prone and complex solutions. And even if it is, the fix is not always straightforward and easy, although more than ever there is a need for “shift-left” practices for runtime as well.
This commonly happens because after deployment there is no longer real clarity regarding ownership, and scheduled checks are decoupled from any ongoing engineering process. Therefore, if an alert arises, the engineer will want to deal with it as quickly as possible, and manual changes or drift will only be detected upon the next scheduled run. That can be hours, days or weeks away when another engineer is on call.
Better Fix Hygiene
A good practice would be to move these checks and controls into the same code-centric gate — the PR — and ensure that at the very least they are caught upon first deployment to staging, so as not to reach production — again while the engineer who wrote the code is still in context. This will make it possible to ensure that there are no alerts or issues with the infrastructure and runtime of choice.
To take this further, there are security measures we can take as early as the coding itself through in-IDE security alerts and pre-commit hooks to help embed security as early as possible into our products and systems.
Continuous Security — the Next Frontier of Elite Teams
The code-centrics aspects are the easy part. They are often already implemented in security-minded organizations, where each PR is viewed as a new security delta from existing code.
For the non-code centric changes, such as infrastructure changes, IaC and even config as code — and to be even more accurate and clear, these include both changes in the code that lead to non-code issues, such as a change in IaC has some consequences in the infrastructure runtime, or a change in the application code that can lead to non-code issues in the runtime— it is slightly harder. But it is not impossible to find a good framework for defining a baseline and to ensure this is maintained with every deployment or environment change.
Anything that doesn’t fall into these two categories of immediately fixable issues are treated as backlog fixes, and go through the prioritization and remediation framework we define based on their severity, fixability and ability to be automated and orchestrated.
Examples Include:
Is it fixable? (automated or semi-automated?)
What’s the effort involved?
Are batch operations possible?
What’s the effort?
Severity?
Community alarm?
These are just some of the parameters that affect our prioritization and decision-making around issues in our backlog.
Continuous Security: A Program All CISOs Can Get Behind
Continuous security is possible by breaking down the formerly daunting domain of security into developer-centric language, tools, workflows and processes. By delivering security as code, the automation already possible in other engineering disciplines is also now possible in security. Once we identify the areas we can automate, it’s possible to achieve true security orchestration — basically the automation of workflows and not simply one-off tasks. The final piece is to ensure we are constantly maintaining this baseline security posture we have defined and achieved, through continuous monitoring and grooming of our security backlog.
In our next post, we’ll dive into how the adoption of this approach benefits CISOs as well and share the CISO perspective that demonstrates how formerly opposing views are now converging into a single worldview that has, until recently, been a source of friction and frustration in many engineering organizations. All of these together will be the enabler of engineering velocity, making it possible for CTOs and CISOs alike to deploy rapidly and with confidence.
Fitbit is leveraging its new Google support to try to put itself back on top of the fitness-minded wearable market, announcing Wednesday its latest version of the Versa and Sense smartwatch series alongside the return of the Inspire budget fitness tracker. There’s some impressive sounding features here, but many are…
MacOS Ventura could prove reassuring if you're worried about compromised peripherals ruining your computer. As The Vergenotes, Apple has revealed that Ventura will require user permission before USB-C and Thunderbolt accessories can transfer data on M1- and M2-based Macs. You won't have to fear that someone could deliver malware simply by plugging in a thumb drive, or that a poorly-designed product might wreck your machine by sending bad info.
The policy is enabled by default, but won't affect accessories plugged into your Mac during the OS upgrade process. It also won't block external monitors, power adapters or products attached to already-approved hubs. Devices will also continue to charge even if they're blocked, so you can still use your computer to top up a friend's phone.
This won't thwart devices that could fry ports through electrical surges. However, this could add a meaningful layer of security on top of USB-C's requirement for encrypted authentication certificates. You'll have the final say on data access, and might just stop a malicious device before it has a chance to do any damage.
Everytime I get to use Red Hat’s Open Shift I think to myself: “I should use OpenShift more”. It is a really great tool not just for high availability clusters but for general software development also. Its Web interface is super intuitive and nice to use, and you can provision all sorts of stuff in minutes. And everything is open source. Its really great.
So naturally I decided to run it locally, especially after the news that starting from version 4.8 you can use it on single node architecture also. I decided to run it virtualized in libvirt so I can destroy it if I no longer needed. Hooray!
Sadly my “Hooray” was short lived, since the installation proved difficult for me.
The official guide calls for either using the Assisted installer which is only available for OpenShift, not for OKD or using the manual way which is not that difficult, but I just couldn’t get it to work. The ignition process would start and hang with one of the issues I will mention below.
I searched and found several guides on how others have set up their small virtual “clusters”:
All of them had very useful tips and general information to learn about OpenShift/OKD but I couldn’t get any of them to work properly. I ran into a number of issues with: etcd not working (etcdctl failed: retrying in 5 seconds), bootstrap machine not having enough storage (https://github.com/openshift/okd/issues/649), iptables SELinux trouble (https://bugzilla.redhat.com/show_bug.cgi?id=2008097) and others. Also some of the guides called for outdated OKD version use which meant that the container images were no longer available. The closest guide I got to be almost working is the last one (from the maumene blog). There, everything worked apart from the console operator (which may have been an error on my part).
Now I have to say that some of the issues I had were my configuration faults, either with DNS, haproxy or DHCP configuration. But a lot of them came from various installation problems which were difficult to find. My final successful installation for example only works with one certain OKD version (without specific reasoning why).
If you made it this far, you are probably wondering why not just use CRC and it is a good question. While I used CRC before and it works great I was really interested in setting up my own version. Funnily enough, it later proved that CRC was indeed the answer to my problems because it has automated ways of setting up Single Node Clusters (SNC’s)!
Setting up your own libvirt OKD (OpenShift) Single Node Cluster (a short guide) #
There is a fantastic post here: https://upstreamwithoutapaddle.com/home-lab/okd-crc/ on how to build your own OKD version of CRC. In its process it actually builds a libvirt Single Node Cluster (SNC, https://github.com/code-ready/snc) to create an image for CRC. So you can just use this process to build your own single node cluster and skip building CRC.
Follow the guide until this step:
./snc.sh
or before creating of the single node cluster. In the snc.sh file you can inspect and change the whole process and configuration on how your cluster will be built. You can change OKD version (only one that worked for me was 4.8.0-0.okd-2021-10-10-030117, hardware configuration, you can disable the “not for production warning” by commenting it out in the code, and you can even change the default crc.testing hostname (I looked for it with grep -Ri crc.testing and replaced it everywhere with sed.
When the process is done, you will have a single libvirt VM with the entire functioning OKD cluster in it. DNS and DHCP are configured automatically with libvirt. Also storage and registry are automatically setup for you.
The VM is not setup to start OKD by default but you can ssh into it (ssh key id_ecdsa_crc is generated during the process and saved in your working directory) and execute: sudo systemctl enable kubelet && sudo systemctl start kubelet
The only version that worked for me is this one: 4.8.0-0.okd-2021-10-10-030117, there are later versions of OKD 4.8 but they didn’t seem to work, be careful about it.
On my Fedora 35 laptop, systemd-resolv was not playing nicely with dnsmasq setup of libvirt. There is a comment here on how to make it work, but I ended up disabling it and using dnsmasq (default one from NetworkManager).
The SNC building process is not fully automatic, it needs your sudo password several times (to work with virsh) and it will time out making you run the lengthy process from the beginning. Don’t ask me how I know. :)
Take a look also at this method: https://github.com/eranco74/bootstrap-in-place-poc which also mentions ways of doing thing automatically. Since the SNC/CRC method worked for me, I didn’t test this one our but it looks very promising.
Big thanks to @cgruver for his guide on how to build CRC with OKD. In the end it was a learning curve for me, but I am now comfortable with setting up and using OKD in my development environment and it is truly amazing software.
The Oversight Board has only been up and running for less than a year, but Facebook says it’s already having trouble keeping up with the group’s recommendations. The company says it wants to work with the Oversight Board to “improve the recommendation process,” though it’s not yet clear what those changes might entail. But it suggests Facebook is looking to shake up the way it deals with the independent body it created to oversee its content policies.
In a new report detailing Facebook’s dealings with the Oversight Board, the company notes that it’s made significant changes as the result of the Oversight Board’s recommendations. These changes include updates to how it handles hate speech and nudity, as well as how it determines “newsworthy” content.
But Facebook is now suggesting it wants to change up the recommendation process. “While we have made these important changes as a result of the board’s recommendations, we believe the current design of the recommendation process may not be the best way to bring about the long-term, structural changes the board is pushing us to undertake,” the company writes in its report. “We are working with the board and our internal teams to explore other ways to potentially improve the recommendation process.”
Again, it’s not clear exactly what this means for the Oversight Board or Facebook’s relationship with the group. The Oversight Board didn’t immediately respond to a request for comment, and during a call with reporters on Tuesday, Facebook’s Monika Bickert declined to elaborate on specific changes the company was hoping to make.
In its report, Facebook writes that “the pace and volume of the recommendations do not allow us adequate time to initially assess and implement the recommendations.” According to Facebook, most of the board’s recommendations “require over a dozen people to assess feasibility, which we cannot easily complete in 30 days.” the company added that it can take considerable time to determine how to integrate the policy suggestions into its existing product development.
But while it’s not yet clear what will change as a result of Facebook’s proposed “potential changes,” the fact that the company is already trying to make major changes to how it deals with the board is significant. Since its inception, Facebook critics have blasted the Oversight Board as little more than a PR stunt. And while the company has said it will abide by individual content decisions made by the board, its broader policy recommendations are where it could have the greatest influence over the company. For example, the board criticized Facebook’s decision to impose an “indefinite suspension” on former President Donald Trump, and told the company it needed to better define its rules for politicians.
Facebook has even suggested that other platforms should use the Oversight Board to monitor their content policies as well. That the company is now claiming it’s too difficult to keep up with the process its executives and policy officials designed could potentially undermine the influence the board is able to wield.
OpenShift requires a load balancer for providing access to the hosted applications. Although I can run a three node cluster, I need a fourth location to provide a load balancer that can then provide access to the cluster.
For my home lab set up, this means I want to run one on my bastion host….but it is already running HTTP and (FreeIPA) Red Hat IdM. I don’t want to break that. So, I want to add a second IP address to the bastion host, and have all of the existing services make use of the existing IP address. Only the new HA Proxy instance will use the new IP address.
This would be trivial for a simple Ethernet port, but I am using a Bridge, which makes it a touch trickier, but not terribly so.
Adding an IP address can be done using the following command:
sudo ip addr add 192.168.123.6/24 dev br0
The IP Address comes from the same subnet as both the bastion host and the OpenShift cluster machines already use. The DHCP server does not allocate addresses below .100 So this is a safe static value to use. br0 already has the address 192.168.123.1.
In fact, that IP address is visible in the network scripts:
However, I want this to persist over a reboot. If I bring the br0 connection down and then back up again, it is gone.
Well, if I am dumb and I bring it down when I am logged on over it, I lock myself out, but fortunately the device also has a Wireless connection.
I can use the nmcli command to add the additional address like this:
sudo nmcli con mod br0 +ipv4.addresses "192.168.123.6/24"
Which does not make the change immediately, but rather requires that I bring the device down and back up.
And I freeze myself out of the Bastion host on that interface. What is wrong?
$ ping nuzleaf
PING nuzleaf.home.younglogic.net (192.168.123.1) 56(84) bytes of data.
From ayoungP40 (192.168.123.2) icmp_seq=8 Destination Host Unreachable
Looking at the routing table:
$ ip route
default via 10.0.0.1 dev wlp2s0 proto dhcp metric 600
10.0.0.0/24 dev wlp2s0 proto kernel scope link src 10.0.0.240 metric 600
10.88.0.0/16 dev cni-podman0 proto kernel scope link src 10.88.0.1 linkdown
192.168.100.0/24 dev virbr0 proto kernel scope link src 192.168.100.1 linkdown
192.168.123.0/24 dev br0 proto kernel scope link src 192.168.123.1 metric 425
192.168.123.0/24 dev br0 proto kernel scope link src 192.168.123.6 metric 425
192.168.130.0/24 dev virbr1 proto kernel scope link src 192.168.130.1 linkdown
We have two entries for the 192.168.123.0/24 network. I know that I want the .1 entry. If I delete both, and add back in one, I get ping responses:
sudo ip route del 192.168.123.0/24
sudo ip route del 192.168.123.0/24
sudo ip route add 192.168.123.0/24 via 192.168.123.1
Bring the device down and back up again. It takes a moment for the route information to settle, but I start getting ping response again after a few seconds. But can I log in? ssh to the machine….yes. Eventually.
Going back to the routing table:
$ ip route
default via 10.0.0.1 dev wlp2s0 proto dhcp metric 600
10.0.0.0/24 dev wlp2s0 proto kernel scope link src 10.0.0.240 metric 600
10.88.0.0/16 dev cni-podman0 proto kernel scope link src 10.88.0.1 linkdown
192.168.100.0/24 dev virbr0 proto kernel scope link src 192.168.100.1 linkdown
192.168.123.0/24 dev br0 proto kernel scope link src 192.168.123.1 metric 425
192.168.123.0/24 dev br0 proto kernel scope link src 192.168.123.6 metric 425
192.168.123.0/24 via 192.168.123.1 dev br0 proto static metric 425
192.168.130.0/24 dev virbr1 proto kernel scope link src 192.168.130.1 linkdown
Once I again, I delete all of the routes for the 192.168.123.0/24 network. I run the following command three times:
sudo ip route del 192.168.123.0/24
Then recycle the bridge interface:
$ sudo nmcli conn down br0
Connection 'br0' successfully deactivated (D-Bus active path: /org/freedesktop/NetworkManager/ActiveConnection/19)
$ sudo nmcli conn up br0
Connection successfully activated (master waiting for slaves) (D-Bus active path: /org/freedesktop/NetworkManager/ActiveConnection/21)
They are still there…but I can still connect over the wired interface. I think the static route takes precedence. I’m going to leave it as is for now.
EDIT: SSH is taking forever to connect, even though pings are returned. Not sure if it is the routing, or DNS. It is always DNS, isn’t it?
So it appears Rick from Rick and Morty has the only PC capable of running Crysis -- with the recent episode of the show 'The Old Man and the Seat' seeing Rick use one of his computers to perform a "reverse digestion extrapolation"... or a sh*t analysis, in laymen's terms....
Google today announced an important update to its Cloud Build CI/CD platform that brings vulnerability scanning to all container images built using the service. Container Registry vulnerability scanning, which is now in beta, is meant to ensure that as businesses adopt modern DevOps practices, the container they eventually deploy are free of known vulnerabilities.
As Google rightly notes, the only way to ensure that security protocols are always followed is by automating the process. In this case, all new Cloud Build images are automatically scanned when Cloud Build creates an image and stores it in the Container Registry.
The service uses the standard security databases to find new issues. Currently, the service can identify package vulnerabilities for Ubuntu, Debian, and Alpine, with CentOS and RHEL support coming soon.
When it finds an issue, the service will notify the user, but businesses can also set up automatic rules (using Pub/Sub notifications and Cloud Functions) to take actions automatically. Users also get detailed reports about the severity of the vulnerability, VCSS scores, which packages were affected and whether there’s a fix available already.
The United States Department of Defense is still issuing SHA-1 signed certificates for use by
military agencies, despite this practice being
banned by NIST for security reasons nearly two years ago. These certificates are used to protect sensitive communication across the public internet, keeping the transmitted information secret from eavesdroppers and impersonators. The security level provided by these DoD certificates is now below the standard Google considers acceptable for consumer use on the web.
The Missile Defense Agency, the eventual successor to the "Star Wars" programme, uses one of these SHA-1 certificates on a Juniper Networks remote access device.
The SHA-1 certificate was issued by the Department of Defense in February 2015, long after NIST declared this practice to be unacceptable.
The Missile Defense Agency operates a remote access service which uses a SHA-1 signed certificate issued earlier this year. This makes the site vulnerable to impersonation and man-in-the-middle attacks that would facilitate unauthorised access to data.
The National Institute of Standards & Technology (NIST) is charged with "developing standards and guidelines, including minimum requirements, for providing adequate information security for all agency operations and assets", though its requirements "shall not apply to national security systems". Whilst these Department of Defense systems may or may not be considered national security systems, it is difficult to see why they would be subject to requirements any less stringent than those recommended by NIST.
The SHA-1 algorithm was first published in 1995 and is no longer considered secure.
NIST's decision to disallow SHA-1 signature generation after 2013 was originally due to
concerns surrounding the cryptographic strength of the algorithm.
Back then, it was thought quite likely that future advancements in computing technology and the
discovery of new attacks would allow attackers to find SHA-1 hash collisions, and thus be able
to impersonate any secure website with a seemingly valid SSL certificate. This prediction appears to have come true, with the latest research suggesting that the cost of using cloud computing resources to find a SHA-1 hash collision is now in the region of $75k, or perhaps even only a week's use of the largest botnets.
The majority of SHA-1 signed SSL certificates issued for use on publicly-accessible websites within the past
few months, and that are valid beyond the start of 2017, were issued to hostnames under the
.mil sponsored top-level domain.
This sTLD is used by agencies, services and divisions of the United States Department of Defense.
A U.S. Navy .mil website, which also uses a SHA-1 signed certificate issued earlier this year.
Many other SHA-1 certificates used by .mil websites are valid beyond the start of 2017, which means that Google Chrome already regards them as affirmatively insecure, crossing out the padlock icon:
The security of some of these sites is further undermined by their use of
TLS 1.0 connections, even though most users' browsers are likely to support later versions.
TLS 1.0 is now considered weak and obsolete, with some standards bodies such as the PCI SSC
mandating that it should no longer be used in new applications, and that existing applications
must migrate to TLS 1.1 or later by June 2016.
Obsolete TLS 1.0 connection used by a military remote access service.
But disabling support for TLS 1.0 is not always feasible, particularly as some older browsers such as
Internet Explorer 8 do not support TLS 1.1 and 1.2. If it is essential for a server to retain support
for TLS 1.0 (in addition to later versions), then TLS Fallback SCSV
must be used to prevent downgrade attacks against clients that support TLS 1.1 or later.
This will ensure that modern browsers will always use acceptably secure versions of TLS,
while only the older clients can possibly use the weak, obsolete TLS 1.0 cipher suites.
Several other U.S. military remote access services only support the obsolete TLS 1.0 protocol,
including two used by the Defense Logistics Agency. Some other military sites, including one of the Navy's VPN services do support TLS 1.2, but with obsolete cipher suites. These particular sites all use SHA-1 signed certificates that do not expire until 2017, and so are regarded as "affirmatively insecure" by Chrome.
DoD PKI infrastructure
The Department of Defence PKI infrastructure relies on two root certificate authorities
(DoD Root CA 2 and DoD Root CA 3), but these are not included in all browsers by default.
Windows and Linux users must explicitly install the DoD root certificates in order
for the subscriber certificates to be validated and trusted by their browsers.
But interestingly, the DoD roots are trusted on Apple platforms by default; this means that the DoD has the necessary third-party attestation for inclusion in the Apple Root Certificate Program,
even though many of the subscriber certificates fail to conform to the Baseline Requirements for the issuance and management of publicly-trusted certificates.
The U.S. Government has faced numerous hurdles in being recognised as a publicly-trusted certificate authority. In 2009, the Federal Public Key Infrastructure Management Authority (US FPKI) requested for its Federal Common Policy Framework Certificate Authority (Common Policy CA) root certificate to be added to Firefox and other Mozilla products. Only subscriber certificates for .gov and .mil domains would have been trusted under this root, but the request was eventually put On Hold in May 2015. It was decided that US FPKI should be treated as a Super-CA, whose subordinate CAs must apply for inclusions themselves.
One of the arguments for accepting the US government as a publicly-trusted certificate authority was that it would avoid the need to purchase commercial certificates and thus save taxpayer dollars.
One viable alternative might have been to use the free Let's Encrypt certificate authority, which became trusted by all major browsers this week. However, the cross-signed Let's Encrypt Authority X1 intermediate certificate uses the X509v3 Name Constraints field to explicitly disallow its use by .mil domains. No other top-level domains are precluded from using Let's Encrypt.
Many .mil sites recommend using the InstallRoot tool to simplify the installation and management of the
DoD root certificates on Windows machines.
This tool also installs several intermediate certificates, which the Department of Defense uses to directly sign the
subscriber certificates.
As an example, the subscriber certificate issued to cec.navfac.navy.mil was signed on 19 March 2015 by the DOD CA-27 intermediate, which is signed
by the DoD Root CA 2 trusted root. This chain of trust allows the browser to verify that cec.navfac.navy.mil is
a legitimate site operated by a Department of Defense agency, and that the connection is not being
subjected to a man-in-the-middle attack.
These intermediate certificates are also signed with the arguably weak SHA-1 algorithm. Whilst not the most likely way in which SHA-1 will initially fail — a chosen-prefix attack such as the one used on MD5 in the Flame malware is more likely — if any of these
intermediate certificates were to be targeted to find a collision, it would be possible for an attacker to generate valid
subscriber certificates for any domain. This would allow the attacker to convincingly
impersonate U.S. military sites and carry out man-in-the-middle attacks against browsers that
trust the DoD root certificates.
The DOD CA-27 intermediate certificate that was used to issue the subscriber certificate for cec.navfac.navy.mil is valid until September 2017 and has a SHA-1 signature.
Chrome also warns users when intermediate certificates are signed with SHA-1.
Although the DoD PKI infrastructure is not trusted by all browsers,
it is nonetheless surprising to see it flouting some of the well-founded rules and recommendations that apply
to publicly trusted certificates as well as recommendations made by NIST. Many of these guidelines are backed by valid security concerns –
in particular, using SHA-1 for signature generation
is now considered ill-advised, as any well-funded attacker can plausibly compromise the affected certificates.
The risk to the Department of Defense is further heightened by enemy goverments
being the most likely sources of attack. The projected cost of attacking SHA-1 is unlikely to be prohibitive,
and some governments may already be in a position to find a hash collision faster than the most organised criminals.
Making copper users pay for fibre build is like asking cyclists to pay for motorways @stevebiddle — Bill Bennett (@billbennettnz) May 9, 2015 Filed under: Telecommunications Tagged: copper, fibre
Rod Drury's name wasn't mentioned on the agenda for the AWS Auckland Summit. So it was interesting to see the Xero founder and CEO chatting to the other keynote speakers as media representatives filed into to the hall. AWS put Drury on stage early. He talked about the advantages of building a business on cloud […]
Last month, a microbiology lab in Nottingham, England made international headlines when it unearthed a substance that kills methicillin-resistant staph, one of the deadliest superbugs of modern times. The most astounding part about the find? It was a 1,000-year-old Viking potion.
OpenStack has lots of moving parts. One of the challenges in administering a cluster is sifting through all the logs on the multiple nodes that make up a cluster. I help to administer TryStack and am always looking for tools to help managing this cluster go smoother.
I was introduced yesterday to Logstash + elasticsearch + Kibana. I’m not really sure which of these names to call what I was introduced to, I guess all of them. Idea is that all the logs from all the nodes are sent to a central location so that you can filter through them. I think there’s much more advanced usage of this trio. I’m still figuring out what to do with it beyond basic log searching.
My understanding is that Logstash helps to gather the logs, elasticsearch indexes them and kibana is the webui that queries elasticsearch. Here’s a screenshot of what I ended up with.
My co-worker Kambiz (kam-beez) pointed me to a couple links that he used to setup an instance of this and he more-or-less followed this post:
I already had apache running on the TryStack utility hosts and didn’t think it was nessesary to add nginx to the mix, which is what the post uses, so I figured it may be helpful to document the process I went through to get this running on apache. This install that has been very useful thus far and I’m glad I have it collecting logs.
also get a copy of the latest kibana stuff, this is just html and javascript so I don’t think there is an rpm afaict. I unpacked it and moved it to /var/www.
make sure that apache is installed too, I already had it installed from my Foreman and Nagios instances running on this server. Now lets start to configure this stuff. Start with Kibana. Edit /var/www/kibana-latest/config.js and update the elasticsearch: line:
Note that the 9200 in the config.js file is dropped and replaced with /elasticsearch. When you fire up kibana in apache it will try to connect directly to elasticsearch on 9200. To avoid having to punch extra holes in the firewall we’ll setup a proxypass in apache to pass the traffic from yourhostname.com:80/elasticsearch to localhost:9200. We’ll configure apache once we finish kibana.
Before we get to apache back up the kibana-latest/app/dashboards/default.json file (if you want to) and replace it with my copy:
The default.json file is a definition of what panels to put on your default view in kibana. I modified the one referenced on the other blog post, that’s why I gave you a new link instead of using the one on that post. There were a couple redundant panels that I consolidated. Also the timespan it referenced by default was old and static so I changed it to show the last hour by default.
So lets add that apache config now. Add /etc/httpd/conf.d/elasticsearch.conf. You could call this whatever.conf if you wanted to. I put both my elasticsearch proxy pass and my kibana alias in this file like this:
ProxyPass /elasticsearch http://localhost:9200
ProxyPassReverse /elasticsearch http://localhost:9200
alias /kibana /var/www/kibana-latest

<Location /elasticsearch>
    Order allow,deny
    Allow from all
</Location>
For this to work you’ll need mod_proxy and mod_proxy_http and if you’re using selinux you’ll need the httpd_can_network_connect bool set on. Google those if you’re not sure how to set them up. There’s lots of docs out there about them. Finally lets configure logstash. First edit /etc/sysconfig/logstash and set the START to true instead of false. The service won’t start if you don’t.
Next create /etc/logstash/conf.d/logstash.conf with this content:
Last open up your firewall to allow your hosts to send rsyslog messages to port 5544. I added an iptables rule to /etc/sysconfig/iptables and restarted the firewall: (note: the minus in this is intended to be part of the line and does not indicate you should remove it)
-A INPUT -i em1 -m state --state NEW -m tcp -p tcp --dport 5544 -j ACCEPT
This rule listens on the em1 interface, my internal network. Easiest way to do this for your host is edit that file, copy the rule for port 22 and update the duplicated line to accept port 5544 instead of 22. Then restart iptables.
*** IMPORTANT *** there are security implications to opening this port. Please do not open this port to the world and allow anyone to pollute your logs. I’ve opened mine up only to my internal network for my cluster. You should also restrict traffic somehow to that only the hosts you expect to get logs from can connect to this port.
Finally fire it all up:
[root@host1 ~]# service elasticsearch start
[root@host1 ~]# service logstash start
[root@host1 ~]# service httpd start
This should give you a pretty uninteresting kibana interface. There won’t be any logs in it yet. Key here is to watch the top of the page and make sure that there isn’t a message that kibaba can’t connect to elasticsearch. If it can’t visit yourhostname.com/elasticsearch and make sure that you get a 200 back.
To populate with logs you could use the logstash client, but the logstash cookbook post referenced above suggests it’s a bit heavy weight. I’ve had really good results thus far just having rsyslog send over the logs. To do that, on each of the hosts that you want to aggregate logs you’ll need to create the file /etc/rsyslog.d/logstash.conf with this content:
*.* @@your_logstash_host:5544
This will send ALL LOGS from that host to logstash for indexing. Google rsyslog if you would like to find out how not to send all logs to logstash.
Once you start to see logs flow into the web interface you can change the time span in the upper right hand corner. You can query your logs. Try putting a hostname or ip into the query box at the top. You can use wildcards like *error* to find errors. You can layer filters. Try adding a filter for a host in the filter box just under the query box. Then add another one for *error* and you’ll get the errors for just that host within the timespan you’ve chosen.
Hope this helps you track down issues. I immediately found I had a rouge iscsi session on one of my compute nodes and was able to put it out of its misery.
*** Update Jan 20 ***
I noticed that not all the OpenStack logs were showing up in my logstash searches. Turns out you can toggle openstack using syslog. My puppet configs turn it off by default so I had to turn it on on all my hosts. This boils down to setting ‘use_syslog = true’ in all your component’s conf files. Here’s a link that talks more about it:
Skip to around the 3:30 mark or so. Starts and ends with audio clips of Steve Jobs talking about the endeavor — to my recollection, this is the first time since his death that Apple has used his voice or image.


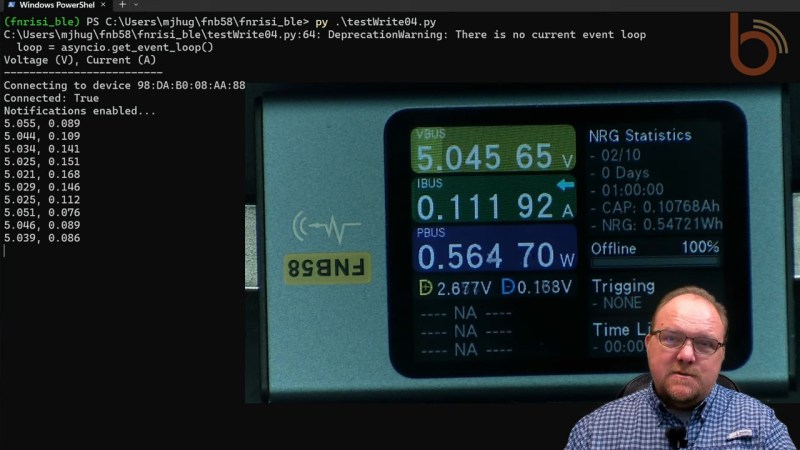


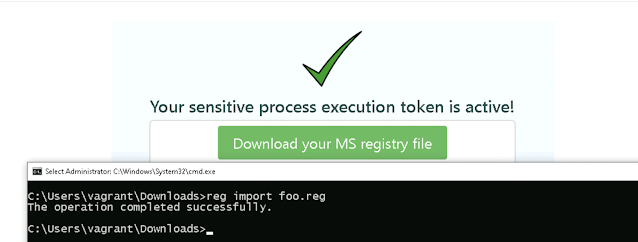
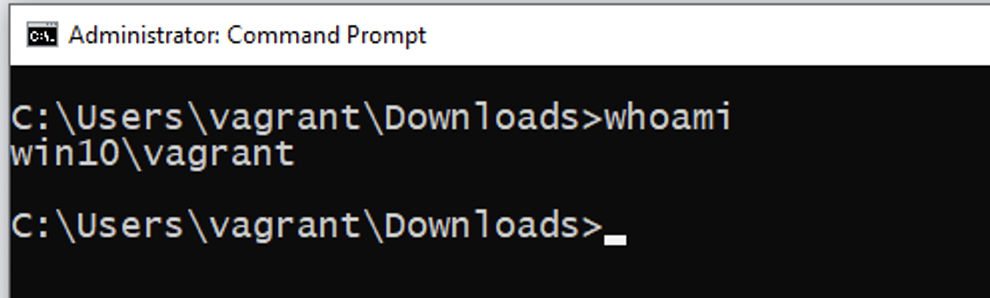
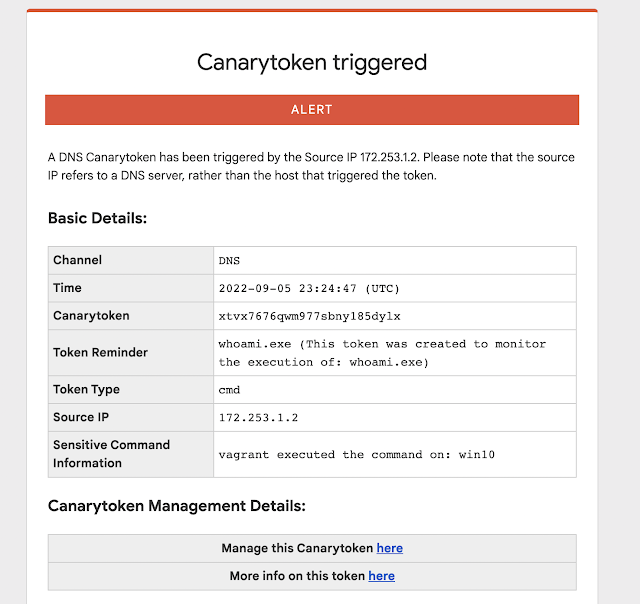


