Shared posts

30 Oct 15:22

How the Motorcycle Jacket Lost Its Cool & Found It AgainTroy...

by derekguypto


How the Motorcycle Jacket Lost Its Cool & Found It Again

Troy Patterson has an interesting article in the New York Times today on the history of the leather jacket. Specifically black leather motorcycle jackets and their role as signifying rebellion in everything from rock and roll to gay culture. An excerpt:

Just as actual 1930s gangsters aped the style of characters played by the actor George Raft, real-life delinquents turned to black leather. You didn’t need a motorcycle to be in a ‘‘motorcycle gang,’’ according to the moral-­panicky logic of the day. What is more, you didn’t even need a gang to enjoy the aura of a gangster, a fact attested by the many teenage rebels whose acquisition of a motorcycle jacket constituted the full extent of their rebellion. But for pseudogangs — that is, for rock bands and teen cliques devoted to them — the motorcycle jacket is an international uniform impervious to obsolescence. It is a garb for all tribes: goths in Kenya; rockabillies in Japan; you in your youth, wherever you wasted it.

Its signal plays on many frequencies, expanding its meanings when garbled. Writing about the Ramones, the critic Tom Carson once sketched the dynamics of the masquerade: ‘‘Their leather jackets and strung-out, streetwise pose weren’t so much an imitation of Brando in ‘The Wild One’ as a very self-­conscious parody — they knew how phony it was for them to take on those tough-guy trappings, and that incongruousness was exactly what made the pose so funny and true.’’ The Ramones’ imitators did not necessarily get this, and instead, reading the self-­parody as an uncomplicated statement of force, copied that. Or consider the curious intersection of gay leather and heavy metal. ‘‘The Wild One’’ was also a lodestar for sexual outlaws — for the homoerotic illustrator Tom of Finland, for instance, and lesbians who identified as ‘‘dykes on bikes.’’ Two decades before coming out of the closet, Rob Halford, the leader of the band Judas Priest, cultivated a stage presence that depended on the queer aesthetics of the leather daddy to entertain a furiously heteronormative audience of headbangers. Masculinity is pliant material.

You can read the rest here.

26 Oct 14:29

Top Brewery Road Trip, Routed Algorithmically

by Nathan Yau

brewery-road-trip-final

There are a lot of great craft breweries in the United States, but there is only so much time. This is the computed best way to get to the top rated breweries and how to maximize the beer tasting experience. Every journey begins with a single sip. Read More

23 Oct 15:24

3 reasons why you can’t always use predictive performance to choose among models

by Andrew

2djs3RG

A couple years ago Wei and I published a paper, Difficulty of selecting among multilevel models using predictive accuracy, in which we . . . well, we discussed the difficulty of selecting among multilevel models using predictive accuracy.

The paper happened as follows. We’d been fitting hierarchical logistic regressions of poll data and I had this idea to use cross-validated predictive accuracy to see how the models were doing. The idea was that we could have a graph with predictive error on the y-axis and number of parameters on the x-axis, and we see how adding new parameters in a Bayesian model increased predictive accuracy (unlike in a classical non-regularized regression, where if you add too many parameters you get overfitting and suboptimal predictive performance).

But my idea failed. Failed failed failed failed failed. It didn’t work. We had a model where we added important predictions, definitely improved the model—but that improvement didn’t show up in the cross-validated predictive error. And this happened over and over again.

Our finding: Predictive loss was not a great guide to model choice

Here’s an example, where we fit simple multilevel logistic regressions of survey outcomes given respondents’ income and state of residence. We fit the model separately to each of 71 different responses from the Cooperative Congressional Election Survey (a convenient dataset because the data are all publicly available). And here’s what we find, for each outcome plotting average cross-validated log loss comparing no pooling, complete pooling, and partial pooling (Bayesian) regressions:

Screen Shot 2015-07-25 at 12.46.49 AM

OK, partial pooling does perform the best, as it should. But it’s surprising how small is the difference compared to the crappy complete pooling model. (No pooling is horrible but that’s cos of the noisy predictions in small states where the survey has few respondents.)

The intuition behind our finding

It took us awhile to understand how a model—partial pooling—did not perform much better given that it was evidently superior to the alternatives.

But we eventually understood, using the following simple example:

What sorts of improvements in terms of expected predictive loss can we expect to find from improved models applied to public opinion questions? We can perform a back-of-the-envelope calculation. Consider one cell with true proportion 0.4 and three fitted models, a relatively good one that gives a posterior estimate of 0.41 and two poorer mod- els that give estimates of 0.44 and 0.38. The predictive log loss is −[0.4 log(0.41) + 0.6 log(0.59)] = 0.6732 under the good model and −[0.4 log(0.44) + 0.6 log(0.56)] = 0.6739 and −[0.4 log(0.38) + 0.6 log(0.62)] = 0.6763 under the others.

In this example, the improvement in predictive loss by switching to the better model is between 0.0006 and 0.003 per observation. The lower bound is given by −[0.4 log(0.4) + 0.6 log(0.6)] = 0.6730, so the potential gain from moving to the best possible model in this case is only 0.0002.

Got that? 0.0002 per observation. That’s gonna be hard to detect.

We continue:

These differences in expected prediction error are tiny, implying that they would hardly be noticed in a cross-validation calculation unless the number of observations in the cell were huge (in which case, no doubt the analysis would be more finely grained and there would not be so many data points per cell). At the same time, a change in prediction from 0.38 to 0.41, or from 0.41 to 0.44, can be meaningful in a political context. For example, Mitt Romney in 2012 won 38% of the two-party vote in Massachusetts, 41% in New Jersey, and 44% in Oregon; these differences are not huge but they are politically relevant, and we would like a model to identify such differences if it is possible from data.

The above calculations are idealized but they gives a sense of the way in which real differences can correspond to extremely small changes in predictive loss for binary data.

The post 3 reasons why you can’t always use predictive performance to choose among models appeared first on Statistical Modeling, Causal Inference, and Social Science.

23 Oct 14:46

Brookline looks out for its own

by adamg

Wicked Local Brookline reports a resident dialed 911 after hearing a woman make "strange statements about JFK" (also note the items about an "aggressive" apple picker and the guy who came back to his car to find a new laptop in the back seat).

16 Oct 16:39

Ebola is now an STD

by Beth Mole

Months after a male Ebola survivor tested negative for the disease, he transmitted the deadly virus to a female partner through unprotected sex, a genetic analysis revealed.

The Liberian woman, who became ill with the disease and died in March, is the first person known to contract the Ebola virus from sex, researchers reported this week in the New England Journal of Medicine. Typically, people contract Ebola from direct contact with the blood or other bodily fluids from a sick or recently deceased patient.

But experts knew that the Ebola virus can linger in patients after they’ve recovered. And they speculated that sexual transmission was possible. After the virus is cleared from a patient’s blood, it can turn up in semen and other fluids for weeks or months—as long as nine months, new data suggest.

Read 4 remaining paragraphs | Comments

15 Oct 12:23

The Amazing World of Japanese Textile ArtsAfter Jesse posted...

by derekguypto


The Amazing World of Japanese Textile Arts

After Jesse posted about our Japanese textile scarves on Monday, I found myself Googling around for more info about boro - that wonderfully old, patched up fabric that comes out of Japan’s countrysides. Somehow, I stumbled upon the website for Orime, a small, Boston showroom that specializes in antique Japanese textiles and mingei items (mingei being the term for an early-20th century Japanese philosophy that celebrated the beauty in everyday utilitarian objects – sort of like a Japanese counterpart to England’s Arts & Crafts movement). 

Orime is run by two partners, Jared and Christopher, who have been collecting Japanese folk textiles for about ten years now. Up until very recently, they mostly sold things out of their showroom and at the Antique Textiles and Vintage Fashions show in Sturbridge, Massachusetts. Earlier this year, however, they launched an online shop. No small feat, as their inventory is large and it takes a lot of time to correctly photograph and document each item (even the stuff up now is only a fraction of what they actually have). Fascinated by their site, I called Jared and asked if he could give us a lowdown on some of the pieces. He kindly took us through the craft techniques used in some of these magnificent items. 


image
image
image

BORO: Boro comes out of Japan’s countrysides, where cloth used to be very precious and valuable. Since disposing things wasn’t an option for a lot of poor families, the wives of farmer and fisherman would patch and mend futon covers, clothes, and bags. As a result, you get these beautiful objects with hundreds of shades of color, often patched together with rough running stitches. 

Boro is less about a craft technique than it is an idea,” explains Jared. “It’s about repurposing rags or salvaging cloth, which was done out of necessity, not beauty. So while we typically see boros made from indigo-based cottons, they can really be made out of anything.”

Pictured above: boro futon cover that has been heavily patched and mended using an array of fabrics – from striped to solid-colored cottons. Also a farmer’s work jacket, known as a noragi, which has been patched together using dozens of late-19th and early-20th century rags. 


image
image
image


KASURI: A Japanese form of ikat, where threads have been resist-dyed prior to being woven. “Kasuri can be done by using resist-dyed threads along the weft only, or along the weft and warp. The second technique will produce a more detailed image, but – even with a skilled worker – the edges will always be slightly blurry. Part of the look is about the slightly diffused edges you see in the pattern,” Jared explains. 

Pictured above: Two kasuri futon covers, made from threads that have been hand bound, dyed with botanical indigo, and then woven on a hand-loom. 


image
image
image


KATAZOME: Another resist-dye technique. This is done by applying a rice paste through a stencil. The paste is allowed to dry, and then the fabric is dyed. One the color has been set, the paste is removed, thus revealing the design. 

Stencils used are typically small (maybe about the size of a sheet of paper). They’re set along, edge-to-edge, on the fabric as the worker applies the paste. On really good examples, the pattern will be applied to both the front and backsides of the cloth, and the stencils will align perfectly. Jared notes that sometimes multiple dyes will also be used. “Sometimes the person will apply one pass with a stencil, dye the fabric, and then apply another pass using a different color. In this way, you can get a build-up of colors, maybe a base design and then a highlight.”

Pictured above: Some lengths of hand-woven cottons, made out of hand-spun materials, that have been stenciled and then resist-dyed. Japanese textiles often feature petalled designs found in nature. The chrysanthemums in the top image, for example, are celebrated in Japan as a symbol of longevity. In the middle photo, we have a haten jacket, which features the Chinese zodiac kanji character for pig. 


image
image


SAKIORI: A Japanese version of rag weaving, done with narrow strips of shredded cloth. This technique was popular when fabric was precious and people couldn’t throw things away. “For example, if you had an old kimono, you might salvage the fabric by tearing it into strips and weaving the bits together,” says Jared. “So the warp would be cotton yarn, and the weft would be rag strips, giving the fabric a sort of irregular coloring.” 

Pictured above: A vibrant kimono sash. The cotton warp alternates between maroons and whites, while the shredded silk weft mixes deep purples, crimson reds, pine greens, goldenrods, and bright oranges. 


image
image
image


SASHIKO: A rough running stitch that’s used to either repair or reinforce fabric, or as a way to add decorative elements. This can be applied to any kind of traditional fabric, although you most commonly see it in patched up boro covers and jackets (where the stitches serve a functional, structural purpose). 

Pictured above: A wrapping cloth that has been beautifully decorated with a sashiko stitch to show a variety of patterns – overlapping circles, stylized chrysanthemums, and an interlocking motif of leaves. In the third photo, we see a grid of sashiko stitches that have been used to hold multiple layers of cotton together (this was done on a work jacket).


image
image
image

SHIBORI: Similar to tie-dye, although not strictly the same. Whereas tie-dye refers to a method of tying a fabric before dyeing it, the Japanese method of shibori can involve tying, pleating, or even wrapping the material around a pole. The result are these beautifully complex and repeating patterns you see here. 

Pictured above: A vintage kimono and a length of cotton that Orime believes might have been intended for use as a rain cape. The cape features an irregular pattern that’s reminiscent of the cascading branches on a weeping willow. The pattern was achieved by hand-pleating the fabric and binding it with thread, before then dyeing the textile in indigo. 


image
image


TSUTSUGAKI: Basically the same as katazome, but instead of applying a rice paste through a stencil, it’s applied freehand. “Think of it like applying icing on a cake, where you squeeze icing out of bag,” says Jared. Once the dye-resist paste is allowed to dry, the fabric is then dyed. The blue parts you see here are indigo, while the white parts are the natural colors of the fabric (where the paste was originally applied). 

Pictured above: A work jacket and futon cover. The cover is decorated with various elements from Japanese tea ceremonies – tea whisks, water ladles, hanging scrolls, calligraphy brushes, and floral arrangements. Futons decorated in this fashion were often given as part of a wedding trousseau to a new bride and groom. 

For more amazing photos, check out Orime’s website. They also have an appointment-only showroom in Boston and regularly show at the Antique Textiles and Vintage Fashion event in Sturbridge (which happens twice a year). For those outside of Massachusetts, you can follow Orime on Instagram and Facebook. Everything they post is available for sale, so feel free to contact them if you’re interested in something.

(Many thanks to Jared for taking the time to chat with us!)

09 Oct 14:50

I showed leaked NSA slides at Purdue, so feds demanded the video be destroyed

by Ars Staff

(credit: Purdue University)

Barton Gellman is a critically honored author, journalist, and blogger. In 2013, Gellman shot to prominence as one of three journalists worldwide to be entrusted with leaked documents by former NSA contractor Edward Snowden. This article first appeared on The Century Foundation’s website.

On September 24, I gave a keynote presentation at Purdue University about the NSA, Edward Snowden, and national security journalism in the age of surveillance. It was part of the excellent Dawn or Doom colloquium, which I greatly enjoyed. The organizers live-streamed my talk and promised to provide me with a permalink to share.

After unexplained delays, I received a terse e-mail from the university last week. Upon advice of counsel, it said, Purdue “will not be able to publish your particular video” and will not be sending me a copy. The conference hosts, once warm and hospitable, stopped replying to my e-mails and telephone calls. I don’t hold it against them. Very likely they are under lockdown by spokesmen and lawyers.

Read 33 remaining paragraphs | Comments

08 Oct 11:05

Watertown's Armenian Market & Bakery Has Closed

by Dana Hatic

No more shawarma and baklava for Watertown.

Armenian Market & Bakery
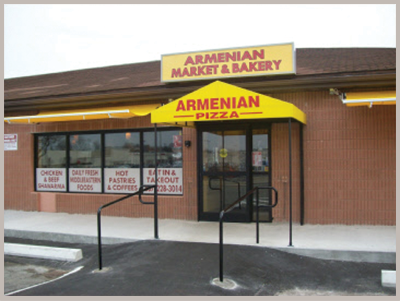
A go-to spot for Middle Eastern products and foods has closed, according to Boston Restaurant Talk and a poster on Chowhound. The family owned and operated Armenian Market & Bakery on Elm Street provided an eat-in kitchen for bakery items and meals, like shawarma, souvlaki, and more.

The market is reported closed on Yelp, and the phone number has been disconnected. According to its website, the market's founder wanted to create a distinctive shopping and eating experience for patrons. A post on Facebook suggested possible discord with the building's landlord, but it is not known what prompted the closure.

Watertown is home to a number of Armenian markets, several of which were featured during Eater's Cheap Eats Week earlier this year.

[Photo: Official Site]

07 Oct 21:23

What's happening to Chinatown?

by Kayla Canne

Image provided by Lillian Chan. See larger.

It's been nearly a month since Maxim's Coffee House served its last drop of hot coffee, its famous bun pastries flying off the shelves before the local bakery lost its lease and was forced to close its doors after 33 years in Chinatown. Yet artist Lillian Chan still finds sadness as she walks past the shuttered windows of the "iconic landmark" on the corner of Beach Street and Harrison Avenue. And neither she, nor the bakery, are alone.

As Chinatown's development spikes with high-rise luxury apartments and new commercial chains surrounding the ethnic neighborhood, many residents, visitors and small business owners are wondering one thing: what's happening to Chinatown?

"Just visually it's kind of jarring to see all of these high-rise building structures popping up around Chinatown," said Chan, a Boston resident who visits the neighborhood weekly. "It feels like it's just closing in on it."

Maxim's isn't the first of its kind — earlier this year another restaurant just down the street, Xinh Xinh, closed its doors for the last time, and prior to that Chinatown lost locally-owned grocery store Chung Wah Hong, along with many more local shops.

"The landscape definitely has changed," Chan said. "One of the bakeries that was on one of the corners was kind of a landmark in a way, and so it was kind of shocking when I found out [Maxim’s] had closed. It's just always been there and so you feel like it's always going to be there. And I can only imagine that more of that is happening as more construction is being done."

Craig Caplan, a small business owner who has worked within Downtown Crossing and Chinatown over the past 25 years, said small, locally owned businesses are threatened by luxury development. As expensive buildings go up, owners of other buildings in the neighborhood begin to believe that their spaces are more valuable and start to ask for higher rent.

"There's sort of this delusion of grandeur going on, where somebody who has been getting $20 a square foot for the last 15 to 20 years now thinks the property is worth $150 a square foot merely because they're a few blocks away from a beautiful high-rise," Caplan said. "So what you are seeing happening is people's leases are coming up for these commercial properties and they're used to paying $4,000 a month for their store, and suddenly they're finding that their landlords are starting to charge them $20,000 for the same exact space."

As locally owned shops struggle to afford higher rents, larger chains move in — most notably franchise coffee shops and pharmacies — which Caplan said is detrimental to any neighborhood, but especially one as culturally rich as Chinatown.

Without the unique local amenities such as authentic cuisine and cultural shops that serve and represent the community, Caplan fears Chinatown will lose some of the appeal — both to residents and visitors — that helps it stand out against Boston's other neighborhoods.

Chan agreed, saying many times she now finds herself traveling to what seems to be a relatively new Asian community in Quincy for Chinese cuisine, instead of heading into Chinatown.

"You can't have a homogenized mall suburban type area in the inner city," Caplan said. "People come to Chinatown for the culture, because of the neighborhood and the restaurants and the food and the people who are down there. If the whole area just turns into the same exact thing that people have out in the suburbs, then why come into into Boston?"

At-large City Councilor Ayanna Pressley said many times efforts to combat rapid and unorganized gentrification are focused on the affordable housing crisis, when this development unleashes a crisis on small business as well. Focusing in on Chinatown, Pressley said the displacement of local business due to high rents in the neighborhood would end up hurting all of Boston.

"It's very sad because we have 22 very distinct neighborhoods in the city of Boston and what makes them distinct are the amenities that exist in each of them," she said. "If all of our neighborhoods begin to look the same with franchise and box stores, all of our neighborhoods suffer because they're not as culturally rich, they're not as vibrant and they won't see the same amount of foot traffic. It's important that there is a commitment to keeping Chinatown Chinatown and to preserving cultural traditions, celebrating that history and to retaining iconic neighborhood institutions, like the bakery that was just lost."

Pressley said building more commercial space along side streets in neighborhoods across Boston might be a valuable solution to consider - increasing the stock makes more space available and may be a key factor in helping to drive rents down. By focusing on side streets as well as the main streets of these areas, Pressley believes smaller districts more suitable for local business can develop and thrive.

But the city's Department of Neighborhood Development said that the statistics show that Chinatown is thriving. With a 90-percent average occupancy rate throughout the roughly 300 street-level businesses in the neighborhood, Chinatown has one of the healthier commercial districts in Boston, according to Rafael Carbonell, deputy director of the DND's Office of Business Development. The vast majority of those businesses are local or independently-owned, Carbonell said.

"We know over the last year that seven new businesses opened and they created just over 70 jobs," he said. "So I think what we have is some natural turn in commercial districts, but sustaining that 90 percent occupancy rate on the ground level - that's really strong. There's a very strong network of business owners in Chinatown and that continues to be the case."

Carbonell said that under Mayor Walsh's direction, the city has been trying to increase assistance to small businesses while also encouraging residents to shop locally through several social-media campaigns throughout the year. The city has partnered with Chinatown Main Streets, a non-profit that promotes business development in Chinatown, to get a better understanding of how the city can help local businesses.

Last year, Mayor Walsh more than doubled funding for on-site business technical assistance, allowing for increased face-to-face contact with small business owners to discuss strategies for everything from marketing, store productivity and organization to hiring and staff retention, Carbonell said.

"Each business is very unique, and so really understanding the needs of that business given the situation its in, given the ownership, given its current conditions - that's really important to help them address those needs in a really personalized way and that's really been a big part of our business assistance," he said.

However, Caplan said he is skeptical of the government's true intentions based on what he has seen after 25 years in business. Instead of just talk, Caplan wants to see more effort into protections for local shops against property owners and high-priced commercial chains as gentrification moves in.

"You have to go by what it is you actually see happening," Caplan said. "They say that they're interested in making these changes, but I haven't really seen much - I've seen a lot of talk but not a lot of action. It will be a shame for Boston when there's not really a Chinatown anymore. It would be a shame if they can't update it and preserve it at the same time."

Chan said updating the neighborhood is necessary, but she wished the development in Chinatown was focused on more community-based buildings such as affordable housing units or a public library for the area. Chinatown is one of the few neighborhoods without its own BPL branch. Currently affordable housing makes up 36 percent of all units in Chinatown, but the DND said that number should rise to 40 percent once forthcoming development is complete.

But with pharmacies, franchise coffee shops and luxury condos moving in, Chan said it feels like Chinatown is "being swallowed up by all of the development versus what I see happening elsewhere."

"Or maybe it's more apparent because it's just such an ethnic community and to see it so drastically changing is just alarming and jarring," she added. "I don't mind the city changing - it needs to. It needs to grow. But I think that there are other ways in getting that to happen.”

07 Oct 03:26

An introduction to the Poisson bootstrap

by Amir Najmi
by AMIR NAJMI

The bootstrap is a powerful resampling procedure which makes it easy to compute the distribution of any statistical estimator. However, doing the standard bootstrap on big data (i.e. which won’t fit in the memory of a single computer) can be computationally prohibitive. In this post I describe a simple “statistical fix” to the standard bootstrap procedure allowing us to compute bootstrap estimates of standard error in a single pass or in parallel.


At Google, data scientists are just too much in demand. Thus, anytime we can replace data scientist thinking with machine thinking, we consider it a win. Anticipating the ubiquity of cheap computing, Efron introduced the bootstrap back in 1979 [1]. What makes bootstrap so attractive is that it doesn’t require any parametric assumptions about the data, or any math at all, and can be applied generically to a wide variety of statistical estimators. As simple as the bootstrap procedure is, its theory is far from trivial and has attracted the attention of many mathematicians. For conditions under which the standard bootstrap procedure applies see the definitive theory [2]. But here we are focused on its practical application and assume the reader knows how to apply basic bootstrap.

Suppose we are given a procedure for estimating $\theta$ from the IID data set \(x\), which we denote \(\hat{\theta}(x)\). For example, if we want to estimate the population mean, our estimator be the sample mean
\[
\hat{\theta}(x) = \frac{1}{n} \sum_{i=i}^n x_i
\]
We’d like to estimate the distribution of our estimator without having additional samples. The bootstrap procedure does this by generating $B$ “simulated” data sets, each of size $n$ denoted by \(x^*_1, .., x^*_B\) and simply uses the empirical distribution of \(\hat{\theta}(x^*_i)\) across these datasets as an estimate of the distribution of \(\hat{\theta}(X)\). It may take computation, but it’s easy to carry out. That the bootstrap blows away the problem by brute force computation is the reason Tukey suggested that Efron name it “shotgun” [1]. How big should $B$ be? It depends on what you want, but for percentile intervals $B=1000$ while standard errors can usefully be estimated  even with $B=20$.

The standard bootstrap procedure creates each simulated data set (aka “resample”) by drawing observations from $x$ with replacement, i.e. from $n$ observations we draw \(n\) with replacement. In any given resample, each observation may occur 0, 1 or more times according to $Binomial(n, \frac{1}{n})$. And since the total number of observations is constrained to be \(n\), the counts are jointly $Multinomial(n, \frac{1}{n}, \cdots, \frac{1}{n})$.

As a tiny example, suppose we wish to estimate the population mean using the mean of the given a random sample $\{ 2.3, 1.1, 2.7, 4.0 \}$. To construct the first resample (i.e. simulated data set of size n) we select one of the four observations and do this four times, say, resulting in the sample $\{ 4.0, 2.7, 2.3, 4.0 \}$. We repeat this whole process $B=3$ times to create resamples as follows:


  { 4.0, 2.7, 2.3, 4.0 }
  { 2.3, 2.3, 1.1, 2.3 }
  { 2.7, 4.0, 2.3, 4.0 }

We would simply apply our estimator (in this case the sample mean) to each of these $B$ simulated data sets and, according to bootstrap theory, obtain $B$ realizations as if from the distribution of the estimator.

For IID data, we can actually describe any resample by the number of occurrences of each observation in canonical order. For the resamples above, this would be

  { 0, 1, 1, 2 }  # Counts for Resample 0
  { 1, 3, 0, 0 }  # Counts for Resample 1
  { 0, 1, 1, 2 }  # Counts for Resample 2

where the values in each tuple are the number of occurrences of the observations 1.0, 2.3, 2.7 and 4.0 respectively. These counts follow the multinomial distribution $Multinom(4, \frac{1}{4}, \frac{1}{4}, \frac{1}{4}, \frac{1}{4})$. Thus the problem of bootstrap resampling reduces to generating these counts.

The standard (multinomial) bootstrap is a lot better at estimating standard errors for small samples than parametric methods which make asymptotic assumptions. Even for larger samples where procedures like the Delta Method work well, the bootstrap is attractive because it replaces tedious derivatives with more computation.

But when it comes to big data, the multinomial bootstrap is computationally problematic. For parallel computation, we need to make independent decisions about how many times to include each observation. For instance, in the examples above, our observations $\{ 1.1, 2.3, 2.7, 4.0 \}$ might be spread over a number of different machines (in a big data world, we cannot assume the data fits on one machine). Thus, in the Resample 0, we would want to compute each of the counts $\{ 0, 1, 1, 2 \}$ independently. But the sum of counts in the multinomial distribution are fixed, thereby negatively correlating with one another. In many cases, we may not even know the total number of observations in advance.

Our approach is to go ahead with independent sampling and just deal with the consequences mathematically. It turns out that for estimators involving ratios of sums, there really aren’t any practical consequences when $n \geq 100$. For instance, we could sample each observation from IID $Binomial(n, \frac{1}{n})$ and end up with a variable number of samples. But noting that
\[
\lim_{n \to \infty} Binomial(n, \frac{1}{n}) = Poisson(1)
\]
we prefer to just use Poisson sampling. This way there is no need to know n, the total count of observations, ahead of time. When applied to our tiny example, we generate $B$ realizations from $Poisson(1)$ for each observation independently. This results in something like this

  { 0, 0, 0 }  # For item value 1.1
  { 0, 1, 1 }  # For item value 2.3
  { 2, 1, 0 }  # For item value 2.7
  { 0, 2, 3 }  # For item value 4.0

where there is a B-tuple corresponding to each observation. To make them look like the multinomial counts we showed earlier could transpose these counts as follows

  { 0, 0, 2, 0 }  # Counts for Resample 0
  { 0, 1, 1, 2 }  # Counts for Resample 1
  { 0, 1, 0, 3 }  # Counts for Resample 2

but in reality, we use the first form to stream over the data while maintaining B running aggregates, one for each resample. In this way, we only look at each observation once in the map phase of a MapReduce and never have to store raw data in memory.

Notice that the first Poisson resample only has a total count of two. As long as our estimator scales for sample size (as does the sample mean) this won’t be a practical problem when $n \geq 100$ because the count in each resample will likely be close to $n$ (or rather within $n \pm 2 \sqrt{n}$).


A realistic example


Say we wish to estimate average CPC (cost per click paid by an advertiser for her ad) for all the ads by country from a day’s worth of traffic. Assume the raw data is organized as a massive CSV file such that each row is a single ad impression with columns for number of clicks and cost (in US dollars) on that impression:

  # Raw data with header
  query_id, impression_id, country_code, clicks, cost_usd
  0x23be2341, 0x701a6301, JP, 2, 1.2201
  0x57fcb234, 0x48af7063, AE, 1, 0.8234
  ...

The sample estimate is simply the sum of cost for all advertisers divided by the number of ad clicks on that day, and can be computed efficiently and in parallel within a MapReduce framework. Each row of aggregated data is the sum of clicks and cost of the raw data keyed by country:

  # Aggregated data with header
  country_code, clicks, cost_usd
  0, AE, 1345, 2368.621
  0, AR, 13894, 7197.968
  ...

To do the bootstrap, we introduce an additional key called resample_id. If we want 1000 resamples, this id ranges from 0 to 999. Each resample is an aggregate in which every row of raw data is included with weight drawn from independent $Poisson(1)$:

  # Bootstrapped aggregate data with header
  resample_id, country_code, clicks, cost_usd
  0, AE, 1345, 2368.621
  1, AE, 1411, 2039.838
  2, AE, 1359, 1916.304
  ...
  0, AR, 13894, 7197.968
  1, AR, 14076, 8858.110
  2, AR, 14066, 12131.114
  ...

By convention, the 0th resample is the unperturbed sum, i.e. each observation appears exactly once. We can use this data to compute standard intervals for the average CPC by country using any of the standard methods for bootstrap interval (e.g. normal, t, quantile).


More sophisticated resampling


In the example above, we applied the resampling procedure assuming each row of the raw data to be an independent observation. In other words, we assumed that ad impressions were the exchangeable unit in the statistical sense. But there are reasons to doubt this assumption. For instance, we could easily imagine that ads on the same query have positively correlated CPCs (prices for ads on the query [structured settlements] are generally higher than those on the query [magic markers]). If this correlation is not negligible then a bootstrap procedure assuming exchangeable ad impressions will underestimate the variability of our CPC estimator.

Thus, we cannot always assume that each row of the raw data is exchangeable. For the sake of this discussion, let us say we do not assume that queries rather than ad impressions are exchangeable. We could aggregate the data at the query level and then run a Poisson bootstrap procedure as before, but materializing query-level aggregates could be an expensive operation just to do this bootstrap. Instead, we can use a Poisson bootstrap in which we generate a pseudo-random \(Poisson(1)\) sequence of length B seeded is a hash of the exchangeable unit, in this case the unique query_id. What this does is that all data for a single query is aggregated to any given resample an integer number of times, where that integer is drawn from \(Poisson(1)\).

Side note: hashing i.e. reproducible, unit-based pseudo-randomization is a fundamental building block of statistical procedures for big data. We will cover this in more detail in a future blog post.

Thus, if we were to go back to our tiny example, imagine that our four observations were not independent, but came in independent pairs. In other words, the raw data is

  { 1703, 1.1 }
  { 4306, 2.3 }
  { 4306, 2.7 }
  { 1703, 4.0 }

where the first element of the tuple is the id for the pair. We want to bootstrap on the pairs but don’t want to incur the cost of rekeying the data by pair id. Instead, we simply generate a pseudorandom sequence of $Poisson(1)$ using the pair id as seed. This results in

  { 1, 0, 2 }  # For item value 1.1
  { 0, 1, 0 }  # For item value 2.3
  { 0, 1, 0 }  # For item value 2.7
  { 1, 0, 2 }  # For item value 4.0

representing resamples counts for the pairs 1703 and 4306 respectively as follows:

  { 1, 0 }
  { 0, 1 }
  { 2, 0 }

By using seeded pseudorandom generation, we were able keep pieces of the exchangeable unit in sync without additional communication.


The mathematical fine print


Thus far, we have justified the Poisson bootstrap on the intuitive basis that when n is large, the anti-correlation between sample counts for different observations will be small, and further, that the $Binomial(n, \frac{1}{n})$ approaches $Poisson(1)$. But independent sampling also means that the number of observations in each bootstrap resample is random $Poisson(n)$. There is a small chance that a resample will select insufficient observations for the estimator (e.g. a sample variance with fewer than 2 observations, or even no samples at all). While this is not of practical concern for cases when $n \geq 100$, the variable size of our resamples is clearly an additional source of variability. We merely asserted that it wasn’t a big deal.

Like any bootstrap theory, the theory behind the Poisson bootstrap is a bit involved. For a proper treatment of the Poisson bootstrap and other streaming resampling methods we refer the reader to Chamandy et al [3]. But the basic idea is that we formally define the Poisson bootstrap procedure to include the rejection and redoing of any resample if its size is “too far” from $n$. The resultant resampling distribution is no longer strictly Poisson but as $n$ grows, any rejection becomes increasingly unlikely. It can then be shown that the asymptotic distribution of the estimator using this Poisson bootstrap is much closer to that of the standard bootstrap than either is to the true distribution of the estimator. Thus there really isn’t any price to pay in estimation for using independent Poisson sampling and much to be gained computationally by way of parallelism.


Conclusion


The Poisson bootstrap is widely used within Google, having been built into the primitives of our analysis infrastructure. As we’ve shown, a clever implementation can be efficient even when the unit of resampling is not a single observation.


Statistical theory works at all scales, but statistical methods created for small data might not work as-is in a big data world. The Poisson bootstrap is an example of how a little flexibility in statistical theory can lead to methods which work efficiently with big data. One might say that Mathematical Statistics helped us scale!

References


[1] Efron, B. (1979). "Bootstrap methods: Another look at the jackknife". The Annals of Statistics 7 (1): 1–26

[2] Gené, E. and Zinn, J., 1990, Bootstrapping general empirical measures, Annals of probability 18, 851-869

[3] Nicholas Chamandy, Omkar Muralidharan, Amir Najmi, Siddartha Naidu “Estimating Uncertainty for Massive Data Streams”, Tech Report, 2012, Google

[4] Bradley Efron, R. J. Tibshirani, An Introduction to the Bootstrap, CRC Press, 1994
02 Oct 14:05

Physicist says band Deerhoof inspires him like Einstein, asks them to rock at LHC

by Nathan Mattise

Didn't see this coming.

When we visited the CERN's Large Hadron Collider this past year, there wasn't a ton of noise. The massive particle accelerator facility took a two-year hiatus for repairs, and that break meant a rare chance for humans to tour things with less risk. 

Apparently things were considerably noisier last month, but it had nothing to do with the facilities getting back to business. As part of an initiative called Ex/Noise/CERN, ATLAS (A Toroidal LHC ApparatuS) physicist Dr. James Beacham invited experimental indie band Deerhoof to CERN’s magnet test facility, SM-18, in "honor of the LHC’s ramp up to 13 TeV." On site, Beacham wanted the band to experiment with noise and music much like his team experiments with particle physics.

“Musical curiosity is similar to scientific curiosity and, on a personal level, Deerhoof has inspired me as much as Einstein,” Beacham said in a project press release. “They’re explorers and this sense of exploration is what you feel in the air at CERN right now, and so the pairing of Deerhoof and CERN was natural.”

Read 3 remaining paragraphs | Comments

02 Oct 13:52

Amazon to ban sales of Apple TV, Google Chromecast to boost Prime Video

by Peter Bright

Starting on October 29, the Apple TV and Google Chromecast will no longer be available from Amazon.

Bloomberg reports that the online retailer sent an e-mail to its marketplace sellers telling them that it is not allowing any new postings of the devices, and the company will remove existing listings at the end of October.

"Over the last three years, Prime Video has become an important part of Prime," Amazon said in a statement explaining the change. "It's important that the streaming media players we sell interact well with Prime Video in order to avoid customer confusion. Roku, XBOX, PlayStation, and Fire TV are excellent choices."

Read 1 remaining paragraphs | Comments

29 Sep 18:54

Amazon Flex will pay you “$18-25 per hour” to deliver Prime Now packages

by Sam Machkovech

We can't tell whether that recipient's face is one of joy because she received a package within an hour or sheer terror because she got it from a random dude who makes money via Amazon's new Flex delivery program. (credit: Amazon)

If you think there's not enough self-employed driving gigs in today's Uber-style economy, Amazon has some news for you. Starting Tuesday in the company's home base of Seattle, the online shopping giant will begin paying people "$18-25 per hour" to deliver Amazon Prime Now packages out of their own cars.

The program, dubbed "Amazon Flex," will eventually launch in a number of major markets, including New York, Dallas, Chicago, Miami, Baltimore, Austin, Indianapolis, Portland, and Atlanta—in short, major Amazon Prime Now markets. Notably, no Californian cities are included in the list, though we can't be sure whether that's because of "sharing" economy pitfalls such as litigation filed by San Francisco Uber drivers about benefits they may be entitled to due to "employee" status.

According to the program's site, participating delivery men and women must own cars, have valid drivers' licenses, be over the age of 21, pass a background check, and own an Android smartphone.

Read 2 remaining paragraphs | Comments

19 Sep 15:01

My Return to Alaska

by jacob@jwfrank.com (Jacob W. Frank Photography)

Sorry it’s been so long since my last update but I have been going at it non-stop this summer. For those of you that know me or have been following me for a while, know that I work with the National Park Service. In the past I donated a significant amount of time as a photographer to over 35 national parks with the hopes that one day I would be able to do it for as my career. Well now that I have a permanent position in Glacier, I was hired for my first official detail to Wrangell-St. Elias National Park as a photographer. A detail is where another park hires you for a finite amount of time for a specific task. My detail to Wrangell was with two of my park service friends from Yellowstone and we were tasked with a media-blitz of the park. Wrangell is such a large park and their resources are limited, so they are lacking when it comes to media. I was brought out as a photographer, and my other two friends were brought out, one as a videographer and the other for audio.

We flew into Anchorage, picked up supplies for the two weeks, and then headed to the park. The initial plan was to head out to Donaho Basin for a backpacking trip, shoot some scenic over flights, then spend another few days in the Bremner historic mining district area. Inevitably, there were some bumps in the road but we were able to figure everything out as we went along.

If you’ve never been to the park, Wrangell is 13.2 million acres, the largest national park in the United States, roughly the size of Switzerland. Access is limited. There is only one main road into the center of the park, which dead ends in the town of Kennicott, a historic copper mining area. This is where we would be based out of for the next 10 days. We spent the first night in the Lodge and then packed for our backpack trip out to Donoho Basin.

Bohemian waxwing - Bombycilla garrulusBohemian waxwing - Bombycilla garrulus

Bohemian Waxwing seen along the McCarthy Road

Tundra Swans - Cygnus columbianusTundra Swans - Cygnus columbianus

Tundra Swans seen along the McCarthy Road

Kennicott Glacier view from Hotel PorchKennicott Glacier view from Hotel Porch

View from the Lodge

In order to get the Donoho basin you are required to traverse the Root glacier roughly 1 mile wide. Once on the west side of the glacier, there is a route towards series of unnamed lakes.  This is where we planned to camp because there are bear boxes. We had a bit of a late start but weren’t too worried since the sun wasn’t setting until 11pm. Hiking across the Root Glacier was a very unique experience. I have traveled next to glaciers and under glaciers, but never on a glacier. It felt exactly as I thought it would, walking on a giant piece of ice. It was fairly slow going because of the difficulty of the terrain, but also because of how scenic it was. 

Hikers on the Root GlacierHikers on the Root GlacierNPS / Jacob W. Frank

People on the Root Glacier

Backpackers Exploring the Root Glacier (8)Backpackers Exploring the Root Glacier (8)NPS / Jacob W. Frank Backpackers Exploring the Root Glacier (9)Backpackers Exploring the Root Glacier (9)NPS / Jacob W. Frank Pool on the Root GlacierPool on the Root GlacierNPS / Jacob W. Frank Backpackers Exploring the Root Glacier (12)Backpackers Exploring the Root Glacier (12)NPS / Jacob W. Frank Backpackers Exploring the Root Glacier (13)Backpackers Exploring the Root Glacier (13)NPS / Jacob W. Frank Views from the Root Glacier (3)Views from the Root Glacier (3)NPS / Jacob W. Frank Views from the Root Glacier (5)Views from the Root Glacier (5)NPS / Jacob W. Frank

We walked over rivers, along lakes, navigated through crevasses, and over moraines (all on the glacier) until we finally reached the other side. From there we needed to make a decision whether to camp or to continue to push on to the next campsite. Since it was only 5 o’clock and the map said we had 3 miles to go, we made the decision to continue. For those of you who have hiked off-trail bushwhacking in Alaska, you know that 3 miles is no easy task. We hiked, and hiked, and hiked some more, and it seemed that we were barely moving.  When one of our team members fell ill from food poisoning the night before, we decided that we would not make it to the bear boxes that we hoped to camp at and found trees to tie our food up into instead. Once camp was set up and we made dinner it was about 10:30 PM. I can honestly say that it was one of the most difficult hikes that I’ve ever done, not because of the elevation or distance, but rather the difficulty in pushing through the bush with a significantly large and heavy pack.  It seemed all the branches were reaching out to touch me and say, “Slow down, take it all in. There is no need to go so fast.” Ughh.

Lake 2 Creek Sunset and Mount BlackburnLake 2 Creek Sunset and Mount BlackburnNPS / Jacob W. Frank Mount Blackburn and Donoho Peak from Lake 2Mount Blackburn and Donoho Peak from Lake 2NPS / Jacob W. Frank Fireweed Sunset at Lake 2Fireweed Sunset at Lake 2NPS / Jacob W. Frank

When I woke up the next day and stuck my head out of the tent it was apparent that had made the right decision to push on. It was a beautiful sunrise with the perfectly still lake. It looked as if it were going to be great weather all day. We grabbed breakfast, packed our daypacks, and headed further up valley towards Gates glacier. As we made it past the second lake and eventually to the third lake we were directly alongside the Kennicott glacier. The 16K ft foot mountain Mt. Blackburn rose in the distance behind a sea of ice.

Morning Reflections from Lake 2 - Donoho BasinMorning Reflections from Lake 2 - Donoho BasinNPS / Jacob W. Frank Gates Glacier From Lake 3 - Donoho BasinGates Glacier From Lake 3 - Donoho BasinNPS / Jacob W. Frank Hiker viewing Kennicott Glacier near Wilderness Boundary - Donoho BasinHiker viewing Kennicott Glacier near Wilderness Boundary - Donoho BasinNPS / Jacob W. Frank Kennicott Glacier Crevasses with BlackburnKennicott Glacier Crevasses with BlackburnNPS / Jacob W. Frank Kennicott Glacier Lateral View - Donoho BasinKennicott Glacier Lateral View - Donoho BasinNPS / Jacob W. Frank Hiking the Kennicott Glacier Lateral Moraine (2)Hiking the Kennicott Glacier Lateral Moraine (2)NPS / Jacob W. Frank Kennicott Glacier and Hidden Creek PassKennicott Glacier and Hidden Creek PassNPS / Jacob W. Frank Panoramic View from Wilderness Boundary - Donoho BasinPanoramic View from Wilderness Boundary - Donoho BasinNPS / Jacob W. Frank

After a few hours of day hiking we decided to turn around, pack up camp, and head to our next camp spot alongside the Root glacier. This time we knew where we were going and we still managed to lose the route and ended up bushwhacking in 10+ ft tall alder. Gotta love AK.

Backpackers Near Lake 2Backpackers Near Lake 2NPS / Jacob W. Frank

Backpackers Bushwhacking in Donoho BasinBackpackers Bushwhacking in Donoho BasinNPS / Jacob W. Frank Porphyry Mountain and National Creek Rock Glacier From Donoho BasinPorphyry Mountain and National Creek Rock Glacier From Donoho BasinNPS / Jacob W. Frank

People are in the photo!!!

Blackburn From Lake 2 - Donoho BasinBlackburn From Lake 2 - Donoho BasinNPS / Jacob W. Frank

Views from first Lake and Mount Blackburn 16Kft​

Hiking the Lateral Morain of Root GlacierHiking the Lateral Morain of Root GlacierNPS / Jacob W. Frank ​Once we made back to the Root Glacier it was time for a cocktail or two and a little time to soak in the scenery.

The next morning we woke to another bluebird day. After grabbing some breakfast we only had to traverse the glacier once more, this time deciding to take an alternate route. Walking on a glacier is like being on a maze of ice. You never know when your route will dead-end. Sometimes you can find a work-around; sometimes you just have to backtrack. It makes for fun, but tiring hiking.

Tent View of the Root GlacierTent View of the Root GlacierNPS / Jacob W. Frank Backpackers Headed Towards the Root GlacierBackpackers Headed Towards the Root GlacierNPS / Jacob W. Frank Backpackers Stepping onto the Root GlacierBackpackers Stepping onto the Root GlacierNPS / Jacob W. Frank Backpackers Exploring a pool on the Root Glacier (2)Backpackers Exploring a pool on the Root Glacier (2)NPS / Jacob W. Frank Views from the Root GlacierViews from the Root GlacierNPS / Jacob W. Frank Backpackers Exploring the Root Glacier (2)Backpackers Exploring the Root Glacier (2)NPS / Jacob W. Frank Recording the Sounds of the Root GlacierRecording the Sounds of the Root GlacierNPS / Jacob W. Frank Ice Climbing on the Root GlacierIce Climbing on the Root GlacierNPS / Jacob W. Frank Ice Climbing on the Root Glacier (3)Ice Climbing on the Root Glacier (3)NPS / Jacob W. Frank

Along the way we found some spectacular scenery and the weather was perfect. So much so that I thought I could catch a tan for a little bit.

Sunbathing on the Root Glacier (2)Sunbathing on the Root Glacier (2)NPS / Jacob W. Frank Thanks to Neal Herbert for this shot of me. Check out his stuff from the trip also. He is the videographer for Yellowstone.

The next day was a day of flying. We had two flights scheduled. The first flight we would head south to the Tana River, to the Tana Glacier, Bagley Icefield, and Icy Bay before heading back along Baldwin and Chitina Glaciers.  Instead of picking my favs I put all of them in a slide show so that you can view all of them in order if you like. I have also included a map of all of our flights. This first one is labeled Lynn Flight 1. http://caltopo.com/m/031C

After landing and grabbing lunch we headed back up in the air and out towards Tebay Lakes, the Bremner River, Fan Glacier, then north past the Chitina River to Hidden Creek and the Kennicott Glacier. Here is a slide show from that flight. It’s amazing what we saw up there. I think I am forever ruined about what will excite me in the future. I can’t remember the last time I felt so blown away by what I was seeing. Oh wait, yes I can. It was in Denali NP looking at the Mountain. Alaska is awesome if you aren’t picking up what I am laying down…

The next day was spent conducting interviews of some local residents before having the chance to tour the historic Kennicott Copper Mill. This entire building is nuts. It’s a 14 story building and was used to mine the copper our of the surrounding mountains. It was the most productive copper mill in the world profiting nearly $1.5 billion in today’s dollars. Everything was vertically integrated from the mines, to the mill, to the railway to the coast, and eventual boats that would transport the copper down to Seattle.  It’s really an amazing sight to see.

The next day we would be flying into Bremner historic mining district where we would be camping for the next 3 days. We were concerned about getting stuck out there so we planned for an early pickup just incase the weather turned and we needed to spend a few extra days out there. This time we were allowed to “pack” heavy because we were not carrying all of our gear. So we brought everything including a case of beer. We had a late arrival due to our plane breaking down just before takeoff (That’s not what you want to hear about your plane before you get in it). So when we landed we spent the remaining time exploring the area around camp and hit the sack.

Backpackers Watching their Flight LeaveBackpackers Watching their Flight LeaveNPS / Jacob W. Frank Bremner Campsite (2)Bremner Campsite (2)NPS / Jacob W. Frank Wildflowers of Bremner (6)Wildflowers of Bremner (6)NPS / Jacob W. Frank Dinner Near Bremner Landing StripDinner Near Bremner Landing StripNPS / Jacob W. Frank

The next day we woke up and explored around camp for a short while before heading up to the Bremner bunkhouse and checking out all the historic garbage. When I say garbage I mean artifacts including buildings, a powerhouse, cars, tractors, stoves, tools, etc. All very cool, very heavy stuff. It’s crazy they were able to get everything out to this remote spot. The stuff is so cool in fact that they hire volunteers to live on site and make sure people don’t steal anything. We met the volunteers, and their dog companion, and had a great time chatting about their experiences so far. The wildflowers were also still blooming despite a rather dry summer so I was excited to see all the familiar faces.

Wildflowers of Bremner (3)Wildflowers of Bremner (3)NPS / Jacob W. Frank Bremner Mine EquipmentBremner Mine EquipmentNPS / Jacob W. Frank Bremner Historic DistrictBremner Historic DistrictNPS / Jacob W. Frank Taking off from Bremner Landing Strip (2)Taking off from Bremner Landing Strip (2)NPS / Jacob W. Frank Hiking from the Landing Strip (3)Hiking from the Landing Strip (3)NPS / Jacob W. Frank Bremner CrossBremner CrossNPS / Jacob W. Frank Bremner VehiclesBremner VehiclesNPS / Jacob W. Frank Bremner Equipment (2)Bremner Equipment (2)NPS / Jacob W. Frank Bremner ToolsBremner ToolsNPS / Jacob W. Frank Inside Dry HouseInside Dry HouseNPS / Jacob W. Frank

Powerhouse Equipment (4)Powerhouse Equipment (4)NPS / Jacob W. Frank Powerhouse Equipment (2)Powerhouse Equipment (2)NPS / Jacob W. Frank Powerhouse EquipmentPowerhouse EquipmentNPS / Jacob W. Frank From the mining camp we headed up to one of the area tarns that was used as an aqueduct for the area water. Along the way we saw some nice waterfalls, cool animals like ptarmigan, pika, and marmots, and some great views of the mountains. Once we were done we headed back to the bunkhouse and made a plan to hike with the volunteer couple the following day.

Waterfalls Along the Aqueduct (2)Waterfalls Along the Aqueduct (2)NPS / Jacob W. Frank Hoary MarmotHoary MarmotNPS / Jacob W. Frank Collared Pika (3) - Ochotona collarisCollared Pika (3) - Ochotona collarisNPS / Jacob W. Frank Collared Pika (2) - Ochotona collarisCollared Pika (2) - Ochotona collarisNPS / Jacob W. Frank Wildflowers Along Shore of Tarn Above AqueductWildflowers Along Shore of Tarn Above AqueductNPS / Jacob W. Frank Historic Tools in BremnerHistoric Tools in BremnerNPS / Jacob W. Frank Hikers Along Shore of Tarn Above AqueductHikers Along Shore of Tarn Above AqueductNPS / Jacob W. Frank Hiker in Aqueduct DrainageHiker in Aqueduct DrainageNPS / Jacob W. Frank

The next day we woke up to the entire valley covered in fog. We took the old mining road up to another site where they used to mine for gold. As we went up in elevation we hike out of the fog and the sun was burning off what remained. Immediately when we made it into the cirque basin I noticed more pika, ptarmigan, and marmots. The ptarmigan were everywhere in fact. We noticed that the rock ptarmigan at higher elevations were not as skittish as the willow ptarmigan at lower elevations. In fact they seemed to like us. We even had a few chicks walk right up to us and scope us out. After a beautiful day of hiking we headed back to camp and waited for the plane to pick us up. 

Camping in the FogCamping in the FogNPS / Jacob W. Frank Wildflowers of Bremner (7)Wildflowers of Bremner (7)NPS / Jacob W. Frank Old Chevy in the Bremner DistrictOld Chevy in the Bremner DistrictNPS / Jacob W. Frank Rock Ptarmigan and Chicks - Lagopus mutaRock Ptarmigan and Chicks - Lagopus mutaNPS / Jacob W. Frank Wildflowers of BremnerWildflowers of BremnerNPS / Jacob W. Frank Taking off from Bremner Landing StripTaking off from Bremner Landing StripNPS / Jacob W. Frank Once we were back in McCarthy we headed out for dinner and dumped our memory cards in preparation for our final day of flying.

The weather was a little iffy but since we didn’t have a particular agenda for this flight we were able to seek out the good weather. We went up the Nizina River to the Nizina, Federika, and Russel Glaciers via Skolai pass and then over to the Bonanza Ridge area including the Stairway Icefall, Root/Gates/Kennicott glaciers. This day wasn’t as spectacular as the other flights, but it was still a good opportunity to shoot some other areas of the park we had yet to see.

I mentioned that we had the chance to head out to Bremner for our overnight trip but we were supposed to hit Skolai Pass area also. I didn’t really know what I was missing until this flight. If you go to Wrangell for a fly-in trip, Skolai is like a mini Switzerland. If I get the chance to go back I hope that I can get a few days in that area.

After that flight our trip was pretty much over. We turned in all of our flight equipment, headed back to Anchorage and the regional office to drop off the car. Then we headed out for some celebratory drinks. We had no car so we didn’t need to worry about a DD so we were all having a great time. So much so that when I ordered my 3rd or 4th drink I felt really tipsy, even sitting down. I looked at my drink and thought to myself, I better slow down here a little. Then I looked up and realized that I wasn’t the only one feeling this way. It wasn’t the alcohol making me feel tipsy but rather we were in the middle of a 6.3 magnitude earthquake. The ENTIRE building was shaking and people started standing up. Apparently that is a thing? After that we headed out to dinner and had a few more drinks before calling it a night to make our early flights the next morning.

Overall I shot around 6500 photos in 10 days pairing that down to about 500. The majority of those shots came during the scenic flights. It was totally amazing to see this park from the air. You lose all sense of scale when you are up there. Mountains that look close enough to crash into are a quarter mile away. Icebergs the size of houses are just dots in the bay. It’s the only way to really “see” the majority of the park. It’s a wild and untamed place. You could take any individual feature from this park whether it’s a mountain, waterfall, glacier, lake, etc. and place it in the lower 48 and it would be its own National Park. But here, it’s just another unnamed feature. Alaska really is the last frontier. It’s so freaking big and majestic that you can’t help but be humbled by it.

Going back to Alaska was like a breath of fresh air. It reminded me why I do what I do and was the first realization that all of the hard work and dedication I had put in the past few years as a volunteer was starting to pay off. It also sounds like there is opportunity to return to Alaska next summer for a chance to work with a different park, possibly Lake Clark or Katmai. In the meantime I have a few weeks left of work here in Glacier before I am on furlough for the month of October. During that time I will be in Rocky Mountain, Arches, and Canyonlands National Parks. If you are in the area and would like to meet up for a drink, hike, or drink while hiking just let me know! Thanks again for following along with my travels and sorry it’s been so long. I hope to push out another post about my summer in Glacier soon as well. 

Cheers and happy travels!


13 Sep 21:11

The Higher Life

Edenovellis

Meditation apps and Silicon Valley.

13 Sep 21:11

The Pixel Factory

Edenovellis

Pretty awesome way to give an animated talk. Also some good explanations about basic computer graphics, differential geometry, webGL.

10 Sep 03:47

Lessons in statistical significance, uncertainty, and their role in science

by Nathan Yau

p-hacking

Science is hard. Statistics is hard. Proving cause and effect is hard. Christie Aschwanden for FiveThirtyEight, with graphics by Ritchie King, discusses the uncertainty in data and the challenge of answering seemingly straightforward questions via the scientific method.

Leading the article is a description of p-hacking. Mess around with variables enough, and you too can get a p-value low enough to publish results in a distinguished journal.

A fine interactive lets you try this yourself, showing that the political party in office affects the economy. The funny part is that you can easily “prove” that both parties are good for the economy.

Which political party is best for the economy seems like a pretty straightforward question. But as you saw, it’s much easier to get a result than it is to get an answer. The variables in the data sets you used to test your hypothesis had 1,800 possible combinations. Of these, 1,078 yielded a publishable p-value, but that doesn’t mean they showed that which party was in office had a strong effect on the economy. Most of them didn’t.

The p-value reveals almost nothing about the strength of the evidence, yet a p-value of 0.05 has become the ticket to get into many journals. “The dominant method used [to evaluate evidence] is the p-value,” said Michael Evans, a statistician at the University of Toronto, “and the p-value is well known not to work very well.”

I guess that means we have to think more like a statistician and less like a brainless, hypothesis-testing robot.

Worth the full read.

Tags: FiveThirtyEight, p-value, uncertainty

08 Sep 04:06

Why Can’t You Wear White After Labor Day?Everyone has heard the...

by derekguypto


Why Can’t You Wear White After Labor Day?

Everyone has heard the phrase “no white after Labor Day.” The idea comes from a time when Americans used to bracket summer with Memorial Day on one end, and Labor Day on the other. But how did the actual rule come about? Time Magazine has a nice piece that explores some of the more popular theories:

One common explanation is practical. For centuries, wearing white in the summer was simply a way to stay cool — like changing your dinner menu or putting slipcovers on the furniture. “Not only was there no air-conditioning, but people did not go around in T shirts and halter tops. They wore what we would now consider fairly formal clothes,” says Judith Martin, better known as etiquette columnist Miss Manners. “And white is of a lighter weight.”

But beating the heat became fashionable in the early to mid-20th century, says Charlie Scheips, author of American Fashion. “All the magazines and tastemakers were centered in big cities, usually in northern climates that had seasons,” he notes. In the hot summer months, white clothing kept New York fashion editors cool. But facing, say, heavy fall rain, they might not have been inclined to risk sullying white ensembles with mud — and that sensibility was reflected in the glossy pages of Harper’s Bazaar and Vogue, which set the tone for the country.

This is all sound logic, to be sure — but that’s exactly why it may be wrong. “Very rarely is there actually a functional reason for a fashion rule,” notes Valerie Steele, director of the Museum at the Fashion Institute of Technology. True enough: it’s hard to think of a workaday downside to pairing your black shoes with a brown belt.

Instead, other historians speculate, the origin of the no-white-after–Labor Day rule may be symbolic. In the early 20th century, white was the uniform of choice for Americans well-to-do enough to decamp from their city digs to warmer climes for months at a time: light summer clothing provided a pleasing contrast to drabber urban life. “If you look at any photograph of any city in America in the 1930s, you’ll see people in dark clothes,” says Scheips, many scurrying to their jobs. By contrast, he adds, the white linen suits and Panama hats at snooty resorts were “a look of leisure.”

[…]

By the 1950s, as the middle class expanded, the custom had calcified into a hard-and-fast rule. Along with a slew of commands about salad plates and fish forks, the no-whites dictum provided old-money élites with a bulwark against the upwardly mobile. But such mores were propagated by aspirants too: those savvy enough to learn all the rules increased their odds of earning a ticket into polite society. “It [was] insiders trying to keep other people out,” says Steele, “and outsiders trying to climb in by proving they know the rules.”

You can read the rest here.

(pictured above: David Byrne of the Talking Heads in a seersucker suit)

08 Sep 04:04

Matlab/Octave and Python demos for BDA3

by Aki Vehtari

My Bayesian Data Analysis course at Aalto University started today with a record number of 84 registered students!

In my course I have used some Matlab/Octave demos for several years. This summer Tuomas Sivula translated most of them to Python and Python notebook.

Both Matlab/Octave and Python demos are now available at Github in hope they are helpful for someone else, too. Python notebooks can also be viewed directly at Github with pre-generated figures displayed next to the code.

Matlab/Octave demos
Python demos


The post Matlab/Octave and Python demos for BDA3 appeared first on Statistical Modeling, Causal Inference, and Social Science.

07 Sep 14:09

Hands-on: Sony’s Wena is a handsome mechanical watch with a smartwatch strap

by Mark Walton

Sony’s Wena (unfortunately pronounced “wiener”) putting all the "smart" parts of the watch into the wrist strap, and pairs it with a Citizen-designed watch. We’ve got more on the Wena here.

6 more images in gallery

There wasn't exactly a shortage of smartwatches at this year's IFA, what with the likes of the new Moto 360 and Samsung Gear S2 both getting a public unveiling. But Sony's Wena—one of the first products to emerge out of the company's internal crowdfunding platform First Flight—does things rather differently. Wena, which stands for the slightly cringeworthy "Wear Electronic Natural," takes the smartwatch concept and turns its on its head, putting all the "smart" parts of the watch into the wrist strap, rather than the watch face.

The result is a watch that, well, looks like a watch, and a very handsome one at that too. That's thanks in part to Japanese watchmaker Citizen, which helped with the weighty and expensive stainless steel design. The Wena is, however, rather masculine in design, and those with smaller wrists may still find its 42mm face a little too big, even if it’s far smaller than a Moto 360. The front of watch does one thing, and one thing only: tell the time. There are some basic chronograph functions, too, but the meat of the Wena's functionality lies in the wrist strap.

Stuffing the contents of a smartwatch into the wrist strap isn't an entirely new idea—see the likes of the IWC Connect and Montblanc's Urban Speed e-Strap—but it is the most elegant implementation by far. Built into the clasp of the watch is a LED strip, as well as a sophisticated vibration motor, which Sony says will allow for various different types of vibration to be assigned to different notifications. For example, if you received a WhatsApp message on your phone, the Wena's LED strip could light up green, and then pulse your wrist three times to alert you.

Read 4 remaining paragraphs | Comments

06 Sep 16:19

How to Catch Spoofers who Manipulate Markets

03 Sep 16:46

To understand the replication crisis, imagine a world in which everything was published.

by Andrew

Eastern_Grey_Kangaroo_Young_Waiting

John Snow points me to this post by psychology researcher Lisa Feldman Barrett who reacted to the recent news on the non-replication of many psychology studies with a contrarian, upbeat take, entitled “Psychology Is Not in Crisis.”

Here’s Barrett:

An initiative called the Reproducibility Project at the University of Virginia recently reran 100 psychology experiments and found that over 60 percent of them failed to replicate — that is, their findings did not hold up the second time around. . . .

But the failure to replicate is not a cause for alarm; in fact, it is a normal part of how science works. . . . Science is not a body of facts that emerge, like an orderly string of light bulbs, to illuminate a linear path to universal truth. Rather, science (to paraphrase Henry Gee, an editor at Nature) is a method to quantify doubt about a hypothesis, and to find the contexts in which a phenomenon is likely. Failure to replicate is not a bug; it is a feature. It is what leads us along the path — the wonderfully twisty path — of scientific discovery.

All this is fine. Indeed, I’ve often spoken of the fractal nature of science: at any time scale, whether it be minutes or days or years, we see a mix of forward progress and sudden shocks, realizations that much of what we’ve thought was true, isn’t. Scientific discovery is indeed both wonderful and unpredictable.

But Barrett’s article disturbs me too, for two reasons. First, yes, failure to replicate is a feature, not a bug—but only if you respect that feature, if you take the failure to replicate to reassess your beliefs. But if you just complacently say it’s no big deal, then you’re not taking the opportunity to learn.

Here’s an example. The recent replication paper by Nosek et al. had many examples of published studies that did not replicate. One example was described in Benedict Carey’s recent New York Times article as follows:

Attached women were more likely to rate the attractiveness of single men highly when the women were highly fertile, compared with when they were less so. In the reproduced studies, researchers found weaker effects for all three experiments.

Carey got a quote from the author of that original study. To my disappointment, the author did not say something like, “Hey, it looks like we might’ve gone overboard on that original study, that’s fascinating to see that the replication did not come out as we would’ve thought.” Instead, here’s what we got:

In an email, Paola Bressan, a psychologist at the University of Padua and an author of the original mate preference study, identified several such differences — including that her sample of women were mostly Italians, not American psychology students — that she said she had forwarded to the Reproducibility Project. “I show that, with some theory-required adjustments, my original findings were in fact replicated,” she said.

“Theory-required adjustments,” huh? Unfortunately, just about anything can be interpreted as theory-required. Just ask Daryl Bem.

We can actually see what the theory says. Philosopher Deborah Mayo went to the trouble to look up Bressan’s original paper, which said the following:

Because men of higher genetic quality tend to be poorer partners and parents than men of lower genetic quality, women may profit from securing a stable investment from the latter, while obtaining good genes via extra pair mating with the former. Only if conception occurs, however, do the evolutionary benefits of such a strategy overcome its costs. Accordingly, we predicted that (a) partnered women should prefer attached men, because such men are more likely than single men to have pair-bonding qualities, and hence to be good replacement partners, and (b) this inclination should reverse when fertility rises, because attached men are less available for impromptu sex than single men.

Nothing at all about Italians there! Apparently this bit of theory requirement wasn’t apparent until after the replication didn’t work.

What if the replication had resulted in statistically significant results in the same direction as expected from the earlier, published paper? Would Bressan have called up the Replication Project and said, “Hey—if the results replicate under these different conditions, something must be wrong. My theory requires that the model won’t work with American college students!” I really really don’t think so. Rather, I think Bressan would call it a win.

And that’s my first problem with Barrett’s article. I feel like she’s taking a heads-I-win, tails-you-lose position. A successful replication is welcomed as a confirmation, an unsuccessful replication indicates new conditions required for the theory to hold. Nowhere does she consider the third option: that the original study was capitalizing on chance and in fact never represented any general pattern in any population. Or, to put it another way, that any true underlying effect is too small and too variable to be measured by the noisy instruments being used in some of those studies.

As the saying goes, when effect size is tiny and measurement error is huge, you’re essentially trying to use a bathroom scale to weigh a feather—and the feather is resting loosely in the pouch of a kangaroo that is vigorously jumping up and down.

My second problem with Barrett’s article is at the technical level. She writes:

Suppose you have two well-designed, carefully run studies, A and B, that investigate the same phenomenon. They perform what appear to be identical experiments, and yet they reach opposite conclusions. Study A produces the predicted phenomenon, whereas Study B does not. . . . Does this mean that the phenomenon in question is necessarily illusory? Absolutely not. If the studies were well designed and executed, it is more likely that the phenomenon from Study A is true only under certain conditions [emphasis in the original].

At one level, there is nothing to disagree with here. I don’t really like the presentation of phenomena as “true” or “false”—pretty much everything we’re studying in psychology has some effect—but, in any case, all effects vary. The magnitude and even the direction of any effect will vary across people and across scenarios. So if we interpret the phrase “the phenomenon is true” in a reasonable way, then, yes, it will only be true under certain conditions—or, at the very least, vary in importance across conditions.

The problem comes when you look at specifics. Daryl Bem found some comparisons in his data which, when looked in isolation, were statistically significant. These patterns did not show up in replication. Satoshi Kanazawa found a correlation between beauty in sex ratio in a certain dataset. When he chose a particular comparison, he found p less than .05. What do we learn from this? Do we learn that, in the general population, beautiful parents are more likely to have girls? No. The most we can learn is that the Journal of Theoretical Biology can be fooled into publishing patterns that come from noise. (His particular analysis was based on a survey of 3000 people. A quick calculation using prior information on sex ratios shows that you would need data on hundreds of thousands of people to estimate any effect of the sort that he was looking for.) And then there was the himmicanes and hurricanes study which, ridiculous as it was, falls well within the borders of much of the theorizing done in psychology research nowadays. And so on, and so on, and so on.

We could let Barrett off the hook on the last quote above because she does qualify her statement with, “If the studies were well designed and executed . . .” But there’s the rub. How do we know if a study was well designed and executed? Publication in Psychological Science, or PPNAS is not enough—lots and lots of poorly designed and executed studies appear in these journals. It’s almost as if the standards for publication are not just about how well designed and executed a study is, but also about how flashy are the claims, and whether there is a “p less than .05” somewhere in the paper. It’s almost as if reviewers often can’t tell whether a study is well designed and executed. Hence the demand for replication, hence the concern about unreplicated studies, or studies that for mathematical reasons are essentially dead on arrival because the noise is so much greater than the signal.

Imagine a world in which everything was published

A close reading of Barrett’s article reveals the centrality of the condition that studies be “well designed and executed,” and lots of work by statisticians and psychology researchers in recent years (Simonsohn, Button, Nosek, Wagenmakers, etc etc) has made it clear that current practice, centered on publication thresholds (whether it be p-value or Bayes factor or whatever), won’t do so well at filtering out the poorly designed and executed studies.

To discourage or disparage or explain away failed replications is to give a sort of “incumbency advantage” to published claims, which puts a burden on the publication process that it cannot really handle.

To better understand what’s going on here, imagine a thought experiment where everything is published, where there’s no such thing as Science or Nature or Psychological Science or JPSP or PPNAS; instead, everything’s published on Arxiv. Every experiment everyone does. And with no statistical significance threshold. In this world, nobody has ever heard of inferential statistics. All we see are data summaries, regressions, etc., but no standard errors no posterior probabilities, no p-values.

What would we do then? Would Barrett reassure us that we shouldn’t be discouraged by failed replications, that everything already published (except, perhaps, for “a few bad eggs”) be taken as likely to be true? I assume (hope) not. The only way this sort of reasoning can work is if you believe the existing system screens out the bad papers. But the point of various high-profile failed replications (for example, in the field of embodied cognition) is that, no, the system does not work so well. This is one reason the replication movement is so valuable, and this is one reason I’m so frustrated by people who dismiss replications or who claim that replications show that “the system works.” It only works if you take the information from the failed replications (and the accompanying statistical theory, which is the sort of thing that I work on) and do something about it!

As I wrote in an earlier discussion on this topic:

Suppose we accept this principle [that published results are to be taken as true, even if they fail to be replicated in independent studies by outsiders]. How, then, do we treat an unpublished paper? Suppose someone with a Ph.D. in biology posts a paper on Arxiv (or whatever is the biology equivalent), and it can’t be replicated? Is it ok to question the original paper, to treat it as only provisional, to label it as unreplicated? That’s ok, right? I mean, you can’t just post something on the web and automatically get the benefit of the doubt that you didn’t make any mistakes. Ph.D.’s make errors all the time (just like everyone else). . . .

Now we can engage in some salami slicing. According to Bissell (as I interpret here), if you publish an article in Cell or some top journal like that, you get the benefit of the doubt and your claims get treated as correct until there are multiple costly, failed replications. But if you post a paper on your website, all you’ve done is make a claim. Now suppose you publish in a middling journal, say, the Journal of Theoretical Biology. Does that give you the benefit of the doubt? What about Nature Neuroscience? PNAS? Plos-One? I think you get my point. A publication in Cell is nothing more than an Arxiv paper that happened to hit the right referees at the right time. Sure, approval by 3 referees or 6 referees or whatever is something, but all they did is read some words and look at some pictures.

It’s a strange view of science in which a few referee reports is enough to put something into a default-believe-it mode, but a failed replication doesn’t count for anything.

I’m a statistician so I’ll conclude with a baseball analogy

Bill James once wrote with frustration about humanist-style sportswriters, the sort of guys who’d disparage his work and say they didn’t care about the numbers, that they cared about how the athlete actually played. James’s response was that if these sportswriters really wanted to talk baseball, that would be fine—but oftentimes their arguments ended up having the form: So-and-so hit .300 in Fenway Park one year, or so-and-so won 20 games once, or whatever. His point was that these humanists were actually making their arguments using statistics. They were just using statistics in an uninformed way. Hence his dictum that the alternative to good statistics is not “no statistics,” it’s “bad statistics.”

That’s how I feel about the people who deny the value of replications. They talk about science and they don’t always want to hear my statistical arguments, but then if you ask them why we “have no choice but to accept” claims about embodied cognition or whatever, it turns out that their evidence is nothing but some theory and a bunch of p-values. Theory can be valuable but it won’t convince anybody on its own; rather, theory is often a way to interpret data. So it comes down to the p-values.

Believing a theory is correct because someone reported p less than .05 in a Psychological Science paper is like believing that a player belongs in the Hall of Fame because hit .300 once in Fenway Park.

This is not a perfect analogy. Hitting .300 anywhere is a great accomplishment, whereas “p less than .05” can easily represent nothing more than an impressive talent for self-delusion. But I’m just trying to get at the point that ultimately it is statistical summaries and statistical models that are being used to make strong (and statistical ridiculous) claims about reality, hence statistical criticisms, and external data such as come from replications, are relevant.

If, like Barrett, you want to dismiss replications and say there’s no crisis in science: Fine. But then publish everything and accept that all data are telling you something. Don’t privilege something that happens to have been published once and declare it true. If you do that, and you follow up by denying the uncertainty that is revealed by failed replications (and was earlier revealed, on the theoretical level, by this sort of statistical analysis), well, then you’re offering nothing more than complacent happy talk.

P.S. Fred Hasselman writes:

I helped analyze the replication data of the Bressan & Stranieri study.

There were two replication samples:

›Original effect is a level comparison after a 2x2x2 ANOVA:
›F(1, 194) = 7.16, p = .008, f = 0.19
t(49) = 2.45, p = .02, Cohen’s d = 0.37

›Replication 1 in-lab with N=263, Power > 99%, Cohen’s d = .06
›Replication 2 on-line with N=317, Power > 99%, Cohen’s d = .09

Initially I did not have the time to read the entire article. I recently did, because I wanted to use the study as an example in a lecture.

I completely agree with the comparisons to Bem-logic.
What I ended up doing is showing the original materials and elaborating on the theory behind the hypothesis during the lecture.

After seeing the stimuli, learning about the hypothesis, but before learning about the replication studies, there was a consensus among students (99% female) that claims like the first sentence of the abstract should disqualify the study as a serious work of science:

ABSTRACT—Because men of higher genetic quality tend to be poorer partners and parents than men of lower genetic quality, women may profit from securing a stable investment from the latter, while obtaining good genes via extrapair mating with the former.

Really.
Think about it.
Men of higher genetic quality are poorer partners and parents.
That’s a fact you know.
And this genetic quality of men (yes, they mean attractiveness) is why women want their babies, more so than babies from their current partner (the ugly variety of men, but very sweet and good with kids).

My brain hurts.

Thankfully the conclusion is very modest:
In humans’ evolutionary past, the switch in preference from less to more sexually accessible men associated with each ovulatory episode would have been highly adaptive. Our data are consistent with the idea that, although the length of a woman’s reproductive lifetime and the extent of the potential mating network have expanded considerably over the past 50,000 years, this unconscious strategy guides women’s mating choices still.

Erratum: We meant ‘this unconscious strategy guides Italian women’s mating choices still’.

Dayum.

The post To understand the replication crisis, imagine a world in which everything was published. appeared first on Statistical Modeling, Causal Inference, and Social Science.

03 Sep 16:39

Every Neuron is Special

by mikioaoi
A couple of weeks ago I presented A category-free neural population supports evolving demands during decision-making by David Raposo, Matthew Kaufman and Anne Churchland.  By “categories” they are referring to some population of cells whose responses during an experiment seem to be … Continue reading →
02 Sep 16:18

Comparing Artificial Artists — Medium

Edenovellis

how to make visual mashups using neural nets, see: https://twitter.com/kcimc/status/638877262092337152/photo/1

29 Aug 02:39

Square mile grid-ness of the United States

by Nathan Yau

Jefferson Grid

Named after the grid system Thomas Jefferson used to apportion land acquired through the Louisiana purchase, the Jefferson Grid Instagram account highlights remnants of the system through satellite shots from Google Earth. Each picture is the land that fits into one square mile.

The most fun ones more me are the desert shots. It's a square mile of development and just dirt everywhere else.

Tags: grid, Thomas Jefferson

28 Aug 14:38

New paper on psychology replication

by Andrew

Blade_Runner_poster

The Open Science Collaboration, a team led by psychology researcher Brian Nosek, organized the replication of 100 published psychology experiments. They report:

A large portion of replications produced weaker evidence for the original findings despite using materials provided by the original authors, review in advance for methodological fidelity, and high statistical power to detect the original effect sizes.

“Despite” is a funny way to put it. Given the statistical significance filter, we’d expect published estimates to be overestimates. And then there’s the garden of forking paths, which just makes things more so. It would be meaningless to try to obtain a general value for the “Edlin factor” but it’s gotta be less than 1, so of course exact replications should produce weaker evidence than claimed from the original studies.

Things may change if and when it becomes standard to report Bayesian inferences with informative priors, but as long as researchers are reporting selected statistically-significant comparisons—and, no, I don’t think that’s about to change, even with the publication and publicity attached to this new paper—we can expect published estimates to be overestimates.

That said, even though these results are no surprise, I still think they’re valuable.

As I told Monya Baker in an interview for a news article, “this new work is different from many previous papers on replication (including my own) because the team actually replicated such a large swathe of experiments. In the past, some researchers dismissed indications of widespread problems because they involved small replication efforts or were based on statistical simulations. But they will have a harder time shrugging off the latest study, the value of this project is that hopefully people will be less confident about their claims.”

Nosek et al. provide some details in their abstract:

The mean effect size of the replication effects was half the magnitude of the mean effect size of the original effects, representing a substantial decline. Ninety-seven percent of original studies had significant results. Thirty-six percent of replications had significant results; 47% of original effect sizes were in the 95% confidence interval of the replication effect size; 39% of effects were subjectively rated to have replicated the original result; and if no bias in original results is assumed, combining original and replication results left 68% with statistically significant effects.

This is all fine, again the general results are no surprise but it’s good to see some hard numbers with real experiments. The only thing that bothers me in the above sentence is the phrase, “if no bias in original results is assumed . . .” Of course there is bias in the original results (see discussion above), so this just seems like a silly assumption to make. I think I know where the authors are coming from—they’re saying, even if there was no bias, there’d be problems—but really the no-bias assumption makes no sense given the statistical significance filter, so this seems unnecessary.

Anyway, great job! This was a big effort and it deserves all the publicity it’s getting.

Disclaimer: I am affiliated with the Open Science Collaboration. I’m on the email list, and at one point I was one of the zillion authors of the article. At some point I asked to be removed from the author list, as I felt I hadn’t done enough—I didn’t do any replication, nor did I do any data analysis, all I did was participate in some of the online discussions. But I do feel generally supportive of the project and am happy to be associated with it in whatever way that is.

The post New paper on psychology replication appeared first on Statistical Modeling, Causal Inference, and Social Science.

28 Aug 14:22

Should police have the capability to take control of driverless cars?

by David Kravets

Driverless cars might be the norm some day—sooner than we think. So it's never too early to consider futuristic scenarios of a driverless car world.

There have already been plenty of ethical questions asked, like whether a driverless car should decide who lives or who dies during an accident scenario. One question often posed is whether a driverless vehicle could choose to ram a school bus full of kids or sacrifice the driverless vehicle's occupants during a mishap.

Now the Rand Corp. is thinking about how law enforcement officials should deal with driverless cars. A recent study (PDF) by the group ponders whether a cop should have the ability to remotely control a vehicle to pull it over.

Read 6 remaining paragraphs | Comments

28 Aug 14:14

100 psychology experiments repeated, less than half successful

by Cathleen O'Grady

Since November 2011, the Center for Open Science has been involved in an ambitious project: to repeat 100 psychology experiments and see whether the results are the same the second time round. The first wave of results will be released in tomorrow’s edition of Science, reporting that fewer than half of the original experiments were successfully replicated.

The studies in question were from social and cognitive psychology, meaning that they don’t have immediate significance for therapeutic or medical treatments. However, the project and its results have huge implications in general for science, scientists, and the public. The key takeaway is that a single study on its own is never going to be the last word, said study coordinator and psychology professor Brian Nosek.

“The reality of science is we're going to get lots of different competing pieces of information as we study difficult problems,” he said in a public statement. “We're studying them because we don't understand them, and so we need to put in a lot of energy in order to figure out what's going on. It's murky for a long time before answers emerge.”

Read 21 remaining paragraphs | Comments

26 Aug 17:53

Massachusetts parents cite shaky science in lawsuit over Wi-Fi network

by John Timmer

Despite years of study, there is no clear evidence that exposure to the photons emitted by devices like cell phones and wireless networks pose any health risk whatsoever. That hasn't stopped people from concluding they are sensitive to these electromagnetic emissions and taking various actions to avoid them. While some of these people have moved to areas with low levels of this radiation, others have tried to force the rest of society to accommodate them.

In the latest instance of this, a Massachusetts couple has sued their child's school, claiming that its "industrial-capacity" Wi-Fi system was causing health problems. The suit hopes to have "Electromagnetic Hypersensitivity Syndrome" defined as falling under the protections of the Americans with Disabilities Act.

The suit targets the Fay School, a pricey Massachusetts boarding school (families of younger students can pay $25,000 a year and up for them to attend during the day, while full boarding is offered for older students at $60,000). Fay has students use Chromebooks and tablets during classes and provides the devices with Internet access through a Wi-Fi network. In 2013, Fay upgraded its network to what the suit describes as "a high-density, industrial-capacity wireless system."

Shortly thereafter, the suit alleges that the child, called "G" to preserve his anonymity, began experiencing health problems, including headaches, nose bleeds, dizziness, chest pains, and nausea. This led to frequent visits to the school nurse's office, but the suit claims that symptoms declined once the child was home from school. (The suit claims that shifting from 2.5GHz frequencies to a 5GHz network "doubled the prior emissions."

According to the suit, G's "Mother concluded, after much research and study, that Fay’s Wi-Fi was the probable cause of G’s symptoms." The parents later found a doctor that specialized in environmental health who diagnosed the child as having "electromagnetic hypersensitivity." At this point, the parents asked Fay to visit G's classrooms so they could suggest ways of minimizing his exposure, like wiring the classrooms for ethernet.

The lawsuit alleges that the parents' concerns were met with a "hostile attitude." The school refused their request to visit the classrooms. It also asked that the parents take the child to doctors it selected; these either didn't accept that there was any scientific basis for accepting electromagnetic hypersensitivity existed or hadn't even heard of it. Finally, Fay threatened to ban the parents from a school-hosted e-mail list and keep their child from re-enrolling if they continued to bring up their concerns.

The parents allege that this behavior violates the school's contractual obligations to its student. But more significantly, they claim that electromagnetic hypersensitivity is a disability under the Americans with Disabilities Act. They're suing for damages, fees, and to force the school to take action.

What to make of all of this? The parents claim that "The evidence that will be produced at a hearing or at trial will show that it is very probable that G has EHS caused by the high-density Wi-Fi emissions from the Fay Wi-Fi system and devices." But they've also undoubtedly read the Wikipedia entry on this supposed disorder, which summarizes the scientific evidence nicely: people who claim to have the disorder simply can't tell whether equipment that emits this radiation is switched on or not.

Beyond that, there really isn't a plausible biological mechanism by which this low-energy radiation can cause changes to cells beyond heating them. In short, the doctors suggested by the school had it right: there's no compelling evidence that this syndrome exists. And it's not simply Wikipedia that says so; scientific organizations that have looked into this issue have come to the same conclusions.

To counter that, the suit attaches letters from a handful of academics who are convinced EMS is real. It also cites an organization dedicated to claiming this radiation is dangerous, a report from a journalist, and a press release. Overall, their case doesn't look convincing on these grounds.

As for the school's behavior, it's hard to judge based on what is undoubtedly a one-sided presentation. Without evidence regarding the parents' behavior at school or on the mailing list, it's tough to judge whether the school was simply trying to keep G's parents from inciting the rest of the community.

The final issue is the Americans with Disabilities Act. The suit quotes approvingly from documents issued by the US government's Access Board (such as this one) in which the agency seems to suggest things like electrosensitivity may fall under the ADA. But the phrasing is critical, and the board's statements consist of language such as "may be considered disabilities under the ADA." And even the suit recognizes that "In creating these guidelines, the Board takes into consideration those diagnoses that could be considered disabilities under the ADA definition" (emphasis ours).

In other words, the Board is simply stating that, should these diagnoses be confirmed, they could be considered disabilities. But that shifts things back to the question of whether this is a valid diagnosis—and, as we noted above, that contention is on pretty shaky scientific ground.

A copy of the suit has been posted online.

25 Aug 15:42

“Can you change your Bayesian prior?”

by Andrew

Deborah Mayo writes:

I’m very curious as to how you would answer this for subjective Bayesians, at least. I found this section of my book showed various positions, not in agreement.

I responded on her blog:

As we discuss in BDA and elsewhere, one can think of one’s statistical model, at any point in time, as a placeholder, an approximation or compromise given constraints of computation and of expressing one’s model. In many settings the following iterative procedure makes sense:

1. Set up a placeholder model (that is, whatever statistical model you might fit).

2. Perform inference (no problem, now that we have Stan!).

3. Look at the posterior inferences. If some of the inferences don’t “make sense,” this implies that you have additional information that has not been incorporated into the model. Improve the model and return to step 1.

If you look carefully you’ll see I said nothing about “prior,” just “model.” So my answer to your question is: Yes, you can change your statistical model. Nothing special about the “prior.” You can change your “likelihood” too.

And Mayo responded:

Thanks. But surely you think it’s problematic for a subjective Bayesian who purports to be coherent?

I wrote back: No, subjective Bayesianism is inherently incoherent. As I’ve written, if you could in general express your knowledge in a subjective prior, you wouldn’t need Bayesian Data Analysis or Stan or anything else: you could just look at your data and write your subjective posterior distribution. The prior and the data models are just models, they’re not in practice correct or complete.

More here on noninformative priors.

And here’s an example of the difficulty of throwing around ideas like “prior probability” without fully thinking them through.

The post “Can you change your Bayesian prior?” appeared first on Statistical Modeling, Causal Inference, and Social Science.