Jakienle
Shared posts
Wine School: The Aligoté Defense Rests

First phase of housing effort aimed at educators nears completion

Ford Aims to Revive a Detroit Train Station, and Itself

The Feed: Cheers To Shift Drink Podcast
 » Shift Drink Podcast was nominated for a Spirited Award in the Best Broadcast, Podcast, or Online Video Series by the Tales of the Cocktails Foundation. The liquor-themed show is hosted by local restaurateur Ed Rudisell (Black Market, Rook, Siam Square, The Inferno Room) and Indiana Craft Beverage Association founder and president Arthur Black. The awards honor the best bars, bartenders, writers, and experts in the hospitality industry, and winners will be announced on July 21 in New Orleans. » Beholder (1844 E. 10th St.), the dinner-only follow-up to chef Jonathan Brooks’s Milktooth, opened last week. Brooks and his partner in the restaurant, sommelier Josh Mazanowski, are accepting reservations and limited walk-in seating. WE ARE NOW ACCEPTING WALK INS ON A FIRST COME FIRST SERVE…View Original Post
An Appraisal: Anthony Bourdain Was a Teller of Often Unappetizing Truths

Redwood Alert
 It’s not every day that a Harry Cooler–designed residence hits the market. The late Cooler was instrumental in bringing modern home design to the state starting in 1950, and went on to earn a national reputation. He created 20 contemporary homes throughout Indianapolis, Carmel, Greenwood, and Lake Tippecanoe, spanning the architectural gamut. In 1988, he was awarded the Sagamore of the Wabash for his firm’s restoration of the Indiana State Capitol. A 1956 gem designed by Cooler has it all: gobs of natural light from floor-to-ceiling windows, an abundance of earthy design elements like wood and stone, and a serene forested setting of about two and a half acres in sought-after Brendonwood. The layout of the home is clean and deliberate—the original owners had a…View Original Post
Let Me Swish That For You

Sears at Castleton Closes: How to Rethink the Space Amidst the Retail Apocalypse
We knew it was going to happen eventually.
Sears Holdings Company recently announced the latest wave of closures for its two flagship department stores—Sears and Kmart—and they did not spare metro Indy from the chopping block. This time around, the Sears is closing at Castleton Square Mall, the largest and, in most regards, the best-known mall in the region. Once Sears is gone, the chain will only have one location left in the entire metro of two million: down on the south side, at Greenwood Park Mall.
We could assert that Sears’ departure is a huge blow to Castleton, but the company has been ringing the death knell for about a decade. No increase in vacancy is ever a good sign, but Sears has been such a weak link for such a long time, I blogged about its underperformance at Castleton almost a decade ago.


Back then, I noticed that most of Castleton appeared to be thriving—except for the wing of the mall with a hallway that terminated at Sears. While most of the mall featured nationally recognized middle-market brands like Lane Bryant or New York and Company, the Sears hallway mostly contained local obscurities: KT Sports, Unplugged, Nirvana. One vacant space didn’t even get used for a retailer any more; it just hosted a bunch of candy machines.

The gap between Sears and the rest of the mall was so noticeable that I speculated that rents were lower on the Sears hallway, since it didn’t get as much foot traffic. The hallway also had the highest vacancy levels in the mall.
But this condition wasn’t unique to Castleton. A few months later, I noticed more or less the same situation at the Mall at Cortana in Baton Rouge. This mall, however, was in much worse shape than Castleton, with up to a third of its in-line tenant spaces empty. The Sears wing was the worst; customers essentially had to walk the equivalent of a city block among vacant storefronts to get to the Sears.


I haven’t been to Cortana since basically 2010, but most evidence I can gather suggests it’s even worse. About 65% vacant. It has only one real anchor tenant left, a Dillards Clearance Center, as well as a junior college in a former department store space. Sears left years ago, and, incidentally, the website still implies that J.C. Penney is around, even though it bailed last summer. Cortana is, for all intents and purposes, a dead mall.
The same can’t be said for Castleton Square, which remains one of the state’s largest retail hubs—perhaps the largest. Unfortunately, there doesn’t seem to be much chance of a replacement for Sears. After all the department stores consolidated in the early 2000s, what’s even left? The only likely options that come to mind are a Lord and Taylor, the upscale chain that’s floundering as well, so unlikely to take a risk at a middle-market mall like Castleton. And then there are Dillard and Belk, the two southern chains, and while they don’t get a lot of negative press, which suggests they’re surviving, they don’t show much interest in expanding. Dillard has a small presence outside the south, particularly in Ohio; Belk is exclusively southern.
That leaves Castleton in a real predicament. The mall itself is huge, at over 1.2 million square feet, but it’s also part of a retail campus that extends in all directions, offering a variety of big-box and out parcel tenants around the expansive perimeter. Here’s a Google aerial.
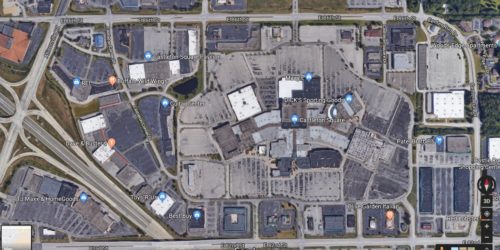
The parking lots are so vast that it’s hard to distinguish them from the rooftops, so the conventional map is a good solution.

If you really take a close look, you can discern a difference between the two, in the northeast corner of the campus, where the perimeter road curves gently. The aerial shows rooflines for an outlying shopping center, but in the map, those buildings are not there. What happened?
Here’s a Google Street View of that northeast corner back in the summer of 2014. A few months later, Target Corp. announced the closing of 11 underperforming stores, and the Castleton location was among them. By 2017, this is what that corner looks like. Pretty bleak. And while no portion of the greater Castleton campus is quite as bad as this, one can easily drive around the perimeter ring road of the mall and see that the supply of retail space vastly outstrips the demand—a condition throughout the United States, exacerbated in recent years after the implosion of retail. Even though Castleton remains one of the highest profile commercial hubs in the state, the entire complex—central mall and periphery—now suffers probably a half million square feet of unnecessary leasable area. The Target was at a terrible location within the greater mall area, since it was far removed from the major arterials, and most people would never know it was there from just driving nearby. However, in this day and age, with smart phone possession the norm and Google Maps in every pocket or purse, can analysts really fault a lack of visibility? The Target closed because the thinning retail presence all around it weakened the viability of an already mediocre configuration in an otherwise great area. And now, this continued weakening viability, caused less by Castleton’s location (still quite advantageous) and more from retailers persistently going out of businesses, has dragged the already failing Sears into the abyss.
Shortly after the closure, Simon Property Group announced a “transformational redevelopment” of the two-story Sears site at Castleton, to combine retail, fitness, dining and entertainment. It’ll probably parallel the repurposing of the Greenwood Park Mall from a decade ago, when Simon morphed the vacant L.S. Ayres wing into an outdoor-oriented lifestyle center with fountains, plazas, a few somewhat upscale shops and a Barnes and Noble as an anchor. It worked quite well for the Greenwood Park Mall, which, now that Castleton has suffered this setback, may be the single most successful major mall in the state.
I think the folks at Simon need to be a bit more ambitious with the vacating Sears at Castleton. In 2018, lifestyle centers aren’t much better off than enclosed malls, and if the mall can’t engage the oversized space with a mixture of different uses, it’s only likely to face similar problems. My speculation is that Simon should see the vast, contiguous stretch of vacancy between the old Target and the Sears as an opportunity. If the company doesn’t own the old Target outparcel, it should buy it (probably doesn’t cost much), and integrate it with the Sears redevelopment. Hotel space should be fairly lucrative, since it’s an industry that’s already doing well, and the location close to two interstates would already make it attractive. Apartments and office space may complete the mix, culminating in a centralized, pedestrian-oriented plaza that places a premium on good design. It has to attract people by offering a unique experience, and in this day and age, a conventional mall just isn’t going to cut it.
Any other sort of redevelopment at the Castleton Sears is likely just kicking the can down the road. I’m not yet suggesting Castleton will turn into the next Cortana. But based on the national state of retail (and malls, as a result), the odds are greater than ever that, without that radical transformation, the best of malls will face their demise, sooner than we ever care to admit.
Milktooth chef Jonathan Brooks opens Beholder restaurant
Anthony Bourdain, Chef, Author and TV Host, Dies at 61 (Wine Spectator)
Q&A With Eli Sanchez
 After tending bar at the legendary (and now shuttered) Elbow Room for years, Eli Sanchez honed his mixology skills at a series of hip watering holes until he landed behind the bar at Rook, where he mixes up some of Indy’s most creative gin cocktails. Here, he catches up with us about new trends in cocktails, what the soul of a good bar should be, and what we can expect at The Inferno Room—Ed Rudisell and Chris Coy’s swank new tiki spot where he’ll be consulting on the drinks. IM: What will your role be at The Inferno Room? ES: I’ll be helping with the training and with efficiency behind the bar. I’ll work with the bar staff to batch the spirits and get the…View Original Post
De-Annexation Rears Its Head
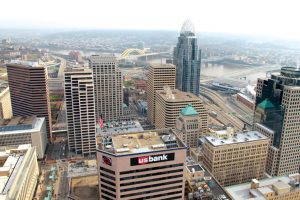
Cincinnati image via Shutterstock
You may be familiar with the “cityhood” movement in Atlanta. Much of suburban Atlanta was traditionally unincorporated. But there have been a series of incorporations of new suburban municipalities, something that has been controversial.
Now some places are taking it to the next level and seeking to secede from existing municipalities in order to form a new one. Breaking apart a municipality brings all sorts of issues into play, especially financial ones, and most especially if the communities have bonded debt. Ratings agencies are keeping an eye on the situation.
A similar situation recently arose in Tennessee, where some legislators were trying to pass a law that would allow residents of cities to de-annex territory on their own initiative. Naturally municipalities were alarmed by this.
But interestingly, the mayor of Memphis agrees that de-annexation is a good idea for his city. He (of course) believes the city should drive the process rather than residents. There are several areas he has targeted for de-annexation, largely undeveloped:
For years, Memphis gobbled up land through a process known as “annexation,” more than doubling the city’s area. Mayor Jim Strickland says providing services like public transportation and law enforcement within this sprawl is an expensive challenge.
“Memphis grew, actually from the very beginning 200 years ago, by annexing,” Strickland said at an event here on Wednesday. “The days of annexation are over and we’ve now paid a price. We have no density and it’s really hard to deliver services.”
I’m reminded of what Cincinnati mayor John Cranley had to say when I recorded a podcast with him back in 2014:
There’s a real cultural shift and renewed pride in Cincinnati. More specifically though, there are some unique advantages that we have. Think of it this way: if you took our Downtown and Uptown and the corporate base, let’s say it’s 70% of all of our major jobs and income taxpayers. If you take the same exact area and map it in Columbus, they’re going to have 70% of their companies Nationwide, et cetera, all within the same geographic area. The difference is that they have to spread that money among all of Franklin County. We have to provide for 300,000 people. And very quality 19th century historic neighborhoods that already have a sense of place and culture. And we get the benefit of, on a per capita basis, being able to invest way more in these urban neighborhoods than any of our peers because we didn’t annex.
Now, historically, the attitude of urbanists had been, like myself, the we’ve got to have metro government. In essence, the attitude has been, “We poor city.” We need you guys have to play Robin Hood for us. I think the shift is already underway. Now, we have more work to do but the shift is already underway that we’re going to be a better choice for the dollar value because of our historic infrastructure, our density, our diverse economies of scale.
This isn’t an argument for de-annexation, but it is an argument for thinking geographically smaller.
Back in the day you used to hear about quixotic secession movements by places like Staten Island or the San Fernando Valley. These largely seemed to disappear. The conventional wisdom on governance was towards bigger boxes: city-county consolidation, regional councils, expansive annexations, etc.
That model remains popular, but I’ve started seeing signs people are thinking differently about it. Interestingly, both residents and mayors can think that small is beautiful, though may have different incentives.
A lot of states allow de-annexation, but I rarely observe it in practice. But I’ll be keeping an eye out to see if this turns into a trend.
The Spotted Pig Restaurant Empire Is Fracturing

Why You Should Be Drinking Weird Wines

Six C.E.O. Pay Packages That Explain Soaring Executive Compensation
Being A Lawyer Is So Much More Than It Was 30 Years Ago
This just in: Downtown continues to post strong growth numbers
Look At This Monster Waterfall Washing Out A Road In Madison
 Is your yard or basement flooded? This is hardly a silver lining to the damage caused by this week’s heavy rain, but waterfalls are rushing in Indiana parks right now. And also outside of parks. A cascade formed on Hanging Rock Road in Madison, a popular destination on the Ohio River. The namesake feature on the windy, hilly State Road 7 north of town looks like this in dry weather: Hanging Rock Hill #vwbeetle #67beetle #vw #volkswagen #beetle #bug #heritagewheels #patina #rustisnotacrime #madisonindiana #hangingrockhill @dpndebt A post shared by Amanda Blake Photography (@amandablakephotography) on Sep 30, 2017 at 3:43pm PDT On Tuesday, it looked like this: But the downpours have enhanced wateralls in state parks, which were already at their peak rush thanks to snowmelt.…View Original Post
Former Big Al's Superstore space being rehabbed for tap room, other tenants

Live Nation Rules Music Ticketing, Some Say With Threats

Resurrection! Or Welcome to Zombie HBG
Remembering Robert F. Kennedy’s Speech On The Assassination Of Martin Luther King Jr.
 Preface On April 4, 1968, Robert F. Kennedy was on the campaign trail for the Democratic nomination for president with his back against the wall. He had to win the Indiana primary on May 7, or chances for a White House run were dim. As Newsweek put it, “He swept into Indiana with a lean and hungry look—a Kennedy in search of a convincing candidacy.” To that end, an all-out blitz began with a rally in South Bend, then continued in Muncie at Ball State, where nearly 10,000 crowded the campus to hear his optimistic message. Kennedy’s last stop: Indianapolis, where he would hold an evening rally at 17th and Broadway. But, as RFK hopped across the Hoosier State that day, the evening took an…View Original Post
Who Owns Indy: What Projects Are We Going To Regret?
 Single-Story Sprawl “We can’t continue to build low-density sprawl. We won’t have any money for schools, parks, and all the other requirements of local government if we do. Much of the growth in Central Indiana since 1970 has been suburban in nature—one-level development that doesn’t begin to pay for the infrastructure. Take a 40,000-square-foot piece of land. Option A is a 10,000-square-foot building, and the other 30,000 square feet is used for parking. At $2 per square foot, that’s $20,000 per year in taxes. Take that same 40,000-square-foot parcel, go up five levels, and build on the entire thing, and you get $400,000 in taxes. Many communities are failing to do that kind of fiscal analysis of new development. When I put someone on one…View Original Post
Who’s The Best At Coaching In The NCAA Men’s Tournament?
Who’s the best at coaching in the NCAA men’s tournament? When we’ve looked at the question in the past, Michigan State’s Tom Izzo always stood out from the pack. Even if you include recent seasons — which have tarnished Izzo’s reputation a little with early losses to Syracuse, Kansas and Middle Tennessee — the Spartans’ coach still gets longer tournament runs out of his teams than we’d expect based on their talent.
But that’s just one way to define the tournament’s top coaching performances. Another approach is to simply look at how often you won the games at hand, regardless of the big-picture focus on how deep you made it each year. And by that standard, the NCAA tourney’s most impressive modern coach might be the guy who outdueled Izzo last Sunday — Syracuse’s Jim Boeheim.
Boeheim is best known for his iconic zone defense and irascible demeanor (particularly with the media), plus the national championship he won with Carmelo Anthony in 2003 — the only title in his 40-plus-year head coaching career. But the numbers say that Boeheim should have more of an Izzo-like reputation for coaxing impressive performances out of the teams he’s had to work with.
In short, he’s won a lot more games than the odds say he should have. To measure just how many of those each coach has racked up going back to 1985 (the start of the 64-team tournament era), we used our Elo ratings to generate pregame win probabilities for each tournament game.24 The coaches with the biggest differentials between their actual and expected tournament wins are the ones who have the strongest March Madness resumes — and sure enough, Boeheim shows up at No. 1:
Boeheim wins the games he shouldn’t
Wins above expected in the NCAA tournament (based on pregame Elo probabilities) for NCAA men’s basketball coaches, 1985-2018
| ▲▼ |
Coach▲▼ |
Avg. Seed▲▼ |
Current Team▲▼ |
W▲▼ |
L▲▼ |
Exp. Wins▲▼ |
Wins Over Expected▲▼ |
|---|---|---|---|---|---|---|---|
| 1 | Jim Boeheim | 4.3 | Syracuse | 54 | 25 | 44.3 | +9.7 |
| 2 | Tom Izzo | 4.9 | Michigan St. | 48 | 20 | 38.8 | +9.2 |
| 3 | Roy Williams | 2.7 | North Carolina | 77 | 25 | 68.1 | +8.9 |
| 4 | John Calipari | 3.0 | Kentucky | 53 | 17 | 46.1 | +6.9 |
| 5 | Jim Calhoun | 4.5 | — | 48 | 17 | 41.3 | +6.7 |
| 6 | Rollie Massimino | 9.0 | — | 11 | 4 | 4.7 | +6.3 |
| 7 | Mike Krzyzewski | 2.2 | Duke | 93 | 27 | 87.2 | +5.8 |
| 8 | Rick Pitino | 3.6 | — | 54 | 18 | 48.5 | +5.5 |
| 9 | John Beilein | 7.4 | Michigan | 20 | 11 | 15.0 | +5.0 |
| 10 | Rick Majerus | 6.2 | — | 19 | 12 | 14.0 | +5.0 |
| 11 | Billy Donovan | 4.1 | — | 35 | 12 | 30.6 | +4.4 |
| 12 | Brad Stevens | 7.0 | — | 12 | 5 | 7.6 | +4.4 |
| 13 | Denny Crum | 5.6 | — | 21 | 11 | 16.7 | +4.3 |
| 14 | Thomas Penders | 9.6 | — | 12 | 11 | 8.2 | +3.8 |
| 15 | Frank Martin | 6.6 | South Carolina | 10 | 5 | 6.2 | +3.8 |
| 16 | Kevin Ollie | 8.0 | Connecticut | 7 | 1 | 3.2 | +3.8 |
| 17 | John Chaney | 7.2 | — | 22 | 16 | 18.3 | +3.7 |
| 18 | Nolan Richardson | 5.5 | — | 26 | 13 | 22.3 | +3.7 |
| 19 | Larry Brown | 4.2 | — | 13 | 4 | 9.7 | +3.3 |
| 20 | Gary Williams | 5.4 | — | 28 | 15 | 24.8 | +3.2 |
| 21 | Dale Brown | 8.1 | — | 9 | 9 | 5.8 | +3.2 |
| 22 | Bill Frieder | 4.4 | — | 14 | 6 | 11.2 | +2.8 |
| 23 | P.J. Carlesimo | 5.0 | — | 12 | 6 | 9.3 | +2.7 |
| 24 | Steve Lavin | 5.8 | — | 11 | 8 | 8.4 | +2.6 |
| 25 | Sonny Smith | 9.4 | — | 7 | 5 | 4.4 | +2.6 |
| 26 | Pete Gillen | 10.4 | — | 8 | 9 | 5.5 | +2.5 |
| 27 | Jerry Tarkanian | 4.1 | — | 22 | 8 | 19.6 | +2.4 |
| 28 | Chris Mack | 6.0 | Xavier | 11 | 7 | 8.6 | +2.4 |
| 29 | Bo Ryan | 5.2 | — | 27 | 15 | 24.6 | +2.4 |
| 30 | Todd Lickliter | 8.5 | — | 4 | 2 | 1.7 | +2.3 |
| 31 | Sean Miller | 5.1 | Arizona | 19 | 11 | 16.7 | +2.3 |
| 32 | Tubby Smith | 5.8 | Memphis | 30 | 17 | 27.8 | +2.2 |
| 33 | Mike Davis | 9.9 | Texas Southern | 7 | 7 | 4.8 | +2.2 |
| 34 | Jim Larranaga | 8.7 | Miami (FL) | 9 | 9 | 6.8 | +2.2 |
| 35 | Jim O’Brien | 5.9 | — | 11 | 7 | 8.9 | +2.1 |
| 36 | Clem Haskins | 6.7 | — | 11 | 7 | 9.0 | +2.0 |
| 37 | Quin Snyder | 9.0 | — | 5 | 4 | 3.0 | +2.0 |
| 38 | Andy Enfield | 11.3 | Southern California | 3 | 3 | 1.0 | +2.0 |
| 39 | Mike Anderson | 8.1 | Arkansas | 9 | 9 | 7.0 | +2.0 |
| 40 | Tommy Amaker | 12.2 | Harvard | 4 | 5 | 2.0 | +2.0 |
| 41 | John Groce | 11.3 | Akron | 4 | 3 | 2.1 | +1.9 |
| 42 | Lou Campanelli | 7.5 | — | 3 | 2 | 1.1 | +1.9 |
| 43 | Dean Smith | 2.6 | — | 37 | 12 | 35.1 | +1.9 |
| 44 | Richard Williams | 5.0 | — | 6 | 3 | 4.1 | +1.9 |
| 45 | Paul Westhead | 11.0 | — | 4 | 3 | 2.2 | +1.8 |
| 46 | Tom Davis | 5.6 | — | 13 | 9 | 11.2 | +1.8 |
| 47 | Billy Kennedy | 9.5 | Texas A&M | 5 | 3 | 3.2 | +1.8 |
| 48 | Ben Howland | 5.5 | Mississippi St. | 19 | 10 | 17.3 | +1.7 |
| 49 | Bill Guthridge | 4.0 | — | 8 | 3 | 6.3 | +1.7 |
| 50 | Dick Tarrant | 13.3 | — | 3 | 4 | 1.4 | +1.6 |
| 51 | Cliff Ellis | 8.5 | Coastal Carolina | 8 | 8 | 6.4 | +1.6 |
| 52 | Mark Few | 6.3 | Gonzaga | 28 | 18 | 26.5 | +1.5 |
| 53 | Larry Finch | 6.8 | — | 6 | 6 | 4.5 | +1.5 |
| 54 | Lou Carnesecca | 5.1 | — | 10 | 7 | 8.5 | +1.5 |
| 55 | Ron Abegglen | 14.0 | — | 2 | 2 | 0.5 | +1.5 |
| 56 | Jim Les | 14.5 | California-Davis | 2 | 2 | 0.6 | +1.4 |
| 57 | Jim Brandenburg | 12.0 | — | 2 | 1 | 0.6 | +1.4 |
| 58 | Jim Valvano | 5.6 | — | 8 | 5 | 6.6 | +1.4 |
| 59 | Jim Rosborough | 2.0 | — | 5 | 1 | 3.6 | +1.4 |
| 60 | Eddie Sutton | 5.1 | — | 28 | 17 | 26.6 | +1.4 |
| 61 | Paul Hewitt | 8.2 | — | 7 | 6 | 5.7 | +1.3 |
| 62 | Pat Flannery | 11.5 | — | 2 | 2 | 0.7 | +1.3 |
| 63 | John Giannini | 13.0 | La Salle | 2 | 1 | 0.7 | +1.3 |
| 64 | Ben Braun | 8.8 | — | 7 | 8 | 5.8 | +1.2 |
| 65 | Archie Miller | 9.0 | Indiana | 4 | 4 | 2.8 | +1.2 |
| 66 | Johnny Dawkins | 10.0 | Central Florida | 2 | 1 | 0.8 | +1.2 |
| 67 | Mark Gottfried | 8.9 | — | 9 | 11 | 7.8 | +1.2 |
| 68 | Porter Moser | 11.0 | Loyola (IL) | 2 | 0 | 0.8 | +1.2 |
| 69 | Trent Johnson | 8.0 | — | 5 | 5 | 3.8 | +1.2 |
| 70 | Jim Harrick | 6.8 | — | 17 | 13 | 15.8 | +1.2 |
| 71 | Wimp Sanderson | 5.1 | — | 11 | 7 | 9.8 | +1.2 |
| 72 | Chris Beard | 7.5 | Texas Tech | 3 | 1 | 1.9 | +1.1 |
| 73 | Dick Davey | 12.3 | — | 2 | 3 | 0.9 | +1.1 |
| 74 | Steve Donahue | 14.0 | Pennsylvania | 2 | 4 | 0.9 | +1.1 |
| 75 | Russ Pennell | 12.0 | Central Arkansas | 2 | 1 | 0.9 | +1.1 |
| 76 | Tim Floyd | 7.6 | Texas-El Paso | 7 | 8 | 5.9 | +1.1 |
| 77 | Eric Musselman | 9.5 | Nevada | 2 | 1 | 0.9 | +1.1 |
| 78 | Mack McCarthy | 14.0 | — | 2 | 5 | 0.9 | +1.1 |
| 79 | Kevin Mackey | 14.0 | — | 2 | 1 | 0.9 | +1.1 |
| 80 | Dick Hunsaker | 13.5 | — | 2 | 2 | 0.9 | +1.1 |
| 81 | Dick Bennett | 9.7 | — | 5 | 6 | 3.9 | +1.1 |
| 82 | Gregg Marshall | 10.2 | Wichita St. | 10 | 13 | 9.0 | +1.0 |
| 83 | Henry Bibby | 7.0 | — | 3 | 3 | 2.0 | +1.0 |
| 84 | Fran McCaffery | 11.6 | Iowa | 4 | 7 | 3.0 | +1.0 |
| 85 | Greg Gard | 8.0 | Wisconsin | 2 | 1 | 1.0 | +1.0 |
| 86 | Larry Krystkowiak | 9.0 | Utah | 4 | 4 | 3.0 | +1.0 |
| 87 | Bob Donewald | 10.0 | — | 2 | 2 | 1.0 | +1.0 |
| 88 | Shaka Smart | 8.0 | Texas | 6 | 7 | 5.0 | +1.0 |
| 89 | Anthony Evans | 15.0 | Florida International | 1 | 1 | 0.1 | +0.9 |
| 90 | Don Haskins | 9.1 | — | 5 | 7 | 4.1 | +0.9 |
| 91 | Homer Drew | 14.0 | — | 2 | 7 | 1.1 | +0.9 |
| 92 | Chris Holtmann | 6.0 | Ohio St. | 5 | 4 | 4.1 | +0.9 |
| 93 | Joe B. Hall | 12.0 | — | 2 | 1 | 1.1 | +0.9 |
| 94 | Darrin Horn | 12.0 | — | 2 | 1 | 1.1 | +0.9 |
| 95 | Perry Clark | 8.8 | — | 3 | 4 | 2.1 | +0.9 |
| 96 | Lefty Driesell | 8.8 | — | 4 | 4 | 3.2 | +0.8 |
| 97 | Ryan Odom | 16.0 | Maryland-Baltimore County | 1 | 1 | 0.2 | +0.8 |
| 98 | Jay Wright | 5.6 | Villanova | 23 | 13 | 22.2 | +0.8 |
| 99 | Lake Kelly | 14.0 | — | 1 | 1 | 0.2 | +0.8 |
| 100 | Steve Fisher | 6.5 | — | 20 | 14 | 19.2 | +0.8 |
| 101 | Bob Hoffman | 14.0 | Mercer | 1 | 1 | 0.2 | +0.8 |
| 102 | Eldon Miller | 9.0 | — | 2 | 2 | 1.2 | +0.8 |
| 103 | David Hobbs | 7.0 | — | 2 | 2 | 1.2 | +0.8 |
| 104 | Jim O’Brien | 12.0 | — | 1 | 1 | 0.3 | +0.7 |
| 105 | Matt Painter | 6.0 | Purdue | 12 | 10 | 11.3 | +0.7 |
| 106 | Dan D’Antoni | 13.0 | Marshall | 1 | 1 | 0.3 | +0.7 |
| 107 | Buzz Williams | 6.6 | Virginia Tech | 8 | 7 | 7.3 | +0.7 |
| 108 | Dana Altman | 8.1 | Oregon | 13 | 13 | 12.3 | +0.7 |
| 109 | Dan Hurley | 9.0 | Rhode Island | 2 | 2 | 1.3 | +0.7 |
| 110 | Mark Turgeon | 6.5 | Maryland | 8 | 8 | 7.3 | +0.7 |
| 111 | Tom Brennan | 14.7 | — | 1 | 3 | 0.3 | +0.7 |
| 112 | Steve Merfeld | 15.0 | — | 1 | 2 | 0.3 | +0.7 |
| 113 | Thad Matta | 4.7 | — | 24 | 13 | 23.3 | +0.7 |
| 114 | John Phillips | 12.5 | — | 2 | 2 | 1.3 | +0.7 |
| 115 | Fang Mitchell | 15.0 | — | 1 | 3 | 0.3 | +0.7 |
| 116 | Gene Sullivan | 4.0 | — | 2 | 1 | 1.3 | +0.7 |
| 117 | Jerod Haase | 14.0 | Stanford | 1 | 1 | 0.3 | +0.7 |
| 118 | Bill Grier | 13.0 | — | 1 | 1 | 0.3 | +0.7 |
| 119 | Ray Giacoletti | 10.5 | — | 2 | 2 | 1.3 | +0.7 |
| 120 | Bob Bender | 10.7 | — | 2 | 3 | 1.3 | +0.7 |
| 121 | Perry Watson | 11.0 | — | 2 | 2 | 1.4 | +0.6 |
| 122 | Craig Esherick | 10.0 | — | 2 | 1 | 1.4 | +0.6 |
| 123 | Tom Crean | 5.4 | — | 11 | 9 | 10.4 | +0.6 |
| 124 | Steve McClain | 11.0 | Illinois-Chicago | 1 | 1 | 0.4 | +0.6 |
| 125 | Mike McConathy | 14.7 | Northwestern St. | 1 | 3 | 0.4 | +0.6 |
| 126 | Donnie Tyndall | 14.5 | — | 1 | 2 | 0.4 | +0.6 |
| 127 | Jeff Capel | 7.0 | — | 4 | 3 | 3.4 | +0.6 |
| 128 | Michael White | 5.0 | Florida | 4 | 2 | 3.4 | +0.6 |
| 129 | Dan Monson | 10.0 | Long Beach St. | 3 | 3 | 2.4 | +0.6 |
| 130 | Ben Jobe | 14.5 | — | 1 | 4 | 0.5 | +0.5 |
| 131 | Bruce Pearl | 6.8 | Auburn | 11 | 9 | 10.5 | +0.5 |
| 132 | Stu Jackson | 9.0 | — | 1 | 1 | 0.5 | +0.5 |
| 133 | Mike Newell | 14.3 | — | 1 | 3 | 0.5 | +0.5 |
| 134 | Eran Ganot | 13.0 | Hawaii | 1 | 1 | 0.5 | +0.5 |
| 135 | Rob Jeter | 13.0 | — | 1 | 2 | 0.5 | +0.5 |
| 136 | Melvin Watkins | 7.5 | — | 2 | 2 | 1.5 | +0.5 |
| 137 | Lon Kruger | 6.6 | Oklahoma | 20 | 18 | 19.5 | +0.5 |
| 138 | Avery Johnson | 9.0 | Alabama | 1 | 1 | 0.5 | +0.5 |
| 139 | Brett Reed | 15.5 | Lehigh | 1 | 2 | 0.5 | +0.5 |
| 140 | Kevin O’Neill | 9.3 | — | 2 | 3 | 1.5 | +0.5 |
| 141 | Norm Sloan | 6.3 | — | 3 | 3 | 2.5 | +0.5 |
| 142 | Steve Alford | 6.1 | UCLA | 11 | 10 | 10.5 | +0.5 |
| 143 | Kermit Davis | 13.3 | Middle Tennessee | 2 | 4 | 1.5 | +0.5 |
| 144 | Ken McDonald | 14.0 | — | 1 | 2 | 0.5 | +0.5 |
| 145 | Wayne Morgan | 9.0 | — | 1 | 1 | 0.5 | +0.5 |
| 146 | Nate Oats | 13.5 | Buffalo | 1 | 2 | 0.5 | +0.5 |
| 147 | Chris Collins | 8.0 | Northwestern | 1 | 1 | 0.5 | +0.5 |
| 148 | Ron Hunter | 15.0 | Georgia St. | 1 | 3 | 0.6 | +0.4 |
| 149 | Jerry Wainwright | 13.0 | — | 1 | 3 | 0.6 | +0.4 |
| 150 | Gary Waters | 12.3 | — | 2 | 3 | 1.6 | +0.4 |
| 151 | Charlie Coles | 12.5 | — | 2 | 4 | 1.6 | +0.4 |
| 152 | Jay Smith | 11.0 | — | 1 | 1 | 0.6 | +0.4 |
| 153 | Bob Thomason | 12.2 | — | 2 | 5 | 1.6 | +0.4 |
| 154 | Jeff Capel | 14.7 | — | 1 | 3 | 0.6 | +0.4 |
| 155 | Steve Newton | 14.3 | — | 1 | 3 | 0.6 | +0.4 |
| 156 | Jeff Jones | 8.9 | Old Dominion | 6 | 7 | 5.6 | +0.4 |
| 157 | John Pelphrey | 11.5 | — | 1 | 2 | 0.6 | +0.4 |
| 158 | Tom Young | 8.0 | — | 1 | 1 | 0.6 | +0.4 |
| 159 | Tommy Joe Eagles | 11.5 | — | 1 | 2 | 0.6 | +0.4 |
| 160 | Bruce Stewart | 13.3 | — | 1 | 3 | 0.7 | +0.3 |
| 161 | Royce Waltman | 12.5 | — | 1 | 2 | 0.7 | +0.3 |
| 162 | Ben Jacobson | 9.3 | Northern Iowa | 4 | 4 | 3.7 | +0.3 |
| 163 | Bill C. Foster | 9.0 | — | 1 | 1 | 0.7 | +0.3 |
| 164 | Murray Arnold | 10.0 | — | 1 | 1 | 0.7 | +0.3 |
| 165 | Herb Sendek | 8.4 | Santa Clara | 7 | 8 | 6.7 | +0.3 |
| 166 | Jerry Dunn | 6.0 | — | 2 | 2 | 1.7 | +0.3 |
| 167 | Bobby Gonzalez | 13.0 | — | 1 | 2 | 0.7 | +0.3 |
| 168 | Bruce Parkhill | 13.0 | — | 1 | 1 | 0.7 | +0.3 |
| 169 | Joey Meyer | 8.0 | — | 6 | 7 | 5.7 | +0.3 |
| 170 | Phil Martelli | 7.1 | Saint Joseph’s | 7 | 7 | 6.7 | +0.3 |
| 171 | Jerry Pimm | 9.5 | — | 1 | 2 | 0.7 | +0.3 |
| 172 | Dave Leitao | 5.5 | DePaul | 2 | 2 | 1.7 | +0.3 |
| 173 | Matt Kilcullen | 8.0 | — | 1 | 1 | 0.8 | +0.2 |
| 174 | C.M. Newton | 7.5 | — | 2 | 2 | 1.8 | +0.2 |
| 175 | Ricardo Patton | 9.5 | — | 1 | 2 | 0.8 | +0.2 |
| 176 | Ralph Willard | 12.7 | — | 2 | 6 | 1.8 | +0.2 |
| 177 | James Dickey | 7.5 | — | 2 | 2 | 1.8 | +0.2 |
| 178 | Jim Killingsworth | 4.0 | — | 1 | 1 | 0.8 | +0.2 |
| 179 | Dave Bliss | 7.1 | — | 6 | 9 | 5.8 | +0.2 |
| 180 | LaVall Jordan | 10.0 | Butler | 1 | 1 | 0.8 | +0.2 |
| 181 | Tiny Grant | 10.0 | — | 1 | 2 | 0.8 | +0.2 |
| 182 | Jan Van Breda Kolff | 10.5 | — | 1 | 2 | 0.8 | +0.2 |
| 183 | Andy Russo | 8.5 | — | 2 | 2 | 1.8 | +0.2 |
| 184 | Brad Underwood | 12.0 | Illinois | 2 | 4 | 1.9 | +0.1 |
| 185 | Chris Lowery | 7.3 | — | 3 | 3 | 2.9 | +0.1 |
| 186 | Bill Herrion | 12.7 | New Hampshire | 1 | 3 | 0.9 | +0.1 |
| 187 | Brian Gregory | 10.5 | South Florida | 1 | 2 | 0.9 | +0.1 |
| 188 | Bill Self | 2.7 | Kansas | 45 | 18 | 44.9 | +0.1 |
| 189 | Saul Phillips | 13.0 | Ohio | 1 | 2 | 0.9 | +0.1 |
| 190 | Gale Catlett | 9.0 | — | 3 | 5 | 2.9 | +0.1 |
| 191 | James Jones | 12.0 | Yale | 1 | 1 | 0.9 | +0.1 |
| 192 | Steve Prohm | 5.0 | Iowa St. | 4 | 3 | 3.9 | +0.1 |
| 193 | Dick Versace | 7.0 | — | 1 | 1 | 0.9 | +0.1 |
| 194 | Marty Fletcher | 12.0 | — | 1 | 2 | 0.9 | +0.1 |
| 195 | Ladell Andersen | 7.0 | — | 1 | 2 | 0.9 | +0.1 |
| 196 | Alan LeForce | 12.0 | — | 1 | 2 | 1.0 | +0.0 |
| 197 | Bob Wade | 7.0 | — | 1 | 1 | 1.0 | +0.0 |
| 198 | Lorenzo Romar | 6.4 | — | 8 | 7 | 8.0 | +0.0 |
| 199 | Mike Jarvis | 9.7 | — | 7 | 9 | 7.0 | +0.0 |
| 200 | Tony Barone | 12.5 | — | 1 | 2 | 1.0 | +0.0 |
| 201 | Dana Kirk | 2.5 | — | 5 | 2 | 5.0 | +0.0 |
| 202 | Fred Hoiberg | 6.0 | — | 4 | 4 | 4.0 | +0.0 |
| 203 | Mickey Clayton | 16.0 | — | 0 | 1 | 0.0 | +0.0 |
| 204 | Billy Lee | 16.0 | — | 0 | 1 | 0.0 | +0.0 |
| 205 | Elwood Plummer | 16.0 | — | 0 | 1 | 0.0 | +0.0 |
| 206 | James Green | 16.0 | — | 0 | 1 | 0.0 | +0.0 |
| 207 | Roy Thomas | 16.0 | — | 0 | 1 | 0.0 | +0.0 |
| 208 | Paul Cormier | 16.0 | — | 0 | 1 | 0.0 | +0.0 |
| 209 | Mike Gillespie | 16.0 | — | 0 | 1 | 0.0 | +0.0 |
| 210 | Butch Beard | 16.0 | — | 0 | 1 | 0.0 | +0.0 |
| 211 | Eddie Payne | 16.0 | — | 0 | 1 | 0.0 | +0.0 |
| 212 | Jamion Christian | 16.0 | Mount St. Mary’s | 0 | 1 | 0.0 | +0.0 |
| 213 | Ron Bradley | 16.0 | — | 0 | 1 | 0.0 | +0.0 |
| 214 | Brooks Thompson | 16.0 | — | 0 | 1 | 0.0 | +0.0 |
| 215 | George Ivory | 16.0 | Arkansas-Pine Bluff | 0 | 1 | 0.0 | +0.0 |
| 216 | Mike Cingiser | 15.0 | — | 0 | 1 | 0.0 | +0.0 |
| 217 | Tom Schneider | 16.0 | — | 0 | 2 | 0.0 | +0.0 |
| 218 | Steve Welch | 16.0 | — | 0 | 1 | 0.0 | +0.0 |
| 219 | Roman Banks | 16.0 | — | 0 | 1 | 0.0 | +0.0 |
| 220 | Jeff Meyer | 16.0 | — | 0 | 1 | 0.0 | +0.0 |
| 221 | Rob Lanier | 16.0 | — | 0 | 1 | 0.0 | +0.0 |
| 222 | Greg Jackson | 16.0 | — | 0 | 1 | 0.0 | +0.0 |
| 223 | Milan Brown | 16.0 | — | 0 | 1 | 0.0 | +0.0 |
| 224 | Mike Miller | 16.0 | — | 0 | 1 | 0.0 | +0.0 |
| 225 | Matt Furjanic | 15.0 | — | 0 | 1 | 0.0 | +0.0 |
| 226 | Andy Stoglin | 16.0 | — | 0 | 2 | 0.0 | +0.0 |
| 227 | Patrick Chambers | 16.0 | Penn St. | 0 | 1 | 0.0 | +0.0 |
| 228 | Scott Cross | 16.0 | Texas-Arlington | 0 | 1 | 0.0 | +0.0 |
| 229 | Brad Greenberg | 16.0 | — | 0 | 1 | 0.0 | +0.0 |
| 230 | Ralph Underhill | 16.0 | — | 0 | 1 | 0.0 | +0.0 |
| 231 | Jim Phelan | 16.0 | — | 0 | 2 | 0.0 | +0.0 |
| 232 | John Brady | 5.5 | — | 6 | 4 | 6.0 | +0.0 |
| 233 | Mike Dement | 16.0 | — | 0 | 1 | 0.0 | +0.0 |
| 234 | Joe Callero | 16.0 | Cal Poly | 0 | 1 | 0.0 | +0.0 |
| 235 | Neil McCarthy | 8.8 | — | 3 | 5 | 3.0 | +0.0 |
| 236 | Craig Littlepage | 15.0 | — | 0 | 1 | 0.0 | +0.0 |
| 237 | Sidney Green | 15.0 | — | 0 | 1 | 0.0 | +0.0 |
| 238 | Mike Jones | 16.0 | Radford | 0 | 1 | 0.0 | +0.0 |
| 239 | Jim Boutin | 16.0 | — | 0 | 1 | 0.0 | +0.0 |
| 240 | Kevin Broadus | 15.0 | — | 0 | 1 | 0.0 | +0.0 |
| 241 | Nick McDevitt | 15.0 | North Carolina-Asheville | 0 | 1 | 0.0 | +0.0 |
| 242 | Eddie Burke | 15.0 | — | 0 | 1 | 0.0 | +0.0 |
| 243 | Dereck Whittenburg | 15.0 | — | 0 | 1 | 0.0 | +0.0 |
| 244 | Tim Carter | 16.0 | — | 0 | 2 | 0.0 | +0.0 |
| 245 | Rob Spivery | 16.0 | — | 0 | 3 | 0.0 | +0.0 |
| 246 | Phil Hopkins | 16.0 | — | 0 | 1 | 0.0 | +0.0 |
| 247 | Davey Whitney | 15.0 | — | 0 | 1 | 0.0 | +0.0 |
| 248 | Bob Reinhart | 16.0 | — | 0 | 1 | 0.0 | +0.0 |
| 249 | Randy Dunton | 16.0 | — | 0 | 1 | 0.0 | +0.0 |
| 250 | Jack Bruen | 16.0 | — | 0 | 2 | 0.0 | +0.0 |
| 251 | Andrew Toole | 16.0 | Robert Morris | 0 | 1 | 0.0 | +0.0 |
| 252 | Don Holst | 15.0 | — | 0 | 1 | 0.0 | +0.0 |
| 253 | Bobby Hussey | 16.0 | — | 0 | 1 | 0.0 | +0.0 |
| 254 | Brian Jones | 15.0 | North Dakota | 0 | 1 | 0.0 | +0.0 |
| 255 | Russ Bergman | 15.5 | — | 0 | 2 | 0.0 | +0.0 |
| 256 | Edward Joyner | 16.0 | Hampton | 0 | 3 | 0.0 | +0.0 |
| 257 | Dedrique Taylor | 15.0 | Cal St. Fullerton | 0 | 1 | 0.0 | +0.0 |
| 258 | Terry Truax | 16.0 | — | 0 | 2 | 0.0 | +0.0 |
| 259 | Tom Conrad | 15.0 | — | 0 | 1 | 0.0 | +0.0 |
| 260 | Jimmy Patsos | 15.0 | Siena | 0 | 1 | 0.1 | -0.1 |
| 261 | Kevin Bannon | 15.5 | — | 0 | 2 | 0.1 | -0.1 |
| 262 | John Brannen | 15.0 | Northern Kentucky | 0 | 1 | 0.1 | -0.1 |
| 263 | B.J. Hill | 15.0 | — | 0 | 1 | 0.1 | -0.1 |
| 264 | Randy Monroe | 15.0 | — | 0 | 1 | 0.1 | -0.1 |
| 265 | Bill Evans | 14.0 | Idaho St. | 0 | 1 | 0.1 | -0.1 |
| 266 | David Richman | 15.0 | North Dakota St. | 0 | 1 | 0.1 | -0.1 |
| 267 | Matt Brady | 16.0 | — | 0 | 1 | 0.1 | -0.1 |
| 268 | Stu Starner | 16.0 | — | 0 | 1 | 0.1 | -0.1 |
| 269 | Bill Bibb | 15.0 | — | 0 | 1 | 0.1 | -0.1 |
| 270 | Dave Calloway | 15.7 | — | 0 | 3 | 0.1 | -0.1 |
| 271 | Phil Cunningham | 15.0 | Troy | 0 | 1 | 0.1 | -0.1 |
| 272 | Bob Burton | 14.0 | — | 0 | 1 | 0.1 | -0.1 |
| 273 | Rob Senderoff | 14.0 | Kent St. | 0 | 1 | 0.1 | -0.1 |
| 274 | Gary Garner | 13.0 | — | 0 | 1 | 0.1 | -0.1 |
| 275 | Ken Burmeister | 14.0 | Incarnate Word | 0 | 1 | 0.1 | -0.1 |
| 276 | Bill Coen | 14.0 | Northeastern | 0 | 1 | 0.1 | -0.1 |
| 277 | Dino Gaudio | 6.5 | — | 1 | 2 | 1.1 | -0.1 |
| 278 | Greg Graham | 14.0 | — | 0 | 1 | 0.1 | -0.1 |
| 279 | Ray Harper | 15.5 | Jacksonville St. | 0 | 2 | 0.1 | -0.1 |
| 280 | Dave Magarity | 14.0 | — | 0 | 1 | 0.1 | -0.1 |
| 281 | John Shulman | 15.5 | — | 0 | 2 | 0.1 | -0.1 |
| 282 | Mike Brennan | 15.0 | American | 0 | 1 | 0.1 | -0.1 |
| 283 | Casey Alexander | 15.0 | Lipscomb | 0 | 1 | 0.1 | -0.1 |
| 284 | Carroll Williams | 15.0 | — | 0 | 1 | 0.1 | -0.1 |
| 285 | Frankie Allen | 14.5 | — | 0 | 2 | 0.1 | -0.1 |
| 286 | Chris Mooney | 9.5 | Richmond | 2 | 2 | 2.1 | -0.1 |
| 287 | Steve Pikiell | 13.0 | Rutgers | 0 | 1 | 0.1 | -0.1 |
| 288 | Jimmy Gales | 15.0 | — | 0 | 1 | 0.1 | -0.1 |
| 289 | Charles Woollum | 15.5 | — | 0 | 2 | 0.1 | -0.1 |
| 290 | Travis DeCuire |

Ex-Pence Indiana aide running for Congress defends resume
What Kind Of Legal And Government Framework Does Elon Musk Favor For Mars?
Dated and drab, Broad Ripple Park ready for reboot

Guest Post by Bill Watts: The Newfields Travesty: Taking the IMA out of Indianapolis
This is guest post that was sent to me by an Urban Indy reader, Bill Watts. A reminder that we run guest posts, so if you have an article that you wish to share, please e-mail it to me at kevin dot kastner at gmail dot com.
“Newfields,” the new brand for the institution formerly known as the Indianapolis Museum of Art, is more notable for what it does not say than for what it does.
It is not primarily concerned with art.
It is not in the city of Indianapolis.
And, most emphatically, it is no longer a museum.
Before I get to the consequence of these pointed omissions, let me begin with two concessions.
First, in some theoretical and hypothetical way, the name of the Indianapolis Museum of Art still exists. While the letterhead, website and sign on 38th Street all now proclaim the Newfields name, the IMA exists as part of the new brand. As Charles Venable, director of the institution formerly known as the IMA explained, in his announcement, “The Indianapolis Museum of Art, The Garden, Lilly House, and The Virginia B. Fairbanks Art & Nature Park: 100 Acres will all continue to exist as key attractions at Newfields, a Place for Nature and the Arts.”
In other words, this is a marketing stunt. We can now think of the IMA as comparable to the Big-K sub-brand at Kroger’s. If you root around on the bottom shelf, you may be able to find the Indianapolis Museum of Art, next to the Big-K spaghetti sauce. But your destination is Newfields, or Kroger’s, not Big-K, or the IMA.
Secondly, “Indianapolis Museum of Art” is not the original name of this 135-year-old institution. The original organization came into being in 1883 as the “Art Association of Indianapolis.” In 1895, the fledgling institution received a bequest from John Herron, a wealthy local real estate developer. As a result of this bequest, the organization purchased a plot of land at 16th and Pennsylvania and opened the John Herron Institute of Art, housing both an art gallery and an art school, in 1906.
For more than 60 years, both the art museum and the school resided on the 16th Street campus under the Herron Institute name. In 1967, it became necessary, for accrediting purposes, to separate the museum and the school. In that year, the Herron School was transferred to Indiana University, and it persists, in name at least, on the IUPUI campus.
In 1966, the J.K and Ruth Lilly donated Oldfields, the family estate bordered by Maple (38th St.) and Michigan Road to the Art Association. In preparation for the move to this new campus, the Art Association changed its name, in 1969, to the Indianapolis Museum of Art. Thus, the IMA was born in 1969, and it moved to its new campus in 1970.
As the IMA makes clear in its own history, Every Way Possible: 125 Years of the Indianapolis Museum of Art¸ published in 2008, this new name represented a kind of promise to the City of Indianapolis. Throughout the 1960s, as the museum looked for more space, there were concerns that moving to the edge of the city would sever the museum’s relationship to Indianapolis. At a protest in 1962, “one person stated that the Herron Museum belonged to all citizens, not just to the wealthy or to families with automobiles. Others spoke of the need to keep the city’s core strong and the obligations of institutions like the Museum to stay in a central location.” In renaming itself, the Museum was seeking to allay these concerns, and to say that, even as it moved from its central location, it remained committed to the City of Indianapolis and to its citizens.
Thus, in renaming itself “Newfields,” the former museum is reversing not the 135-year history of the institution, but the 50-year history of the IMA. Crucially, however, this new name reneges on the museum’s commitment to the city. In important ways, the museum is no longer in or of the city of Indianapolis.
To begin with, the “Newfields” name has no local resonance. Yes, some people in the city know that the original name of the Lilly estate was “Oldfields.” And, yes, it is also apparently true that the Lillies made a joke of this when they referred to the children’s house on the estate as “Newfields.” But the inevitable reaction of people who have lived in the city and known the museum over the years is, “What? Where did that come from?”
I can see how the name might appeal to a professional marketer from Brooklyn, or Bel Aire, or Bogota, making a pitch to the director of the IMA: “Newfields, it’s like Oldfields, but it’s new Get it? Get it?”
The rebranding reminds me of another infamous and ill-fated branding effort in the city. When the city’s venerable hospitals, Methodist and University, merged a few years ago, they hired a marketing company to come up with a new name for the organization. They called it “Clarian,” and they made a similar pitch: “Clarian, it’s like clarion, as in ‘clarion call,” but it has an ‘a’ instead of an ‘o.’ Get it? Get it?”
The Clarian name had no meaning for people who had a long attachment to Methodist and University hospitals. The name did not last, and the organization now calls itself “Indiana University Health.” I predict a similar future for the ill-conceived Newfields. It’s a nowhere name.
In a physical sense, Newfields has also removed itself from the city of Indianapolis. Like many long-term members of the Art Museum, I first caught wind of the changes to come two years ago, when the museum suddenly closed its pedestrian entrance on 42nd Street, and began building a series of internal barriers where none had existed before. These moves effectively closed the museum to the surrounding neighborhood, and ended access to the upper grounds for pedestrians and cyclists. I refer to this stage of development as the “fortification of the IMA.” Others began calling it an “art prison.”
At the same time that it closed access to pedestrians, the Museum also eliminated its charge for parking, and effectively made the grounds a landing pad for suburbanites from Zionsville, Carmel and Fishers seeking a bucolic experience. When he explained these changes, Venable emphasized his desire to make the museum grounds comfortable for pedestrians, and to maintain a “level of tranquility and atmosphere” for patrons. In taking measures for internal tranquility, however, Venerable forced pedestrians and cyclists coming to the museum to travel through the intersection of 38th St. and Michigan, one of the most dangerous in the city. And there is still no sidewalk that leads from the old pedestrian to the automobile entrances pedestrians are now forced to use. Newfields is the fulfillment of the worry expressed by the protester in 1962 that the museum would become accessible only “to the wealthy or to families with automobiles.”
This move to cut the museum off from local residents and from pedestrians and cyclists is all the more appalling because it flies in the face of recent developments in the city. While there is still much to be done, Indianapolis has made impressive strides in becoming more friendly to cyclists and pedestrians. Since the construction of the Monon Trail in 1999, the city has developed a remarkable network of trails that run along that run along Fall Creek, White River, Pleasant Run, and Pogue’s Run. During the Ballard years, we went from zero to 80 miles of bike lanes, with more now under development. And the city is rightfully proud of its Cultural Trail, which connects downtown neighborhoods and cultural destinations with a Danish-style pedestrian and cycling trail.
In my view, the IMA should have been actively working to connect itself with this developing system of pedestrian and cycling infrastructure. Ray Irwin, the architecture of our Greenways system, always spoke of his passion for “connectivity” as the guiding force in his efforts. He wanted to create ways for people to move from one area to another in the city without having to get in a car. The IMA could and should have been working to connect itself with its neighbors and other institutions. It should have joined partners in Midtown to bring the bike share program to the area, and to extend the Cultural Trail to its gates. It should have become more, and not less accessible to pedestrians. In this regard, the anti-urbanist agenda of Venable and the IMA board has been damaging both to the institution and to the City as a whole.
The fortification of the IMA was part of its efforts to raise additional funds by instituting a charge of $18 for admission not only to the Museum, but also to the grounds, both of which had previously been free. To justify what would inevitably be viewed as a very high price of admission to the Museum, patrons were offered access not just to the art within the buildings walls, but also to some of the most cherished outdoor spaces in the City. In addition, this strategy was designed to encourage more people to join the museum. Rather than pay $18 for a single entrance, patrons could pay $50 to $80 per year (subsequently raised to $55 to $100). The fortification was, then, a plan to monetize the grounds, and nudge more people into membership.
In an effort to draw more visitors and members to the IMA, the museum began de-emphasizing its art collections and developing outdoor attractions. Venable pointed to studies that showed that potential patrons from the central Indiana were relatively uninterested in art, but would be interested in “curated outdoor experiences.” In keeping with this line of thinking, the museum built a beer garden in one part of the greenhouse, brought back a popular putt-putt golf course designed by artists, planted thousands of bulbs for a spring flower show, and put on a large-scale display of Christmas lights. In these various ways, then, the museum was to become less a museum and more of an amusement park.
In responding to these changes, both critics and defenders of Newfields have used the word “elite.” Opponents suggest that the $18 admission charge makes the institution less accessible to citizens of the city, and therefore makes it more elite. Those who criticize the museum for turning away from art and toward beer gardens and putt-putt golf have been called “elitists” by defenders of Newfields, who defend a more populist and accessible approach to the former museum.
To my mind, the word “elite” doesn’t really work very well in either direction. I don’t think it unreasonable to impose an admission charge to the museum, although I shall have more to say below about how this charge was imposed and justified. On the other hand, there has always been a populist strain at the IMA; it is the home of both Van Gogh’s “Enclosed Field with Peasant” and Robert Indiana’s “LOVE.” Personally, I have no objection to the beer garden, the winter lights exhibit or the putt-putt golf. But I still want a serious art museum.
And here I think there is real reason to worry. The energy and resources of the institution seem to be flowing toward these “curated outdoor experiences,” and away from art. One way to see this is in the special exhibitions of the museum. The IMA had a very good record of bringing in exhibits that connected its patrons with developments in the rest of the world. In recent years, I have enjoyed and learned from exhibits on Matisse, Georgia O’Keefe, the Craftsman art movement, and art from Fontainebleau. I especially appreciated the 2013 exhibit of the works of the Chinese artist, Ai Wei Wei. I had read a lot about this artist, and I was grateful for and moved by the opportunity to see his works up close and in Indianapolis.
When the changes in the Museum got underway, I asked Charles Venable, in a private exchange, whether we would have exhibitions like the one focusing on Ai Wei Wei in the future. He responded that we would, but that the Museum would have to take greater care to make sure that these exhibitions paid for themselves. But the record of the past two years has been unimpressive, and the exhibitions for the foreseeable future look to be low-key affairs, drawing mostly on the IMA’s own collections. We seem to have gotten putt-putt golf instead of, and not in addition to, Ai Wei Wei. And that seems to me a real loss.
For me, the changes that have accompanied the Newfields branding campaign have been discouraging in and of themselves. But the pain has been compounded by the ways in which Charles Venable, the director, and Thomas Hiatt, the chair of the board, have explained and justified them. In particular, I object to their suggestion that these changes were necessary, in light of the financial needs of the institution, and that they have already proven successful.
In coming to grips with what has happened to our cherished institution, one must understand that the IMA was in some financial difficulty. These difficulties came from a variety of factors, including a decline in the value of the museum’s endowment (now over $350 million) during and after the Great Recession, and the accumulation of about $100 million in debt from recent expansions of the museum. These two factors meant that, even after a round of staff reductions, the Museum was drawing more than the 5 percent from its endowment that is customary and prudent to support its operations. It is my understanding that the board charged Dr. Venable with bringing this draw back to 5 percent over a number of years.
Without entering too deeply into the finances of the IMA, and without claiming financial expertise I do not possess, it seems to me that this situation called for adjustments but not for panic. One could have imagined any number of other ways of responding, without locking down the grounds, renaming the 135-year-old institution, and shifting the focus from art to “curated outdoor experiences.” One obvious course of action would have been to raise admission to the Museum to a more palatable $10 to 12, and to allow citizens of the city to continue to enjoy the grounds, as they had for more than 50 years. Going from free to a charge for each visit to the museum would surely have created a substantial new revenue stream, with little disruption or added expense.
In justifying this course of action, Venable and Hiatt have pointed to a record number of members of the museum-formerly-known-as-IMA. Newfields now has more than 17,000 members, but this is not a terribly impressive number. One can point to comparable or lesser museums with higher membership rates. In the 1970s, when the museum did not charge an entrance fee, it claimed more than 12,000 members. The mere imposition of an entrance fee, where none existed before, is bound to drive membership up. And it seems to me that this would have happened whether the IMA charged $12 for admission, and allowed the public free admission to the grounds, or charged $18 and closed the grounds.
Perhaps more than anything, though, I am disturbed by the lack of accountability of Venable and the Board to members and to the general public. I have a relationship with the IMA that goes back to the early 70s, when I bought a membership from earnings from my newspaper route. I understand that, as an individual member, I cannot expect to have a voice in the direction of the Museum. Nevertheless, I have been astonished by how little interest the leadership and board of the IMA have in what members think about these changes. There is quite a bit of discontent with the direction of the museum among long-time members and even some donors, but Venable and Hiatt seem to have insulated themselves from this criticism.
I understand the fiduciary responsibility of the board, and the imperative they must honor to ensure the long-term solvency of the museum. I think they have other obligations as well. The IMA has grown through the generosity of generations of donors, and through the tax-protection enjoyed by both the institution and its endowment. While it is a private institution, it has commitments to the public and to the ages. I am not sure the museum is fully honoring those commitments. Newfields looks more and more like the vanity project of Hiatt and Venable.
In many ways, it is fitting that Newfields has been unveiled under the Trump administration. My attitude toward Newfields parallels my attitudes to this country under Trump: I object strenuously to the policies, overall direction and communication practices of this administration, but I do not wish for the enterprise to fail. After the fortification of the IMA, I refused to renew my membership, and I boycotted the museum. After a year, though, I came back. After the Newfields transformation, I have let my membership lapse again, and have not dared set foot on the campus.
I expect that I will be back again. I can only hope, though, that this ill-considered effort to Make the IMA Great Again will pass, and that new and wiser leadership will one day work with the community, rather than against it, to create a better and stronger Art Museum.
Millennial Footprints
William Frey, a demographer at Brookings, recently put up a post on Millennials, finding at their biggest footprint was in the South and West. Here’s one of his charts:
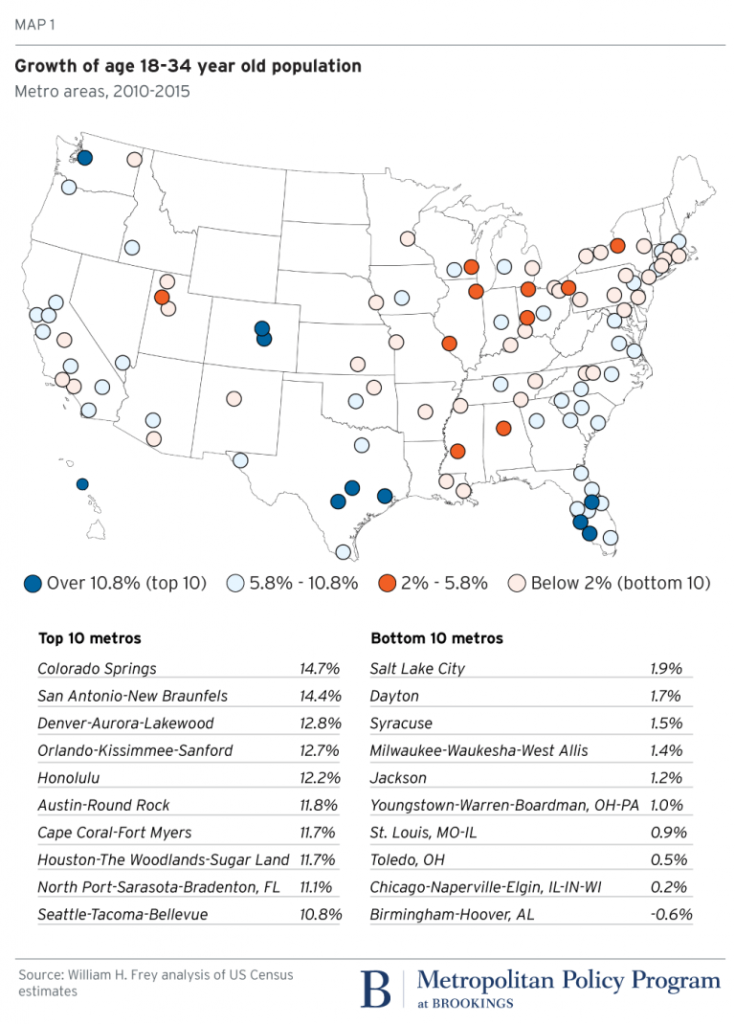
He notes:
Overall, with a few exceptions like Florida, the South and West “Sun Belt” areas tend to show the highest growth and biggest millennial footprints, while those in the North and West “Snow Belt” areas are more likely to register low growth and smaller millennial shares. This bodes well for millennials’ impact in the more rapidly growing regions of the country.
Click through to read the whole thing.
Pete Saunders also offers some demographic thoughts.