Tom Roche
Shared posts
BONUS: Jeremy talks Milo on Politically Re-Active
Tom Rocheto hear the full interview, goto https://rss.art19.com/episodes/b9b49af5-5796-4c34-9122-29b796447b59.mp3
Puerto Rico’s $123 Billion Bankruptcy Is the Cost of U.S. Colonialism
Tom Rochenot sure why this has byline='Roger Hodge': @ https://theintercept.com/2017/05/09/puerto-ricos-123-billion-bankruptcy-is-the-cost-of-u-s-colonialism/ the byline is the (far better known) Juan González
Last week Puerto Rico officially became the largest bankruptcy case in the history of the American public bond market. On May 3, a fiscal control board imposed on the island’s government by Washington less than a year ago suddenly announced that Puerto Rico’s economic crisis had “reached a breaking point.” The board asked for the immediate appointment of a federal judge to decide how to deal with a staggering $123 billion debt the commonwealth government and its public corporations owe to both bondholders and public employee pension systems.
The announcement sparked renewed press attention to a Caribbean territory that many have dubbed America’s Greece. The island’s total debt, according to the control board, is unprecedented for any government insolvency in the U.S., and it is certain to mushroom quickly if no action is taken. Detroit’s bankruptcy, by comparison, involved just $18 billion — one-ninth the size of Puerto Rico’s.
Within days, Supreme Court Chief Justice John Roberts, acting under a provision of the Puerto Rico Oversight, Management, and Economic Stability Act (known as PROMESA), which was enacted last June, appointed federal Judge Laura Taylor Swain from the Southern District of New York to take over the Puerto Rico case. A former bankruptcy court judge who was appointed to the federal court by President Clinton, Swain famously presided over the long criminal trial of employees of the Bernie Madoff Ponzi scheme.
Few press reports on Puerto Rico’s troubles, however, have bothered to examine the deeper issues behind this crisis.

Governor’s palace party in Puerto Rico, circa 1900.
Photo: Keystone-France/Gamma-Keystone/Getty Images
First, the colonial relationship that has prevailed between the U.S. and Puerto Rico since 1898 is no longer viable. Puerto Rico is the largest overseas territory still under the sovereign control of the United States, and it is the most important colonial possession in this nation’s history. That relationship produced uncommon profits for American subsidiaries on the island for more than a century, even as the federal government kept claiming that the Commonwealth of Puerto Rico, created in 1952, was a self-governing territory. But now, with a Washington-appointed board directly overseeing the island’s economy, and with a pivotal Supreme Court decision last year affirming that Congress continues to exercise sovereign power over Puerto Rico, the mask of self-governance has been removed.
The old commonwealth is effectively dead. Absent a huge infusion of U.S. public dollars to prop up its collapsing economy, a scenario that is nearly impossible with a Trump White House and a Republican-controlled Congress, that relationship cannot be revived. Political leaders in both Washington and San Juan, whether they like it or not, are being propelled to fashion a new political and economic status for the territory. They will have to finally decide whether to completely annex Puerto Rico as the 51st state or acknowledge that it still remains a distinct nation, with the right to its own sovereignty and independence.
Second, the impact of Puerto Rico’s bankruptcy will continue to reverberate throughout the U.S. bond market, far more than most Wall Street analysts have so far acknowledged. The PROMESA control board has warned that even with massive cuts to government services and new projected revenues from higher taxes and fees, Puerto Rico will still generate slightly less than $8 billion in budget surpluses over the next 10 years, when some $35 billion in debt service comes due. In other words, three-quarters of the debt cannot be repaid. That is not just a haircut for bondholders; it is a head-shaving, one that will send shock waves throughout the municipal bond market. After all, bonds backed by the full faith-and-credit of local government entities have long been considered among the safest of investments.
Years of court battles between Puerto Rico and contending groups of creditors are now certain. “The economy of Puerto Rico will be put on hold for years,” Andrew Rosenberg, adviser to the Ad Hoc Group of Puerto Rico General Obligation Bondholders, told the Associated Press. “Make no mistake: The board has chosen to turn Puerto Rico into the next Argentina.”

A Puerto Rican flag painted on the doorway of an abandoned building in San Juan, Puerto Rico, on May 1, 2016.
Photo: Erika P. Rodriguez/Bloomberg News/Getty Images
The Debt Is Not Payable
Civil society groups contend that the plunder of the Puerto Rican people through predatory and even illegal bond deals that island politicians concocted together with top Wall Street firms will now be exposed.
Amazingly, the 23-page petition that the federal government’s own financial control board filed in U.S. District Court in San Juan reached the exact same conclusion that Puerto Rico’s former Gov. Alejandro García Padilla reached back in June 2015 — that the island’s debt is “not payable.”
In the nearly two years since García Padilla sounded the alarm, however, Washington has done almost nothing to alleviate the economic catastrophe afflicting 3.4 million U.S. citizens in Puerto Rico, except to establish the control board by enacting PROMESA.
On an island that has lost 10 percent of its population in the last 10 years, where 46 percent of the population lives below the U.S. poverty level, where the unemployment rate is more than 11 percent, and where the labor force participation hovers around 40 percent, lawmakers in Congress have kept insisting on greater austerity from Puerto Rico’s population. The reality is such dire conditions would never be tolerated among U.S. citizens in any other jurisdiction, yet they are allowed to persist in Puerto Rico.
During the past two years, the commonwealth government has sharply raised electricity and water rates. It has increased the sales tax (now a value added tax) to 11.5 percent. It has proposed ending all pensions for new workers and cutting existing benefits by an average of 10 percent. And last week, it announced the closing of 179 public schools for the coming school year. In addition, the control board has called for a $450 million cut over the next four years to the island’s 70,000-student public university.
Under the control board’s pressure, Gov. Ricardo Rosselló, who took office in January, is eyeing the privatization of the government-owned electric company, the water and sewer authority, even the public transit system. But even massive cuts and selling off public assets can’t solve the problem that there aren’t enough jobs on the island, that young people keep fleeing to the United States, and that Puerto Rico’s government is powerless to fashion its own economic and trade policy independently from the U.S.

Ricardo Rosselló, governor of Puerto Rico, listens during a meeting at the Puerto Rico Industrial Development Company headquarters in San Juan, Puerto Rico, on March 28, 2017.
Photo: Alejandro Granadillo/Bloomberg News/Getty Images
For decades, Puerto Rico was important to the American economy as a center of sugar cane growing, then as a tax haven for manufacturing and pharmaceutical companies, and as a military stronghold and bulwark against the spread of communism in Latin America. But now it is no longer needed for any of these things. Most of the U.S. military bases have closed, and Congress began in 1996 to phase out the island’s tax haven status. As soon as the last of the federal tax breaks — known as Section 936 — ended in 2006, corporations started leaving and the island plunged into a recession from which it has yet to recover. For the past 20 years, a succession of island governments has been closing structural operating deficits with borrowed funds supplied by Wall Street firms eager to market its triple tax-exempt bonds to wealthy and middle-class Americans and Puerto Ricans.
Investors were especially drawn to a provision of the Puerto Rico constitution that required the government to pay general obligation debt service ahead of any other expenses, and by the fact that Puerto Rico and its public corporations were legally prevented from resorting to Chapter 9 bankruptcy, the portion of the bankruptcy code that applies to most local governments and municipalities.
Until 1978, Congress had included all the territories and possessions of the United States under Chapter 9, so Puerto Rico had bankruptcy protection until then. But between ’78 and the early ’80s, there were several changes to U.S. bankruptcy law. In 1984, an amendment was inserted into the law by South Carolina Sen. Strom Thurmond that specifically excluded Puerto Rico from Chapter 9. No reason was given. No federal policy or interest in the change was spelled out in the amendment process. By a few simple phrases in an amendment that few people noticed, Congress laid the basis for the unique situation Puerto Rico confronted last year. It was not only broke, there was no established legal recourse for it to get a court to decide how its many creditors would get paid or how much.
The PROMESA bill Congress enacted at least created a new type of Chapter 9-like process for the island. The bill stipulates that if the Puerto Rican government and the control board cannot reach voluntary settlements with bondholders, a judge can be appointed and creditors forced to accept a settlement, known as a “cram-down.”
But the law’s constitutionality has yet to be tested, and with so much money at stake the various groups of bondholders are determined to wage a titanic legal battle against it.
On May 5, for instance, Ambac Assurance Corp., one of the major insurers of Puerto Rico bonds, filed suit in U.S. District Court in Puerto Rico against the Commonwealth and the Oversight Board, and did so with uncommonly strident language:
Sovereignty confers great power, but it does not authorize lawlessness. This action seeks to halt the latest in a series of unconstitutional and unlawful acts that have been the unfortunate modus operandi of the Commonwealth government in seeking to manage its financial and economic distress. Instead of rectifying these abuses, the Oversight Board created by Congress to restore fiscal responsibility to the Commonwealth has affirmatively exacerbated them, giving its imprimatur to an ongoing scheme of constitutional and statutory violations that can only be called theft.
Ambac has insured billions of dollars in sales tax revenue bonds, known as COFINA bonds, that Puerto Rico has issued since 2006, and the company, along with other bond insures, faces enormous losses from any cram-down.
Meanwhile, another group of bondholders who were involved in $1.4 billion of Puerto Rico’s last major general obligation bonds, issued in 2014, filed suit in New York state Supreme Court. Those bondholders, led by hedge funds Aurelius Capital Management and Monarch Alternative Capital, insist that Puerto Rico’s Constitution requires them to be paid first from all available revenues. The general obligation bondholder group, along with many civil society groups, insist that all the COFINA bonds — and they represent nearly $18 billion of the total $74 billion bond debt — were illegally issued and should not be repaid.
That’s because the Puerto Rico constitution specifically forbids debt service and principal that surpasses more than 15 percent of annual government revenues. The Puerto Rico legislature specifically created COFINA to maneuver around that 15 percent limit, and it then guaranteed the payment of that debt from sales tax revenues. But the legality of that maneuver has never been tested in court.
While the contending bondholder groups battle in the courts, the PROMESA board has now sided with the Puerto Rico government that bondholders will have to accept major reductions in payments.
“From current revenues, the Commonwealth and its instrumentalities cannot satisfy their collective $74 billion debt burden and $49 billion pension burden and pay their operating expenses,” the fiscal control board concluded last week after months of poring over Puerto Rico financial records.
And the island’s budgetary crisis “is about to worsen exponentially,” the control board warned, “due to the elimination of approximately $850 million in Affordable Care Act Funds in fiscal year 2018.” The total loss of federal health care funds, according to the board, is expected to reach $16 billion over the next 10 years. On top of that, the government pension systems are almost out of cash and will need $1.5 billion a year just to keep up payments to current retirees. Unlike municipal workers in the U.S., most public employees in Puerto Rico are not part of the social security system, so those pensions are their only retirement income.
Meanwhile, Donald Trump and Republican leaders in Congress insist there will be no bailout of Puerto Rico, no extra federal assistance to the island’s population.
They want to ignore the fact that back in the 1990s under Bill Clinton and the Newt Gingrich Congress, Washington’s leaders realized they had to take drastic measures to save the District of Columbia from economic collapse. Congress established a fiscal control board just as it has with Puerto Rico.
But that board soon concluded that DC had structural problems that required federal help. In 1997, a reform package accomplished the following: the federal government assumed the city’s debts, it took responsibility for the local courts and prisons, it increased the rate for Medicaid reimbursements to the district, and it took over the city’s underfunded employee pensions.
As a result, the district emerged from economic calamity. Today it is a vibrant and prosperous city.
Federal lawmakers will either have to provide massive assistance to Puerto Rico, or they will have to move rapidly to change the island’s political and economic status. After a century of colonial rule by Washington and decades of predatory debt from Wall Street, the bill has come due.
Top photo: Pedestrians walk past an old hotel in the Condado area of San Juan, Puerto Rico, in 2015.
The post Puerto Rico’s $123 Billion Bankruptcy Is the Cost of U.S. Colonialism appeared first on The Intercept.
Democracy Now! 2017-05-10 Wednesday
Tom Roche.... and supposedly there will be a web-exclusive part 2.
Democracy Now! 2017-05-10 Wednesday
- Headlines for May 10, 2017
- Glenn Greenwald on Trump's "Shocking" Firing of FBI Chief James Comey Amid Russian Probe
- Glenn Greenwald: Independent Probe Needed to Uncover Truth Behind Russia's Role in 2016 Election
- Greenwald: Hillary is to Blame for Losing 2016 Election, Not James Comey
- Could Firing of James Comey Mark the Beginning of the End for Trump Presidency?
- Greenwald: Supporting U.S.-Russia Relations Should Be Encouraged, Not Viewed as Sign of Treason
Behind the News, 5/4/17
Tom RocheFirst, Margaret Corvid on the British election, the Labour Party—and sex work. Second, Emre Öngün on Turkey’s deeper slide into authoritarianism.
Katharina von Bora
Tom Rochebad link
Shattered, How Clinton’s Campaign Went Off the Rails
Tom Rocheexcellent
#597 The Velvet Underground & Nico
Tom Rocheexcellent full-hour Classic Album Dissection (minus ads throughout and call-ins @ end)
Is France the future?
Tom Rochequite possibly the worst, most anti-empirical, pro-Macron boosterism committed in the name of analysis of French politics. A real low point for LNL and Phillip Adams
It's Spring! Beware of turtles, teens and fudge!
Tom Rochererun
The Dig: Adam Johnson on All the Fake News That's Fit to Print
Tom Rocheexcellent. Johnson is one of the best media critics around.
The race to build the world’s first sex robot – podcast
Tom Rocheoriginal article/transcript by Jenny Kleeman @ https://www.theguardian.com/technology/2017/apr/27/race-to-build-world-first-sex-robot
Three Reasons Bret Stephens Should Not Be a NYT Columnist–and the Real Reason He Is One
Tom Rochethe NYT origin myth at end (from John L. Hess' history) is *very* explanatory.
You know the reasons why Bret Stephens should not be a New York Times columnist:
1. He’s a climate denier.

Wall Street Journal (7/1/08)
Here’s a question for the New York Times editors: Do you think there’s a meaningful chance that virtually all climate scientists are wrong and Bret Stephens is right when he says “temperatures will be about the same” in a hundred years as they are now (Wall Street Journal, 11/30/15)?
If they do believe this, I would suggest they have a lot to learn about climate science—and about probability. But that doesn’t seem to be their position; a month ago, the paper ran an editorial (3/28/17) rebuking Donald Trump for repudiating “the rock-solid scientific consensus that without swift action the consequences of climate change—rising seas, more devastating droughts, widespread species extinction—are likely to get steadily worse.”
But if the editors recognize that there’s a “rock-solid scientific consensus” on the dire effects of climate change, what’s the value in having a columnist who ridicules the “mass hysteria phenomenon known as global warming” (Wall Street Journal, 7/1/08), who asserts that his opinion trumps that science—based on arguments like “a guy I know just had a baby and he’s a big global warming, climate change activist” and “my wife is German, so I know something about German energy policy” (Think Progress, 4/28/17)?
Is this how serious people discuss an ongoing global catastrophe? How is it more helpful than people on the Titanic telling their fellow passengers not to get into lifeboats, because the ship is unsinkable?
If it wasn’t abundantly clear that Stephens has no actual knowledge of or interest in climate science, the fact that the Times had to run a correction on the one fact about climate included in his inaugural column calling for more skepticism of climate scientists should have driven that home.
2. He advocates a crime against humanity.

Wall Street Journal (12/15/14)
“I am not sorry Khalid Sheikh Mohammed, the operational mastermind of 9/11, was waterboarded 183 times,” Stephens wrote in the Wall Street Journal (12/15/14). Waterboarding, despite the word games the Bush administration liked to play (abetted by the New York Times), is torture—defined by the UN as “any act by which severe pain or suffering, whether physical or mental, is intentionally inflicted on a person.” And torture is a crime against humanity—included on the same list with murder, enslavement, extermination and rape.
Does the New York Times want to open the floor to debate over whether slavery is sometimes good? Genocide? Rape? By putting Stephens on its op-ed page, they’ve become the kind of paper that thinks the wrongness of such things is a matter of opinion.
3. He’s a racist.

Wall Street Journal (10/12/15)
Introducing Stephens, New York Times editorial page editor James Bennet (4/28/17) took pains to note that not just any opinion was allowed on the Times op-ed page: “There’s no place for bigotry or dishonesty in intelligent discussion,” he wrote.
So how did Stephens get his job? This is the writer (Wall Street Journal, 8/15/16) who insisted that “the Arab world’s problems are a problem of the Arab mind,” or to be more specific, “the disease of the Arab mind.” Elsewhere (Wall Street Journal, 10/12/15) he accused Palestinians of having a “communal psychosis” that debunked “comforting fictions about all people being basically good, or wanting the same things for their children, or being capable of empathy”—Palestinians, apparently, being different from regular humans in these respects.
Even one of Stephens’ new colleagues, Times Cairo bureau chief Declan Walsh, pointed out that “ascribing a pathological condition to an entire race of people” is “not cool.” The irony is that the rationale Stephens offers for his communal hatred of Palestinians is that they have been “perverted” by communal hatred of Jews. What do you suppose Stephens—or the Times—would make of a writer that talked about the “disease of the Jewish mind,” or suggested that Israeli violence proved that Jews were not “capable of empathy”?
But Palestinians are not the only group about which Stephens likes to make sweeping put-downs. Utilizing his disease metaphor again, he wrote (Wall Street Journal, 8/29/16) that
the Black Lives Matter movement…has metastasized into the big lie of America, land of the irredeemably racist. For BLM and its cadres, there is no moral agency in the black community, no choices African-Americans can make for themselves to shape their own destiny for good or ill. There is merely a nonstop conspiracy by the structures of white power to keep black people down.
“Institutionalized racism is an imaginary enemy,” Stephens wrote earlier (Wall Street Journal, 11/30/15) because “the future of liberal racialism…requires periodic sightings of the ghosts of a racist past”—this in a country where young black men are nine times more likely to be killed by police than other people, and where a major bank targeted “mud people” for predatory loans.
Stephens’ contempt for the “lack of moral agency” of those with dark skin doesn’t stop at the water’s edge. In a piece headlined “Haiti, Sudan, Côte d’Ivoire: Who Cares?” (Wall Street Journal, 1/11/11), Stephens described troubles in three mostly black nations and argued that “colonialism may be the best thing that could happen to at least some countries in the postcolonial world”—due to “the depravity of the locals.”

New York Times (4/22/17). Note the visual identification of bringing on Bret Stephens with listening to coal miners.
This is alt-right stuff. But none of it rises to the level of bigotry for Bennet, the editorial page editor.
For Times public editor Liz Spayd (4/22/17), who’s supposed to keep tabs on the paper for us readers, the idea of looking for bias in Stephens’ work was treated as faintly ridiculous: After his hiring was announced, she wrote, “readers and left-leaning critics…rummaged through his columns for proof that he is a climate change denier, a bigot or maybe a misogynist.” (The last charge related to Stephens’ facile, casually race-baiting dismissal of campus rape statistics: “If modern campuses were really zones of mass predation—Congo on the quad—why would intelligent young women even think of attending a coeducational school?”—Wall Street Journal, 11/30/15.)
Spayd did acknowledge that she herself was “wary about some of his more inflammatory language,” but said it was “hard to tease apart objections to Stephens’ work from objections to hiring any conservative at all,” and declared she fully supported “Bennet’s aim of hiring people who don’t conform to a liberal orthodoxy of thought.”
The orthodoxy on the New York Times op-ed page, though, isn’t “liberalism”; note that Stephens is the third representative of his ideological niche, the anti-Trump conservative, to currently have a home there. What is glaringly missing from the paper’s opinion roster, as Adam Johnson (FAIR.org, 4/20/17) pointed out, is anyone to the left of Hillary Clinton—surely a larger portion of both the Times readership and the public at large than Republicans who find Trump distasteful.
To understand this anomaly—and the real reason that the New York Times would rather have a climate-denying bigot on its staff than a single-payer advocate—it helps to go back to the beginning of the Times dynasty, as Times veteran John L. Hess (Extra!, 1/00) did in his review of The Trust: The Powerful and Private Family Behind the New York Times, by Susan Tifft and Alex Jones (not that Alex Jones):
How did [Adolph] Ochs, a virtual bankrupt from Chattanooga, persuade Wall Street to set him up with the moribund New York Times? Answer: The financiers were anxious to keep the paper alive as a Democratic voice against the populist Democratic candidate for president, William Jennings Bryan, who was stirring the masses with that speech about the Cross of Gold. Ochs bought a fine new suit, set up a fake bank account as reference, and persuaded J.P. Morgan and others to bankroll the purchase. His paper promptly pilloried Bryan, and Ochs marched with his staff in a businessmen’s parade against him.
Much has changed since 1896, but in 2017, the Times still defends establishment, business-oriented liberalism against the populist left. In part it does this by attacking the left directly—see the columns of Paul Krugman during the 2016 Democratic primaries—but the more meaningful sustenance they give to the liberal elite is to validate them as the left-most pole of respectable discourse.
And that, in turn, requires that the neo-liberals have a right wing, and only a right wing, to argue with and present themselves as a bastion against. It can’t be a bomb-throwing right, as represented by Trump—the point is to preserve the liberal establishment, not to eradicate it—but it doesn’t pay for the right to be too polite, either.
After all, if it weren’t for the threat of the climate change-denying, torture-endorsing, race-baiting Bret Stephenses of the world—what would the New York Times’ pro-business liberals have to threaten the genuine left with?
You can send a message to the New York Times at letters@nytimes.com or to public editor Liz Spayd at public@nytimes.com (Twitter:@NYTimes or @SpaydL). Please remember that respectful communication is the most effective.
May Day History and Protests
Tom Rochegood 2nd segment (starting ~33:55) on general strikes and US labor history esp SF Bay area 1934-1946, with Fred Glass @ City College of SF: https://kpfa.org/episode/upfront-may-1-2017/
May Day and Trump’s 100 Days
Tom Rochegood though unfocused interview with Vijay Prashad
The ways women age - Beauty politics
Tom Rochelink 404s
Behind the News, 4/27/17
Tom RocheSebastian Budgen on the second round of the French elections, pitting a centrist against a fascist. And Sofia Japaridze on how foreign NGOs turned Georgia (the country) into a broke libertarian paradise.
Ex-Brazilian Foreign Minister Celso Amorim on Rousseff's Ouster, Trump, Syria & Why Diplomacy Works
Tom Rocheexcellent, and very wide-ranging, far beyond the topics mentioned above.
Brazilian diplomat Celso Amorim was once described by the magazine Foreign Policy as the world's best foreign minister. He served as foreign minister under two Brazilian presidents, mostly recently Luiz Inácio Lula da Silva. Amorim is known for supporting South-South cooperation between developing nations, recognizing the state of Palestine, diplomatically negotiating a resolution to the Iranian nuclear issue and reversing widespread economic inequality in Brazil through an income transferral program called "Bolsa Famíliar." He has just come out with a new book, "Acting Globally: Memoirs of Brazil's Assertive Foreign Policy."
Noam Chomsky: Racing Toward the Climate Precipice
Tom RocheNot just about global warming, but also threat of nuclear war, esp due to current US/NATO anti-Russian aggression. Chomsky cites interesting open-access article on how the H. W. Bush regime double-crossed Russia/USSR re NATO non-/expansion into Eastern Europe in 1989-1990: see http://dx.doi.org/10.1162/ISEC_a_00236 (Deal or No Deal? The End of the Cold War and the U.S. Offer to Limit NATO Expansion, Joshua R. Itzkowitz Shifrinson, International Security 2016 40:4, 7-44, doi:0.1162/ISEC_a_00236)
The myth of the ‘lone wolf’ terrorist – podcast
Tom Rocheoriginal article/transcript by Jason Burke @ https://www.theguardian.com/news/2017/mar/30/myth-lone-wolf-terrorist
Chris Moffitt: Effectively Using Matplotlib
Tom RocheSeems very well written. Summary:
> I recommend the following steps for learning how to use matplotlib:
> 1. Learn the basic matplotlib terminology, specifically what is a Figure and an Axes .
> 2. Always use the object-oriented interface. Get in the habit of using it from the start of your analysis.
> 3. Start your visualizations with basic pandas plotting.
> 4. Use seaborn for the more complex statistical visualizations.
> 5. Use matplotlib to customize the pandas or seaborn visualization.
Introduction
The python visualization world can be a frustrating place for a new user. There are many different options and choosing the right one is a challenge. For example, even after 2 years, this article is one of the top posts that lead people to this site. In that article, I threw some shade at matplotlib and dismissed it during the analysis. However, after using tools such as pandas, scikit-learn, seaborn and the rest of the data science stack in python - I think I was a little premature in dismissing matplotlib. To be honest, I did not quite understand it and how to use it effectively in my workflow.
Now that I have taken the time to learn some of these tools and how to use them with matplotlib, I have started to see matplotlib as an indispensable tool. This post will show how I use matplotlib and provide some recommendations for users getting started or users who have not taken the time to learn matplotlib. I do firmly believe matplotlib is an essential part of the python data science stack and hope this article will help people understand how to use it for their own visualizations.
Why all the negativity towards matplotlib?
In my opinion, there are a couple of reasons why matplotlib is challenging for the new user to learn.
First, matplotlib has two interfaces. The first is based on MATLAB and uses a state-based interface. The second option is an an object-oriented interface. The why’s of this dual approach are outside the scope of this post but knowing that there are two approaches is vitally important when plotting with matplotlib.
The reason two interfaces cause confusion is that in the world of stack overflow and tons of information available via google searches, new users will stumble across multiple solutions to problems that look somewhat similar but are not the same. I can speak from experience. Looking back on some of my old code, I can tell that there is a mishmash of matplotlib code - which is confusing to me (even if I wrote it).
Another historic challenge with matplotlib is that some of the default style choices were rather unattractive. In a world where R could generate some really cool plots with ggplot, the matplotlib options tended to look a bit ugly in comparison. The good news is that matplotlib 2.0 has much nicer styling capabilities and ability to theme your visualizations with minimal effort.
The third challenge I see with matplotlib is that there is confusion as to when you should use pure matplotlib to plot something vs. a tool like pandas or seaborn that is built on top of matplotlib. Anytime there can be more than one way to do something, it is challenging for the new or infrequent user to follow the right path. Couple this confusion with the two different API’s and it is a recipe for frustration.
Why stick with matplotlib?
Despite some of these issues, I have come to appreciate matplotlib because it is extremely powerful. The library allows you to create almost any visualization you could imagine. Additionally, there is a rich ecosystem of python tools built around it and many of the more advanced visualization tools use matplotlib as the base library. If you do any work in the python data science stack, you will need to develop some basic familiarity with how to use matplotlib. That is the focus of the rest of this post - developing a basic approach for effectively using matplotlib.
Basic Premises
If you take nothing else away from this post, I recommend the following steps for learning how to use matplotlib:
- Learn the basic matplotlib terminology, specifically what is a
Figureand anAxes. - Always use the object-oriented interface. Get in the habit of using it from the start of your analysis.
- Start your visualizations with basic pandas plotting.
- Use seaborn for the more complex statistical visualizations.
- Use matplotlib to customize the pandas or seaborn visualization.
This graphic from the matplotlib faq is gold. Keep it handy to understand the different terminology of a plot.

Most of the terms are straightforward but the main thing to remember is that the
Figure
is the final image that may contain 1 or more axes. The
Axes
represent an
individual plot. Once you understand what these are and how to access them through
the object oriented API, the rest of the process starts to fall into place.
The other benefit of this knowledge is that you have a starting point when you see things on the web. If you take the time to understand this point, the rest of the matplotlib API will start to make sense. Also, many of the advanced python packages like seaborn and ggplot rely on matplotlib so understanding the basics will make those more powerful frameworks much easier to learn.
Finally, I am not saying that you should avoid the other good options like ggplot (aka ggpy), bokeh, plotly or altair. I just think you’ll need a basic understanding of matplotlib + pandas + seaborn to start. Once you understand the basic visualization stack, you can explore the other options and make informed choices based on your needs.
Getting Started
The rest of this post will be a primer on how to do the basic visualization creation in pandas and customize the most common items using matplotlib. Once you understand the basic process, further customizations are relatively straightforward.
I have focused on the most common plotting tasks I encounter such as labeling axes, adjusting limits, updating plot titles, saving figures and adjusting legends. If you would like to follow along, the notebook includes additional detail that should be helpful.
To get started, I am going to setup my imports and read in some data:
import pandas as pd
import matplotlib.pyplot as plt
from matplotlib.ticker import FuncFormatter

df = pd.read_excel("https://github.com/chris1610/pbpython/blob/master/data/sample-salesv3.xlsx?raw=true")
df.head()
| account number | name | sku | quantity | unit price | ext price | date | |
|---|---|---|---|---|---|---|---|
| 0 | 740150 | Barton LLC | B1-20000 | 39 | 86.69 | 3380.91 | 2014-01-01 07:21:51 |
| 1 | 714466 | Trantow-Barrows | S2-77896 | -1 | 63.16 | -63.16 | 2014-01-01 10:00:47 |
| 2 | 218895 | Kulas Inc | B1-69924 | 23 | 90.70 | 2086.10 | 2014-01-01 13:24:58 |
| 3 | 307599 | Kassulke, Ondricka and Metz | S1-65481 | 41 | 21.05 | 863.05 | 2014-01-01 15:05:22 |
| 4 | 412290 | Jerde-Hilpert | S2-34077 | 6 | 83.21 | 499.26 | 2014-01-01 23:26:55 |
The data consists of sales transactions for 2014. In order to make this post a little shorter, I’m going to summarize the data so we can see the total number of purchases and total sales for the top 10 customers. I am also going to rename columns for clarity during plots.
top_10 = (df.groupby('name')['ext price', 'quantity'].agg({'ext price': 'sum', 'quantity': 'count'})
          .sort_values(by='ext price', ascending=False))[:10].reset_index()
top_10.rename(columns={'name': 'Name', 'ext price': 'Sales', 'quantity': 'Purchases'}, inplace=True)
Here is what the data looks like.
| Name | Purchases | Sales | |
|---|---|---|---|
| 0 | Kulas Inc | 94 | 137351.96 |
| 1 | White-Trantow | 86 | 135841.99 |
| 2 | Trantow-Barrows | 94 | 123381.38 |
| 3 | Jerde-Hilpert | 89 | 112591.43 |
| 4 | Fritsch, Russel and Anderson | 81 | 112214.71 |
| 5 | Barton LLC | 82 | 109438.50 |
| 6 | Will LLC | 74 | 104437.60 |
| 7 | Koepp Ltd | 82 | 103660.54 |
| 8 | Frami, Hills and Schmidt | 72 | 103569.59 |
| 9 | Keeling LLC | 74 | 100934.30 |
Now that the data is formatted in a simple table, let’s talk about plotting these results as a bar chart.
As I mentioned earlier, matplotlib has many different styles available for
rendering plots. You can see which ones are available on your system using
plt.style.available
.
plt.style.available
['seaborn-dark',
 'seaborn-dark-palette',
 'fivethirtyeight',
 'seaborn-whitegrid',
 'seaborn-darkgrid',
 'seaborn',
 'bmh',
 'classic',
 'seaborn-colorblind',
 'seaborn-muted',
 'seaborn-white',
 'seaborn-talk',
 'grayscale',
 'dark_background',
 'seaborn-deep',
 'seaborn-bright',
 'ggplot',
 'seaborn-paper',
 'seaborn-notebook',
 'seaborn-poster',
 'seaborn-ticks',
 'seaborn-pastel']
Using a style is as simple as:
plt.style.use('ggplot')
I encourage you to play around with different styles and see which ones you like.
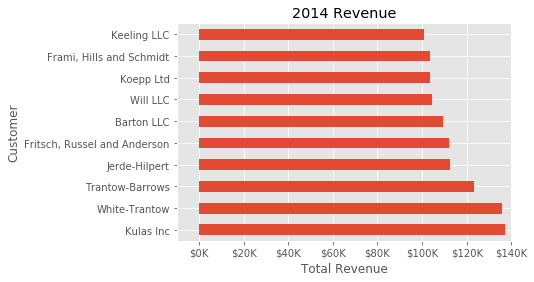
Now that we have a nicer style in place, the first step is to plot the data using the standard pandas plotting function:
top_10.plot(kind='barh', y="Sales", x="Name")
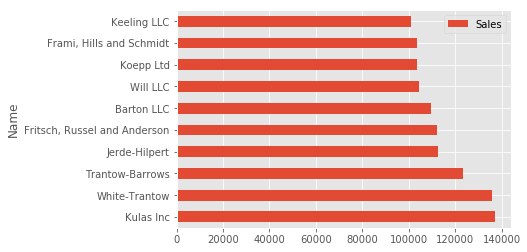
The reason I recommend using pandas plotting first is that it is a quick and easy way to prototype your visualization. Since most people are probably already doing some level of data manipulation/analysis in pandas as a first step, go ahead and use the basic plots to get started.
Customizing the Plot
Assuming you are comfortable with the gist of this plot, the next step is
to customize it. Some of the customizations (like adding titles and
labels) are very simple to use with the pandas
plot
function. However,
you will probably find yourself needing to move outside of that functionality
at some point. That’s why I recommend getting in the habit of doing this:
fig, ax = plt.subplots()
top_10.plot(kind='barh', y="Sales", x="Name", ax=ax)
The resulting plot looks exactly the same as the original but we added an additional call
to
plt.subplots()
and passed the
ax
to the plotting function. Why
should you do this? Remember when I said it is critical to get access
to the axes and figures in matplotlib? That’s what we have accomplished here. Any future
customization will be done via the
ax
or
fig
objects.
We have the benefit of a quick plot from pandas but access to all the power from matplotlib now. An example should show what we can do now. Also, by using this naming convention, it is fairly straightforward to adapt others’ solutions to your unique needs.
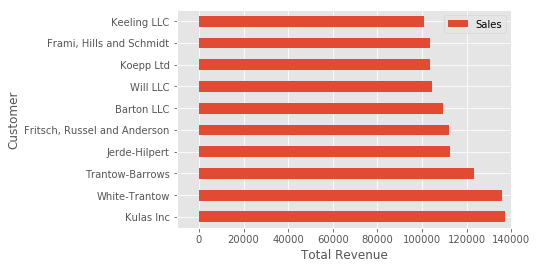
Suppose we want to tweak the x limits and change some axis labels? Now that we have the
axes in the
ax
variable, we have a lot of control:
fig, ax = plt.subplots()
top_10.plot(kind='barh', y="Sales", x="Name", ax=ax)
ax.set_xlim([-10000, 140000])
ax.set_xlabel('Total Revenue')
ax.set_ylabel('Customer');
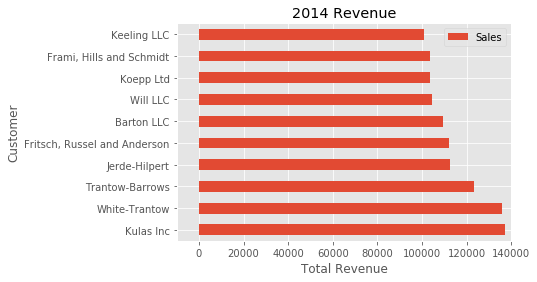
Here’s another shortcut we can use to change the title and both labels:
fig, ax = plt.subplots()
top_10.plot(kind='barh', y="Sales", x="Name", ax=ax)
ax.set_xlim([-10000, 140000])
ax.set(title='2014 Revenue', xlabel='Total Revenue', ylabel='Customer')
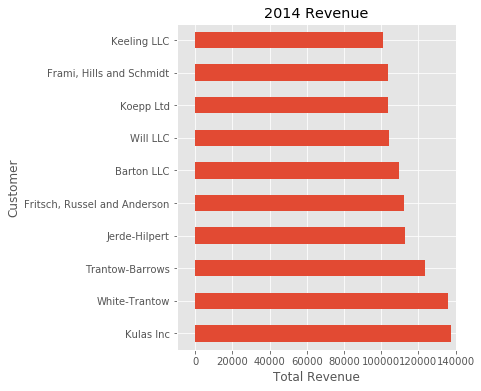
To further demonstrate this approach, we can also adjust the size of this image.
By using the
plt.subplots()
function, we can define the
figsize
in inches.
We can also remove the legend using
ax.legend().set_visible(False)
fig, ax = plt.subplots(figsize=(5, 6))
top_10.plot(kind='barh', y="Sales", x="Name", ax=ax)
ax.set_xlim([-10000, 140000])
ax.set(title='2014 Revenue', xlabel='Total Revenue')
ax.legend().set_visible(False)
There are plenty of things you probably want to do to clean up this plot. One
of the biggest eye sores is the formatting of the Total Revenue numbers. Matplotlib
can help us with this through the use of the
FuncFormatter
. This versatile
function can apply a user defined function to a value and return a nicely
formatted string to place on the axis.
Here is a currency formatting function to gracefully handle US dollars in the several hundred thousand dollar range:
def currency(x, pos):
    'The two args are the value and tick position'
    if x >= 1000000:
        return '${:1.1f}M'.format(x*1e-6)
    return '${:1.0f}K'.format(x*1e-3)
Now that we have a formatter function, we need to define it and apply it to the x axis. Here is the full code:
fig, ax = plt.subplots()
top_10.plot(kind='barh', y="Sales", x="Name", ax=ax)
ax.set_xlim([-10000, 140000])
ax.set(title='2014 Revenue', xlabel='Total Revenue', ylabel='Customer')
formatter = FuncFormatter(currency)
ax.xaxis.set_major_formatter(formatter)
ax.legend().set_visible(False)
That’s much nicer and shows a good example of the flexibility to define your own solution to the problem.
The final customization feature I will go through is the ability to add
annotations to the plot. In order to draw a vertical line, you can use
ax.axvline()
and to add custom text, you can use
ax.text()
.
For this example, we’ll draw a line showing an average and include labels showing three new customers. Here is the full code with comments to pull it all together.
# Create the figure and the axes
fig, ax = plt.subplots()

# Plot the data and get the averaged
top_10.plot(kind='barh', y="Sales", x="Name", ax=ax)
avg = top_10['Sales'].mean()

# Set limits and labels
ax.set_xlim([-10000, 140000])
ax.set(title='2014 Revenue', xlabel='Total Revenue', ylabel='Customer')

# Add a line for the average
ax.axvline(x=avg, color='b', label='Average', linestyle='--', linewidth=1)

# Annotate the new customers
for cust in [3, 5, 8]:
    ax.text(115000, cust, "New Customer")

# Format the currency
formatter = FuncFormatter(currency)
ax.xaxis.set_major_formatter(formatter)

# Hide the legend
ax.legend().set_visible(False)
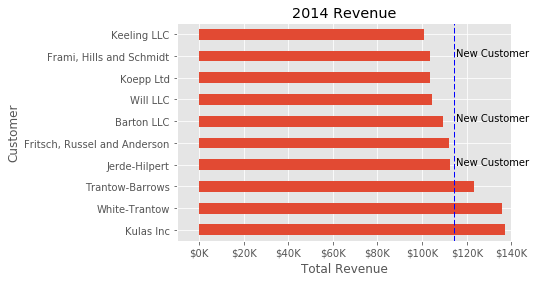
While this may not be the most exciting plot it does show how much power you have when following this approach.
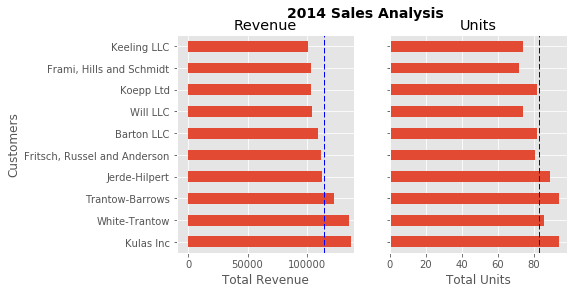
Figures and Plots
Up until now, all the changes we have made have been with the indivudual plot. Fortunately, we also have the ability to add multiple plots on a figure as well as save the entire figure using various options.
If we decided that we wanted to put two plots on the same figure, we should have
a basic understanding of how to do it. First, create the figure, then the axes, then
plot it all together. We can accomplish this using
plt.subplots()
:
fig, (ax0, ax1) = plt.subplots(nrows=1, ncols=2, sharey=True, figsize=(7, 4))
In this example, I’m using
nrows
and
ncols
to specify the size
because this is very clear to the new user. In sample code you will frequently
just see variables like 1,2. I think using the named parameters is a little easier
to interpret later on when you’re looking at your code.
I am also using
sharey=True
so that the yaxis will share the same labels.
This example is also kind of nifty because the various axes get unpacked to
ax0
and
ax1
. Now that we have these axes, you can plot them like the examples
above but put one plot on
ax0
and the other on
ax1
.
# Get the figure and the axes
fig, (ax0, ax1) = plt.subplots(nrows=1,ncols=2, sharey=True, figsize=(7, 4))
top_10.plot(kind='barh', y="Sales", x="Name", ax=ax0)
ax0.set_xlim([-10000, 140000])
ax0.set(title='Revenue', xlabel='Total Revenue', ylabel='Customers')

# Plot the average as a vertical line
avg = top_10['Sales'].mean()
ax0.axvline(x=avg, color='b', label='Average', linestyle='--', linewidth=1)

# Repeat for the unit plot
top_10.plot(kind='barh', y="Purchases", x="Name", ax=ax1)
avg = top_10['Purchases'].mean()
ax1.set(title='Units', xlabel='Total Units', ylabel='')
ax1.axvline(x=avg, color='b', label='Average', linestyle='--', linewidth=1)

# Title the figure
fig.suptitle('2014 Sales Analysis', fontsize=14, fontweight='bold');

# Hide the legends
ax1.legend().set_visible(False)
ax0.legend().set_visible(False)
Up until now, I have been relying on the jupyter notebook to display the figures
by virtue of the
%matplotlib inline
directive. However, there are going
to be plenty of times where you have the need to save a figure in a specific format
and integrate it with some other presentation.
Matplotlib supports many different formats for saving files. You can use
fig.canvas.get_supported_filetypes()
to see what your system supports:
fig.canvas.get_supported_filetypes()
{'eps': 'Encapsulated Postscript',
 'jpeg': 'Joint Photographic Experts Group',
 'jpg': 'Joint Photographic Experts Group',
 'pdf': 'Portable Document Format',
 'pgf': 'PGF code for LaTeX',
 'png': 'Portable Network Graphics',
 'ps': 'Postscript',
 'raw': 'Raw RGBA bitmap',
 'rgba': 'Raw RGBA bitmap',
 'svg': 'Scalable Vector Graphics',
 'svgz': 'Scalable Vector Graphics',
 'tif': 'Tagged Image File Format',
 'tiff': 'Tagged Image File Format'}
Since we have the
fig
object, we can save the figure using multiple options:
fig.savefig('sales.png', transparent=False, dpi=80, bbox_inches="tight")
This version saves the plot as a png with opaque background. I have also specified
the dpi and
bbox_inches="tight"
in order to minimize excess white space.
Conclusion
Hopefully this process has helped you understand how to more effectively use matplotlib in your daily data analysis. If you get in the habit of using this approach when doing your analysis, you should be able to quickly find out how to do whatever you need to do to customize your plot.
As a final bonus, I am including a quick guide to unify all the concepts. I hope this helps bring this post together and proves a handy reference for future use.

Democracy Now! 2017-04-21 Friday
Tom RocheGlenn Greenwald and Allan Nairn
Democracy Now! 2017-04-21 Friday
- Headlines for April 21, 2017
- As U.S. Preps Arrest Warrant for Assange, Glenn Greenwald Says Prosecuting WikiLeaks Threatens Press Freedom for All
- Shocking Exposé Reveals Trump Associates & ISIS-Linked Vigilantes Are Attempting Coup in Indonesia
Behind the News – April 20, 2017
Tom RocheThea Riofrancos on Ecuador politics before and after 2017 election; Harrison Fluss and Landon Frim on the US alt-right
Behind the News, 4/20/17
Tom Rocheactually Landon Frim, see (e.g.) https://landonfrim.wordpress.com/
Can the Aral Sea be saved?
Tom Rochenote bad download: see comment (hopefully) @ http://www.abc.net.au/radionational/programs/latenightlive/saving-the-aral-sea/8458540 (made but awaiting moderation)
Wikileaks vs the CIA
Tom RocheAssange refutes many of the charges regularly dished out (without much evidence) by the US corporate-funded media.
Everyone Already Knows About Climate Change
Tom Rocheexcellent material about climate-change rhetoric and scientific literacy
Into the woods: how one man survived alone in the wilderness for 27 years – podcast
Tom Rocheoriginal article/transcript by Michael Finkel @ https://www.theguardian.com/news/2017/mar/15/stranger-in-the-woods-christopher-knight-hermit-maine
The Now Show 14/04/17
Tom Roche~1640 U 16 Apr 2017 reported to BBC via http://www.bbc.co.uk/faqs/report_fault (note limit=500 char on report details):
> Since F 14 Apr 2017 I attempted to download this program via either the URL provided by the feed
> http://open.live.bbc.co.uk/mediaselector/5/redir/version/2.0/mediaset/audio-nondrm-download/proto/http/vpid/p05041y3.mp3
> or the other URL available from the program page[=http://www.bbc.co.uk/programmes/p02pc9pj/episodes/downloads]
> http://open.live.bbc.co.uk/mediaselector/5/redir/version/2.0/mediaset/audio-nondrm-download-low/proto/http/vpid/p05041y3.mp3
> but both 403 for me in the US. I suspect this is due to incorrect access permissions on your end.
Behind the News – April 13, 2017
Tom RocheMax Sawicky on Republicans vs US tax code; Vijay Prashad on Syria
Pueblo Macaw-keeping in Chaco Canyon. Host
Tom Rochefollow link to http://www.nature.com/news/prehistoric-native-americans-farmed-macaws-in-feather-factories-1.21803