Shared posts

05 Jun 16:39

5 Sales & Marketing Thought Leaders Weigh In on Inbound Marketing

by dan.mcdade@pointclear.com (Dan McDade)

In January I wrote the blog: How to Diagnose if Inbounditis is Killing Your Sales Pipeline, which was published by DemandGen Report. In the article I assert:

"A healthy, driven inbound marketing department is great, but over-reliance on inbound marketing (what I call 'inbounditis') negatively affects the revenue backbone of any company. In fact, it makes the whole sales pipeline sick.

"The three major symptoms of inbounditis are:

15 May 17:11

Motivate and Retain Your Sales Reps

by Trish Bertuzzi

 
Late last year, Steve Richard and I had an idea for new research. This would be the third collaboration between The Bridge Group and VorsightBP (after Sales Speaks and Mythbusting Millennials).

Our intent was to survey sales reps, front-line managers, and directors to understand the current state of sales management. By asking similar questions and capturing the variations between their perspectives, we knew there was a story to be told.

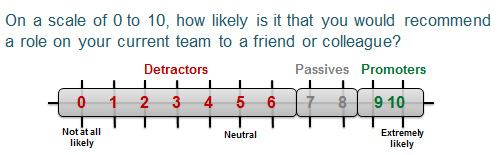
As a measuring stick, we decided to include a Net Promoter Score question in the individual sales rep variant.

What we found shocked us.

Finding #1: Our sales reps are not happy.

In terms of favorability, the NPS for our profession is somewhere between the Airlines and the Credit Card companies. (Details within the ebook.)

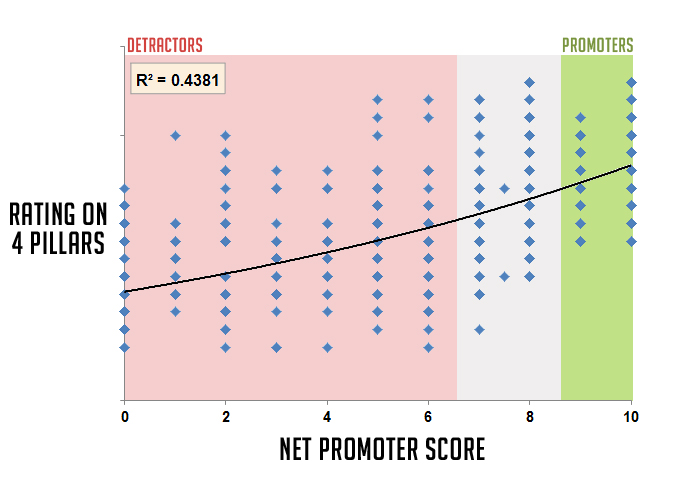
Finding #2: We identified 4 areas that separate Promoter from Detractor reps.

We’ve come to think of these as the Four Pillars -- career path, coaching, compensation & professional development. These are the questions your reps are asking themselves. You, as a manager, need to be ready to respond.

Finding #3:  Reps whose managers (and companies) are addressing 'the four pillars' are 5-6 times more likely to be Promoters.

Here's a sample of 622 reps. Notice the trend: better at the four pillars, a higher percentage of promoters.

If I could net it out for you...

This project revealed a disturbing question: Are we a generation of Managers or Leaders? The distance between these two accounts for much of the gap between Promoters and Detractors.

Now is the time to address this and I hope you'll take a look at the ebook and add your comments. Let’s help each other move our industry and profession up and to the right!

Motivating Sales Reps

authorTB

About Trish Bertuzzi

Trish writes about emerging inside sales trends. She is author of
Hiring an Inside Sales Manager and Inside Sales Oboarding.

Connect on Twitter and Google+.


18 Apr 16:59

10 Things Everyone Should Know About Selling

by Geoffrey James

Almost every position in every company requires some kind of selling. Here are the essentials you need to know to do it well.

There are thousands of "how to sell" books and training courses available everywhere around the world. However, everything you need to know about selling really boils down to the following simple rules:

1. Specialize in selling one thing.

The notion that a great salesperson can sell anything to anybody is as stupid as the idea that a virtuoso musician can play any instrument. The more you specialize in terms of product, service, and industry, the more likely you are to sell successfully.

2. Winnow down your sales leads.

When you're selling, the last thing you want or need is a huge list of sales leads. You only want to spend time on prospects who will probably buy. Therefore, the tighter your target list, the more likely you'll find someone who's actually interested.

3. Do your research first.

Never, never, never contact a prospect before you've checked out the person's LinkedIn profile, researched his or her company and industry, and found at least one good reason why the prospect should to talk with you, today.

4. Get into a conversation.

Your initial goal is not to sell but to get into a conversation to find out if it the prospect is a potential customer. Therefore, a sales pitch--whether spoken, written, videoed, or whatever--is not just a waste of time; it's actually preventing a sale from ever happening.

5. Be a person, not a salesperson.

There's absolutely nothing wrong with selling for a living or having to sell in order to make yourself or your firm successful. However, most people dislike any behavior that smacks of the showroom. Be yourself, not a clone of Ron Popeil.

6. Qualify the prospect quickly.

When you do get into that conversation, your goal is to find out whether that prospect has a need for what you're offering and the money to buy it. If not, eliminate that prospect from your list. Don't waste your time or the prospect's.

7. Focus on the customer's customer.

When you're assessing needs, what's most important is always what your prospect's customers need from your prospect to be successful. Your job is to help the prospect meet those needs. Your own needs, of course, are utterly irrelevant.

8. Adapt to the buying process.

Selling is not something that you do to a customer. It's something that you do for a customer. This means understanding how the customer buys the sort of thing you're selling and providing assistance as needed to make the purchase happen.

9. To sell you must close.

When you've got what you hope is a bona fide potential customer, it's hard to risk hearing a no that smashes your dream of a big sale. Nevertheless, if you don't ask for the business, or wait too long to ask for it, you're going to lose the sale anyway.

10. Build long-term relationships.

The only way to make selling easier is to build up your Rolodex, not just of contacts but of people whom you've personally helped become more successful. Eventually, you won't need to sell any longer because your friends will do your selling for you.

Readers: Is there something in this list that's missing. Leave a comment!

Like this post? If so, sign up for the free Sales Source newsletter.


18 Apr 16:59

Common Pitfalls in Demand Generation Strategy

by Jennifer Harmel

The word “strategy” is so over-used these days. No doubt about it we all want to have ground-breaking strategies, be thought of as strategic thinkers, and win awards for our companies or agencies with our strategy of the year. But nine times out of ten when I ask someone about their strategy, what they share with me is just a list of tactics. Not at all what I’d call a strategy.

So how and why are we all missing the boat? It turns out there are some common pitfalls among marketers.

Pitfall image

1. Diving straight to tactics
A couple emails, a webinar and three white papers do not make a marketing strategy. Take a step back and think long and hard about your goals. Are you trying to find net new prospects? Are you trying to retain existing customers? Is your company trying to gain market share or drive incremental revenue? Odds are your goals are a combination of all of those things. And you can understand why a list of white papers, tradeshows and webinars as a strategic plan will not alone achieve those goals. Instead, start with the goals and think about how you’ll achieve them.

Do you have the contact data you need? Do you have the technical tools you’ll need? Do you have the right people (both internally and externally) to help you execute your strategy? No strategy, no matter how good, will succeed without these foundational elements in place. And most importantly, your strategy needs to define how you’ll Engage with new prospects, Nurture them to become qualified, and Convert them to sales opportunities. A strategy isn’t about how many content offers you can create. It’s about improving your business results.

2. Lack of buyer-driven content
Content is obviously a key part of any marketing strategy. And most marketers have a great deal of content. The problem is that it’s all internally focused. We love to write about ourselves, our products, our solutions. The truth is that buyers don’t care what you have to say about yourself.

A successful marketing strategy includes content that is driven by the buyer’s needs. It speaks to their current pain points and, just as importantly, it’s posted in ways and locations where they are looking, researching and shopping. Without taking that into consideration, your content will not connect with your buyer.

3. Delivering unqualified leads to sales
This is a classic pitfall. Sales screams at marketing for more leads.  Marketing scrambles to deliver more leads, any leads. Sales responds with a resounding “these leads are horrible.” Sound familiar? The issue is all about quantity versus quality. It’s not enough to deliver 1,000 leads a week to sales if 90% of them are no good. Wouldn’t it make more sense to deliver 20 leads to sales that are pre-qualified, allowing for 60% of them to convert to an opportunity?

Today’s marketing automation platforms allow marketers to deliver pre-qualified leads to sales fairly easily, and the details of this are essential to any demand generation strategy. Just because someone attended a webinar does not mean they are ready to talk to a sales person. Take the time to build a process whereby contacts are engaged with buyer-driven content and nurtured until they are ready to speak with a sales rep. That is strategic.

4. No collaboration with sales
No demand generation strategy will succeed without collaboration between marketing and sales. Your colleagues in the sales organization are an excellent resource for generating the buyer-driven content mentioned earlier. After all, they are the “feet on the street” presumably listening to their customers wants and needs. Allow sales to provide input as you craft your audience personas.

Sales is also a must-have for any lead qualification and scoring conversation. After all, how can marketing deliver pre-qualified leads to sales if we don’t know how sales defines “qualified”? Find out who they want to talk to and who they don’t want to talk to and use that to build your lead qualification strategy. (There I go using that word again.)

5. Lack of refinement
As much as we’d all love to think that we can launch a new demand generation program and have it run perfectly, the reality is, this will never be the case. We work for months and months to produce the content, build the process, and align with sales. Yet the work is never done. There is always room for improvement. So before you launch a program, be clear on how you’ll define success and track results accordingly. You may find out that the analysis and tweaking for incremental gains is the most fun of all.

A long list of tactics, no matter how great, does not constitute a Demand Generation Strategy. Marketers need to think about more than how they will deliver their message and when.  It takes much more than that to drive real revenue.

Author: Jennifer Harmel @JenniferHarmel2, VP Strategy, ANNUITAS

18 Apr 16:59

How Conversion Paths Inform Your Inbound Campaign Strategy

by Meghan Sullivan

How Conversion Paths Inform Your Inbound Campaign Strategy image examining conversion paths

As inbound marketers, we love our data. Today’s digital marketing channels let us track and measure more than any channel that came before it, and we’re actually in a position to pick and choose what we track based on how much it can inform our decisions.

We’re able to monitor—down to the minute—website traffic, leads at each stage of the sales funnel, email open rates, email click rates, landing page views, form conversions, blog views and a lot more. Looking at these numbers regularly will provide insight into performance and indicate where there is room for improvement.

As important as it is to analyze performance data from individual campaign components, it’s equally important to evaluate in context, or how the metrics from each component relate to one another. We do this by evaluating a conversion path, which offers new actionable insight used to improve campaign performance.

A conversion path could look like:
Google Ad > Landing Page > Confirmation Email
Website CTA > Landing Page > Confirmation Email
Email > Landing Page > Confirmation Email

HubSpot offers an even more detailed conversion path definition that contains five components:
CTA > Landing Page > Form > Thank You Page > Confirmation Email

For example, we may look at email performance numbers in terms of sent, delivered, bounces, opens and clicks, but we also need to look at the conversion rate on the associated landing page to determine whether those two components—the email and the landing page—are working together to drive conversions.

What is the weakest link in your conversion path?

Taking a holistic look at conversion path metrics identifies weak spots. Let’s take a look at a few examples.

CTA > Landing Page

If your click rate on a website CTA is good, but your landing page conversion rate is not, there is an issue with the landing page. Visitors are clicking on the CTA and bouncing off of the landing page without converting. Here are some possible causes to investigate:

  • The H1 on your landing page isn’t compelling
  • There’s a perceived disconnect between the CTA copy and the landing page copy, in terms of what the visitor thinks they’re going to get after clicking on the CTA
  • Your form is too long or asks questions that aren’t appropriate for the level of the sales funnel

On the flip-side, if your landing page conversion rate is high, but the CTA click-throughs are low, you know your landing page is strong because those who are indeed landing there are converting. It’s a matter of improving your CTA to get more people to that landing page. Some elements to look at include:

  • CTA copy
  • CTA design
  • Button copy or color
  • CTA placement

Email > Landing Page

A similar logic applies to studying the conversion path starting with an email. Rather than ending your analysis with the email click-through rate, put that in context with the landing page your recipients come to if they click on the email’s call to action.

If the email open rate is low, take a look at the email’s subject line. I also recommend reviewing your list. If it’s not segmented well or isn’t up-to-date, you might be trying to reach people who aren’t interested in your brand.

If the click-through rate is low, the content of the email is not resonating with the reader. Some possible causes include:

  • An offer that is unappealing or unexciting
  • The message and offer are not adequately tailored to the target audience
  • The call to action is weak and doesn’t motivate the reader to click

If your landing page conversion rate is low relative to the email click-through rate, then there is a problem with the landing page. The email got the reader’s attention but the landing page couldn’t keep it. Make sure the landing page clearly communicates added value over what is explained in the email.

It’s not enough to look at campaign performance metrics as standalone numbers. It’s critical to look at performance holistically to understand how one step in a campaign impacts the next. Doing so sheds more light on how to optimize for conversions and achieve greater inbound marketing success.

photo credit: Stuck in Customs

How Conversion Paths Inform Your Inbound Campaign Strategy image dae58dfa dffb 4887 8b66 c2299ec55a3b

18 Apr 16:59

The Six Steps to Effective Sales Talent Hiring

by Gretchen Gordon

The Six Steps to Effective Sales Talent Hiring image Effective Sales Talent Hiring

One of the services we provide our clients is training to improve their sales talent hiring effectiveness.  The facts are stark.  Without a good process most companies have excessively high turnover rates, and the cost of that turnover is great.  National statistics indicate that it costs the employer between 3x and 5x the salesperson’s total annual compensation for each bad hire.  Fortunately there is a repeatable process that if the hiring managers will follow, will produce predictably great results. Here are the steps.

Determine whether you want to be proactive or passive in your approach.

What I mean is this.  Passive is the act of posting ads on job boards or elsewhere and then hoping candidates that are looking for jobs will find yours.  Proactive is the act of reaching out through social media channels like LinkedIn or others and finding people who fit your profile but may not be actually looking for a job.  This approach takes a lot of time and effort but will produce better results.  If you choose this approach, it is recommended that you seek aid from an expert who spends their whole day finding candidates.  You will likely not have the resources to do it on your own.  Most of my clients who follow a passive approach, other than in select, highly sought-after geographies, are disappointed by the results and have far fewer quality candidates to select from.

Create a well-written ad/description of the opportunity.

Regardless of whether you are passive or proactive in your recruiting approach you need a quality description of the position including what experience the perfect candidate would have to prepare them for the position (experience selling to CEOs in a competitive environment for instance); what activities they should love to do (must be comfortable generating your own leads); what is unique about your position and company (why would someone want to work for you?).  The ad is part disqualifier and part marketing document.   If you follow my complete advice then feel free to make the document as marketing oriented as you want, but be prepared to weed out a lot of candidates with the assessment process I recommend.

The hiring manager should be actively engaged in the process. 

Our clients who have the most success in attracting good quality candidates have engaged and active sales managers in the process.  The best sales managers are always recruiting and thinking about building a bench.  It is not just HR’s job to find the candidates.  If the compensation plan is structured appropriately then sales managers will be incented to field a full team and will be penalized if they are missing people from the team, and therefore sales don’t grow at the requisite rate.  Sales managers should constantly be using their contacts to reach out and find candidates.   Similar to the University of Kentucky basketball team philosophy, one has to assume that their best players will move on and will need replaced.

Use a sales-specific assessment to weed out the wrong candidates. 

First, I am partial to the best sales assessment on the market (voted 3 years in a row) Objective Management Group, but I am mostly partial to it because it is predictive and accurate.  It is not a personality test, rather it actually predicts with a high degree of validity (95% predictive validity) who will succeed in your position and who won’t.  Second, you have to use these assessments BEFORE you spend time looking at resumes, conducting interviews and forming opinions about the candidate.  They are huge time and money savers if used correctly, which is at the beginning of the interviewing process, before anyone has spent any time evaluating them.  Do this and you will have so much insight into the needs and skills of the newly hired salespeople that their on-boarding and ramp-up time will be reduced.  They will rise to the top of the pack in no time and it will literally transform your sales team.

Follow a consistent repeatable interviewing process. 

As much as I am a huge fan of using the right assessment, it does not stop there.  You must create a repeatable interviewing process that has four components:

  1. Is the candidate who they appeared to be on their resume.   Determine this by asking behavioral questions specifically challenging items on their resume.
  2. Have a batch of good behavioral questions designed to be asked of everyone (For example: Tell me about a time when you weren’t reaching your quota, what did you do?)
  3. Use the questions provided on the assessment to poke at the weaknesses that the assessment uncovered to see how much of an impact they will have in your situation.
  4. Have a list of specific subjective observations to make such as handshake, eye contact, communication skills etc.

As long as you have implemented the use of the assessment, which is completely objective, it is just fine to include some subjectivity.  Just be certain your subjectivity doesn’t trump the other facts.

Implement a structured on-boarding program. 

Even the best salespeople need a structured on-boarding program to understand the nuances of your product or services.  They need stories of customers so they can understand why customers buy from your company.  They need a huge list of good probing, hard-hitting questions to ask prospects, not just the basics.  An example would look like this:  Make sure Day 1 thru 5 are completely scripted – what do they need to learn, who will they learn it from and then set expectations about what they should get out of those interactions.  It is THEIR job to actually get what they need.  In Weeks 2 – 4 set specific weekly expectations.  If they are going on calls or joint calls, what are the expectations?  Then look at month 2 and 3 the same way.  Always be focused on helping them plan out the appropriate level of activity to achieve the expected goal for each time period.  Your plan should be specific to your situation with regard to product complexity etc, but keep in mind that the best salespeople want to get up and running as quickly as possible.  Do not lock them in training for weeks on end.

If you want to read a case study about how we helped transform a client’s sales hiring process read here:  Finding a Better Way to Hire.

If you want to see a sample candidate assessment as I discussed read here: Sample Candidate Assessment.

17 Apr 14:54

Ann Makosinski: Unleashing the Thermoelectric Power Inside of You

by Intel
Ann-hero
Feed-twFeed-fb

Power. It’s arguably the most precious commodity of the modern age, and the obsession of brilliant minds around the world. Scientists scramble to harness and hone earth’s natural resources, the brilliance of the sun and the awesome potential of the wind. Engineers run countless configurations to determine the most effective ways to charge our homes and vehicles. For so many of us, unlimited power is a given, something we’ve learned to take for granted

For more than a billion people across the planet, however, electricity is a limited, rare commodity. High schooler Ann Makosinski, 16, of Victoria, Canada learned of this reality and dedicated a science fair project to the situation. Her hand-heat-powered “Hollow Flashlight” was, in her mind, a practical solution to a pretty big problem. To the science community at large, it was a stroke of genius to recognize that power originates within every one of us—every day, all the time. Thermoelectricity took a step forward. Read more...

More about Brandspeak
17 Apr 14:51

Extreme Hotel Deals Gets You Great Rooms at Deep Discounts

by Alan Henry

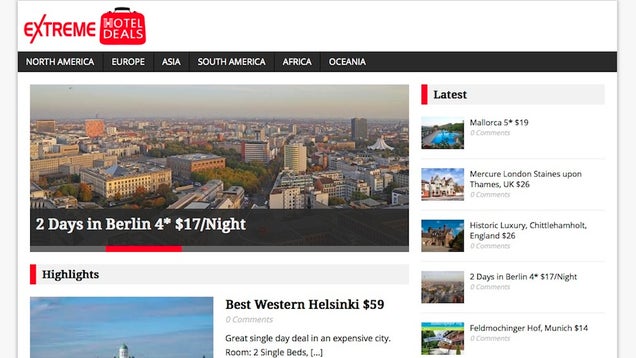
Extreme Hotel Deals Gets You Great Rooms at Deep Discounts

If you're flexible about your travel, you can score the biggest discounts on your trip. That's not new, but Extreme Hotel Deals offers great rooms—sometimes at posh resorts—for serious discounts. We're talking $10, $20, or $50 a night for incredible rooms—if you act fast and have a bit of luck, that is.

Read more...

17 Apr 14:51

The Importance of Saying Thank You, and Why You Should Say It Often

by Alan Henry

"Thank you" can be an incredibly powerful pair of words, especially if the person you're thanking really needs to hear them, or isn't expecting them. In this short TED talk, Dr. Laura Trice muses over the power of saying thank you, and reminds us why we should say it—and ask to hear it—more often.

Read more...

17 Apr 14:45

Sneak Peek of Insight Selling

insight selling

The sales landscape has shifted in the last few years.

Buyers are more informed than ever, competition is stiffer, and products and services are increasingly seen as replaceable, leaving most sellers at a loss for the best way to add value and differentiate.

Yet, some sellers continue to win consistently.

To find out what these sellers are doing differently than the rest, we undertook a massive research effort. In our study, we looked at 700 B2B purchases made by buyers who represent $3.1 billion in annual purchasing power.

We found that the sellers who win harness the power of ideas. And in our new book, Insight Selling: Surprising Research on What Sales Winners Do Differently by bestselling authors Mike Schultz and John Doerr, we share exactly how they do it...

17 Apr 14:44

New marketing automation rankings: Enterprise usability still sucks

by John Koetsier
New marketing automation rankings: Enterprise usability still sucks
Image Credit: Star Trek

Crowdsourcing software review company TrustRadius revealed its latest marketing automation ranking and buyers’ guide today, and here’s the consensus: Software for the enterprise still lacks the appeal of consumer versions.

“The usability sucks, and the user interface is pretty basic,” TrustRadius CEO Vinay Bhagat told me yesterday. “They haven’t had the same innovation that other products in the market have seen … but removing those incumbents is not a trivial thing.”

Solutions from vendors such as IBM, Silverpop (which IBM just acquired), and Teradata are still not at the level of younger, fresher competitors such as Marketo, Hubspot, and Act-On, in spite all the “consumerization of the enterprise” we’ve been hearing about.

In fact, several well-known solutions ranked below average in usability, according to TrustRadius survey respondents. Only Oracle’s Eloqua ranked very high both in usability and in being strongly focused on the enterprise market.

Screen Shot 2014-04-16 at 8.44.03 AM

Part of that, however, might not be the enterprise vendors’ fault. For some reason, enterprise users just seem to be more harsh on their software than employees at smaller companies.

“SMB users are less critical of their products, and the products they use tend to be higher rated, as they’re inexpensive and meet needs neatly,” Bhagat said. “Enterprise products, on the other hand, require configuration and setup.”

Bhagat added that not all the vendors are “super-happy” about where they ended up, but he said “the data doesn’t lie.”

For mid-sized companies, TrustRadius’ data says that Marketo and Pardot were the best products, with customer satisfaction ratings of 4.2 and 4.0 out of 5, respectively. And for smaller companies, Hubspot, Act-On, and Infusionsoft topped the list, with Hubspot getting top honors for an almost-perfect 4.8 customer satisfaction score.

Screen Shot 2014-04-16 at 9.08.47 AM

Two interesting aspects of the report highlight emerging trends: an increased segment focus, and a widening division in the market between point solutions and suites, or “marketing clouds.”

“We had a thesis that it was important to look at the market by segment –small, midsize, and enterprise – and when we ran the data, it really rang true,” Bhagat says. “We saw some really stark differences.”

Hubspot, for instance, started out as a small business solution and now has definite aspirations for the enterprise. Similarly, Act-On — which just announced a $42 million funding round —  is specifically aimed at mid-market companies but has been adopted in the enterprise as well. The data shows, Bhagat says, that while both companies have appreciable share in enterprise, usage tends to be more departmental and often in conjunction with other solutions.

For instance, the same company will often use both Hubspot and Marketo at the same time. That’s something we saw in our VB Marketing Automation Index report as well, with a full 58 percent of companies using more than one marketing automation system, and a full 30 percent using three or more.

best marketing automation software for midsized businesses

The other trend is the distinction between single solutions, like a Marketo, and integrated marketing clouds like those offered by Adobe, Salesforce, Oracle, and perhaps IBM, which pull together a number of components such as social, marketing campaigns, and analytics into one suite.

“I think it’s a classic debate between best-of-breed and enterprise suite,” Bhagat said, echoing what Act-On CEO Raghu Raghavan told me two days ago. “It’s very difficult to be world-class in every facet … you’ve got competition in every module.”

The market will likely divide between those who insist on best-of-breed for every component of their marketing stack, Bhagat said — and are willing to put up with some integration blood, sweat, and tears — and those who demand everything from one vendor, with one customer relationship, and a single point of interface.

It’s a difficult decision for enterprises, and there’s no one right answer for everyone.

“Oracle, for instance, makes an argument that they are more integrated that Salesforce,” Bhagat said. “But they don’t own a world-class social tool. And Omniture was best-in-breed when Adobe bought it but now faces very stiff competition from Google Analytics Premium.”

Marketo is pretty much the only fully enterprise-focused independent marketing automation platform remaining, with the possible exception of Hubspot. Hubspot, of course, is independent, but more mid-market-focused at the moment than locked in on the enterprise.

That would tend to make both companies appealing acquisition targets, I would assume.

TrustRadius competitor G2 Crowd released its marketing automation report just a few weeks ago, in which Hubspot, Eloqua, Act-On, Marketo, and Pardot received top ratings.


VB's working with marketing expert Scott Brinker to understand the new digital marketing organization. Help us out by answering a few questions, and we'll help you out with the data.


17 Apr 14:44

Weather Factors Heavily Into The Fed's Beige Book Again

by Matthew Boesler

beigeThe Federal Reserve has just released its April Beige Book, a collection of anecdotes on economic conditions from business contacts across each of the 12 Fed districts.

According to the Beige Book, economic growth increased in most U.S. regions and consumer spending rose as the harsh winter weather conditions receded.

The word "weather" is indeed mentioned 103 times.

Below is the full text of the release:

Summary of Commentary on Current Economic Conditions by Federal Reserve District

Prepared at the Federal Reserve Bank of Richmond and based on information collected before April 7, 2014. This document summarizes comments received from businesses and other contacts outside the Federal Reserve and is not a commentary on the views of Federal Reserve officials.
 

Reports from the twelve Federal Reserve Districts suggest economic activity increased in most regions of the country since the previous report. The expansion was characterized as modest or moderate by the Boston, Philadelphia, Richmond, Atlanta, Minneapolis, Kansas City, Dallas, and San Francisco Districts. Chicago reported that economic growth had picked up, and New York and Philadelphia indicated that business activity had rebounded from weather-related slowdowns earlier in the year. The Cleveland and St. Louis Districts both reported a decline in economic activity.

Consumer spending increased in most Districts, as weather conditions improved and foot traffic returned. Auto sales were up in the New York, Philadelphia, Richmond, Atlanta, Chicago, Minneapolis, and San Francisco Districts, but they were little changed from a year earlier in Kansas City and Cleveland. In addition, assessments of tourism were generally positive, particularly for the Districts of Philadelphia, Richmond, and Minneapolis, where ski resorts had record seasons. Summer bookings were also solid in several Districts. Activity was mixed at non-financial services firms, with the Boston, Philadelphia, Minneapolis, and Kansas City Districts reporting increased demand. In the Boston District, for example, advertising and consulting were strong. The Richmond District indicated that revenues at non-retail services firms were flat, and St. Louis said firms' planned activity declined on net.

The transportation sector generally strengthened in recent weeks, with higher port volumes and increased trucking. Even in districts where transportation was soft, the outlook was optimistic.

Manufacturing improved in most Districts. Several Districts reported that the impact of winter weather was less severe than earlier this year. Chicago and Minneapolis saw moderate growth, while manufacturing grew at a steady pace in New York, Atlanta, St. Louis, and Dallas. San Francisco noted that manufacturing appeared to gain some momentum. Other Districts noted mild growth, except Richmond, where manufacturing activity was mixed. Demand for food production declined in the Boston, Richmond, and Dallas Districts; however the drop was primarily weather related. Steel production picked up in several districts.

Reports on residential housing markets varied. However, across most Districts, home prices rose modestly and inventory levels remained low. Residential construction increased in several Districts; only Cleveland, St. Louis, and Minneapolis reported a decrease. Commercial construction also strengthened, with the exception of Cleveland, which reported a mild decline. Commercial leasing activity generally advanced at a modest pace. Industrial markets showed signs of tightening in downstate New York and northern New Jersey.

Loan demand strengthened since the previous Beige Book. Credit quality improved in the Philadelphia, Cleveland, Richmond, and Kansas City Districts. New York and Dallas reported especially strong increases. New York, Philadelphia, Cleveland, and Richmond cited the inclement weather as a factor reducing home sales and therefore mortgage borrowing. Commercial loan volumes grew in each of the Districts reporting on banking except St. Louis, where lending declined marginally.

Agricultural reports were mixed, as weather disruptions delayed crop plantings and shipments of commodities. A pig virus adversely affected hog farming in the Richmond, Chicago, Kansas City, and San Francisco Districts. Prices of beef and pork rose. In the energy industry, oil and natural gas production increased, while coal output continued to decline.

Labor market conditions were mixed but generally positive. The New York, Cleveland, Richmond, Chicago, Kansas City, and Dallas Districts reported difficulty finding skilled workers.

In most Districts, wage pressures were contained or minimal. The New York District reported scattered wage pressures and Cleveland reported that wage pressures were contained. However, there were several reports of upward wage pressures in the Dallas District.

Prices were generally stable or slightly higher. The New York District described price pressures as subdued in manufacturing and steady in the service sector. In Philadelphia, manufacturing prices paid and received edged up; in Richmond, prices of raw materials and finished goods rose more slowly since the previous Beige Book. Some districts reported higher prices for construction inputs and livestock. In Cleveland, concrete, drywall, and hardwood prices rose, while in the Kansas City District, drywall and roofing prices increased and were expected to rise further.

Consumer Spending and Tourism
Consumer spending increased since the previous report in a majority of Districts. Retailers reported improvement from generally weak sales at the beginning of the year that were most likely the result of winter storms. Retail sales in New York rebounded strongly from weather-depressed levels, while cold weather continued to hold down consumer spending in Cleveland. St. Louis contacts reported a number of store openings and plans for future openings. Some categories of spending benefited from the long winter, such as cold weather apparel, appliances, and snow removal equipment. Finally, Boston noted increasing online sales, and some San Francisco firms have adjusted product offerings accordingly. Retail inventories were mixed in Boston and at or near desired levels in New York. Cleveland inventories were described as being in good shape. Inventories expanded in the Chicago District, and increased moderately in Kansas City.

Sales of cars and light trucks picked up in recent weeks as the weather improved and consumer traffic returned to dealerships. Auto sales were strong in the New York, Philadelphia, Richmond, and San Francisco Districts; sales growth was moderate in Chicago. Automobile sales strengthened slightly in the Dallas District and grew modestly in Atlanta, but were flat in Kansas City. In the Cleveland District, dealers reported that winter weather continued to push down transactions.

Tourism was generally positive in the Philadelphia, Richmond, Atlanta, Minneapolis, and Kansas City Districts. Tourism in the San Francisco District was higher than in the previous report but below year-ago levels. In New York, reports were mixed. Attendance at Broadway theaters picked up, in part because more shows were running. However, some contacts suggested that cold weather had decreased travel. In the Philadelphia, Richmond, and Minneapolis Districts, ski resorts reported an outstanding season. Atlanta reported positive tourist activity and Kansas City noted that activity picked up. Some districts were already experiencing heavy summer bookings.

Nonfinancial Services
Reports on non-financial services were mixed. In the Boston District, advertising and consulting were strong, especially for healthcare consulting; firms had a positive outlook for the remainder of the year. Philadelphia's businesses were also optimistic; growth there was moderate. Activity increased in the Minneapolis District and Kansas City reported improved sales in professional, technical, and healthcare services. The Richmond District reported generally flat revenues at non-retail services firms. Chicago's nonfinancial services firms increased business spending. St. Louis reported that firms' planned activity declined on net. Reports in the Dallas and San Francisco Districts were mixed, with San Francisco noting healthy demand in the technology industry.

Transportation generally strengthened in recent weeks. In the Richmond District, container volume through ports continued to grow briskly despite winter weather disruptions. Trucking increased as firms worked to catch up with weather-delayed shipments. Atlanta ports cited increased shipments of bulk agricultural commodities and record container volumes. In addition, intermodal traffic rose modestly. Transportation firms in the Kansas City District saw slower growth in March but expected moderate growth over the next six months. Dallas transportation services firms reported mixed demand, as container and intermodal cargo decreased. Airline demand there was soft, but above year-ago levels. In the Minneapolis District, freight rail backlogs delayed agricultural shipments. Costs of freight rose while volumes declined in the Cleveland District, and operators were unable to pass through increases in diesel prices.

Manufacturing
Conditions in the manufacturing sector improved since the previous Beige Book. The Chicago and Minneapolis Districts reported moderate growth, with a pickup in new orders and production. The San Francisco District stated that manufacturing activity appeared to gain some momentum. Manufacturing in the Boston, New York, Atlanta, St. Louis, and Dallas Districts grew at a steady pace, while Philadelphia, Cleveland, and Kansas City reported mild growth. Richmond reported mixed conditions in manufacturing. The Boston, New York, Philadelphia, Cleveland, Richmond, Atlanta, Chicago, Kansas City, and Dallas Districts noted that lingering winter weather hampered business activity, but the impact was less severe than earlier this year.

The auto, aerospace, and energy-related industries remained a source of strength for the Chicago District. Energy-related manufacturing was also particularly strong in Dallas. The sustained backlog of orders for commercial aircraft supported growth in the commercial aerospace industry in the San Francisco District. The Chicago District indicated that steel production recovered from a weather-related slowdown and capacity utilization returned to its expected levels. Additionally, specialty metals manufacturers reported an increase in new orders and order backlogs. In contrast, food manufacturers in Boston, Richmond, and Dallas reported a decline in demand that was largely weather related, but indicated that production was unchanged overall. Steel shipments grew slightly in Cleveland, with contacts anticipating slow growth in the months ahead. The demand for steel production inputs improved from both domestic and foreign sources in the San Francisco District. Firms expected continued moderate growth in manufacturing, with some increased optimism.

Real Estate and Construction
Reports on residential housing markets varied. Home sales in Kansas City strengthened since the last survey period due in part to seasonal factors and improved weather conditions. Moreover, in the Dallas District single-family home sales remained healthy, with some contacts reporting a seasonal pickup in demand over the past six weeks. Residential real estate improved in Richmond, with further strengthening in Northern Virginia. New York housing markets continued to be mixed, while severe winter weather hampered sales activity. Chicago reported that home sales and new listings declined, though brokers attributed this primarily to cold weather and were optimistic that activity would improve in coming months. Atlanta brokers reported homes sales were mixed and contacts attributed areas of softness to higher home prices, limited inventory, and higher mortgage rates. The pace of home sales varied across the San Francisco District. Some contacts in California noted an uptick, while contacts from Washington observed a more sluggish pace. Home sales declined across most of the largest metro areas of the St. Louis District, and Minneapolis residential real estate market activity decreased since the previous report. In most Districts, inventory levels remained limited and residential home prices rose modestly.

Residential construction grew at a moderate pace in the Boston and San Francisco Districts, while New York, Philadelphia, and Atlanta reported modest growth. In the Chicago District, a decline in single-family construction was accompanied by growing demand for new apartment projects as residential rents continued to increase. Richmond single-family home construction grew slowly. In the Kansas City District, builders reported moderate growth in the number of housing starts and expected an increase in buyer traffic and prices in the coming months. In contrast, residential construction declined in Cleveland, St. Louis, and Minneapolis. Multifamily construction remained strong in the New York, Richmond, Atlanta, Chicago, Dallas, and San Francisco Districts. The Minneapolis District reported that overall residential construction activity decreased and that the value of residential permits fell in March.

Commercial construction activity strengthened since the previous survey period for the Kansas City and Dallas Districts. The Richmond, Atlanta, Chicago, St. Louis, Minneapolis, and San Francisco Districts reported modest to moderate expansion in commercial construction. Philadelphia noted mild growth, while Cleveland reported a slight decline in commercial construction. Commercial leasing activity generally grew at a mild to moderate pace. Office and industrial activity remained robust in the Dallas District, with one contact noting particularly strong demand for office space in the Dallas metropolitan area. Leasing activity improved for retail and industrial space in the Richmond District. Commercial real estate contacts continued to report a decline in vacancy rates, a slight increase in absorption, and higher sales in Kansas City. The Boston, New York, and Chicago Districts reported modest commercial leasing in recent weeks. Industrial markets were generally steady across upstate New York but showed signs of tightening in downstate New York and northern New Jersey.

Banking and Financial Services
On the whole, loan demand strengthened since the previous Beige Book. Of the Districts that reported on banking, Philadelphia, Richmond, Atlanta, and Kansas City noted slight increases in loan volume, while Cleveland and Chicago indicated modest growth. The New York and San Francisco Districts had moderate gains. The Dallas District noted that consumer loans continued to grow moderately. St. Louis was the only district to report a decrease in loan volumes. With respect to credit quality, slight improvements were noted in Philadelphia and Cleveland, and modest advancements were made in Richmond and Kansas City. The New York and Dallas Districts reported especially strong increases. San Francisco indicated no net change in credit quality but noted that credit standards had tightened and that small business lending was primarily reserved for better-quality borrowers. Credit standards were reported to be loosening in the Atlanta District. New York, Cleveland, Richmond, and Kansas City indicated that standards were unchanged.

The majority of Districts described mixed or declining residential mortgage borrowing; only Dallas and San Francisco reported slight growth. New York, Philadelphia, Cleveland, and Richmond cited the inclement weather as a factor reducing home sales and therefore mortgage borrowing. However, the Philadelphia District also added that bankers reported growing consumer confidence.

Commercial loan volumes grew in each of the Districts reporting on banking except St. Louis, where lending declined marginally. Overall commercial mortgage lending grew in the New York, Philadelphia, Atlanta, Minneapolis, Kansas City, and San Francisco Districts. Cleveland and Chicago saw increased lending for equipment purchases. Kansas City reported greater demand for agriculture loans. Deposits were up in the Cleveland, Kansas City, and Dallas Districts but little changed in New York. Delinquency rates declined in New York and Cleveland.

Agriculture and Natural Resources
Agricultural conditions varied across Districts in recent weeks. In the Chicago District, conditions improved. Kansas City and Dallas reported mild growth in the sector, while San Francisco reported stable demand for agricultural products. However, agricultural conditions weakened in the Richmond, Atlanta, St. Louis, and Minneapolis Districts. Adverse weather affected several districts. Winter wheat suffered as a result of dry conditions in the Kansas City District, and drought conditions continued to worsen in Dallas. In contrast, wet field conditions delayed planting in the Richmond and Atlanta Districts. Additionally, Chicago noted that the slow arrival of spring-like weather delayed fieldwork, although in some areas crops perform well after late planting. Minneapolis and San Francisco reported that winter weather disrupted transportation of some crops. In most Districts, crop prices increased in recent weeks but were below year-ago levels. Higher soybean prices shifted planting intentions away from corn. Dairy demand boomed in Dallas, especially for export, and prices for dairy products moved to record highs. Hog operations in a few Districts were battling a virus, and pork prices continued to rise. Beef prices reached record highs.

Activity in the energy industry increased modestly since the last report, with moderate growth reported by the Richmond, Kansas City, and Dallas Districts. San Francisco reported a mild increase. In Kansas City, the number of active oil and natural gas drilling rigs edged up, and expectations for the coming months were positive. San Francisco reported that crude oil production increased robustly. Demand for oilfield services was very healthy in the Dallas District, particularly in West Texas. Crude oil prices generally increased. Natural gas production was stable at a high level. Minneapolis reported strong growth in natural gas and increased exploration in North Dakota. Prices of natural gas and natural gas liquids stabilized. Coal production declined at a slower rate in Cleveland and St. Louis due in part to higher demand from domestic electric utilities. The Richmond District reported steady coal production as inventories were replenished from this winter's drawdown. Cleveland and St. Louis indicated a mild decline in coal production. The Minneapolis District reported that mining was stable, with production at ore mines roughly level with a year earlier.

Employment, Wages, and Prices
Recent reports on labor market conditions were mixed but generally positive. For example, the New York, Chicago, and Minneapolis Districts saw modest to moderate growth in employment. Dallas noted that transportation and manufacturing firms added jobs. Boston, however, indicated that few firms outside of advertising and consulting were hiring. Both Philadelphia and Atlanta said that firms planned to make capital expenditures to boost efficiency before they would hire. Employers in the New York, Cleveland, Richmond, Chicago, Kansas City, and Dallas Districts reported difficulty finding skilled workers. More specifically: New York, Richmond, and Chicago mentioned the IT field, Atlanta noted a need for truckers, Kansas City cited labor shortages for skilled positions, and Dallas reported that a food manufacturer found skilled labor in short supply.

In most Districts, wage pressures were generally portrayed as contained or minimal. For example, New York reported only scattered wage pressures and Philadelphia added that very few contacts are seeing wage pressures. In Cleveland, wage pressures were contained, Minneapolis reported that wage increases were moderate. However, Dallas cited several reports of upward wage pressures, and San Francisco added that wage gains remained quite modest overall but noted increases for certain occupations and in certain areas.

Prices were mostly steady, with scattered reports of increases. The New York District described price pressures as subdued in manufacturing and steady in the service sector. In Philadelphia manufacturing prices paid and received edged up, and in Richmond, prices of raw materials and finished goods rose more slowly since the previous Beige Book. Retail prices were steady in Boston while food prices moved up modestly in the Atlanta, Chicago, Kansas City, Dallas and San Francisco Districts. Boston reported that costs and prices increased between zero and four percent. Cleveland, Atlanta, Chicago, Kansas City, Dallas, and San Francisco Districts all said that prices of metals, brick, and cement rose modestly. Chicago noted that prices for corn, soybeans, dairy, hogs, and cattle increased. Kansas City also saw higher livestock prices. Prices of various categories of construction materials rose in some districts; in Cleveland, concrete, drywall, and hardwood prices all trended higher. The Kansas City District indicated that drywall and roofing prices rose and were expected to rise further. In San Francisco, wood and insulation prices edged up. Changes in natural gas prices varied: Minnesota reported increases while Dallas reported decreases as the winter weather subsided. The Cleveland District reported that spot prices for steam coal rose slightly, while the metallurgical coal price growth was flat.

Return to topReturn to top

First District--Boston

The First District economy continues to expand moderately, according to business contacts, although growth rates vary across sectors and firms. Most--but not all--retailers and manufacturers are seeing sales and revenue increases from a year ago; several continue to cite adverse effects of the recent winter weather. Advertising and consulting firms report strong growth, with the exception of a government contractor. Real estate markets continue to strengthen, although lack of inventory is constraining home sales in Massachusetts and commercial contacts cite concerns about "highly optimistic" assumptions underlying purchase prices and lending decisions. Very few firms outside of advertising and consulting are adding to head counts. Price changes remain minimal. The outlook is somewhat mixed, but mostly positive.

Retail
First District retailers contacted for this round were just completing Q1 or Q4 reports, depending on their fiscal year calendar. Year-over-year comparable-store sales ranged from being down 4 percent to being up slightly more than 10 percent. All of the respondents say that their retail sales were affected, to some degree, by the severe winter weather. One retailer benefited from much higher demand for winter-related items, while the others saw sales suffer because snowstorms kept consumers from shopping. Apparel, furniture, and appliances sold well, as did paint for interior home improvement projects. Inventories are mixed, in part because bad weather cut some stores' sales. For retailers with both brick-and-mortar stores and online sales channels, Internet sales continue to account for an increasing share of total sales.

Contacts continue to report that prices are steady overall, but some expect to see very modest price increases later in the year; one, for example, cites higher prices for a range of apparel inputs as well as higher foreign labor costs. The consensus is that consumer sentiment is continuing to improve.

Manufacturing and Related Services
Of the nine manufacturing firms contacted in this round, seven report higher sales than the same period a year earlier. The two citing declines were a frozen fish company and a manufacturer of pressure sensitive films. Two others, a manufacturer of industrial motors and brakes and a manufacturer of scientific equipment, report very slight sales increases compared with a year ago. Contacts at four firms say the weather adversely affected their sales in the first quarter but they find it difficult to estimate how much of the reduction is likely to be recovered in coming months. A manufacturer of parts for the auto industry said that slow sales in the auto industry have not yet affected build schedules, so inventories of finished cars are piling up. If auto sales don't "bounce back" in the spring, the contact believes that summer shutdowns in the industry will be longer than usual. A firm that makes water treatment devices reports that demand in residential real estate is strong. Globally, respondents indicate that sales in Europe are growing more rapidly, but from a very low base, while sales in Asia are strong.

Contacts report that commodity and other input prices are generally stable. Two firms say they raised prices on January 1 and customers largely accepted the increases. Inventory levels are largely unchanged. Five contacts report no change in employment and two report small increases. A biotechnology company plans to hire 1,000 workers this year and completed about 20 percent of that in the first quarter. A manufacturer of frozen fish closed a plant in Canada and moved production to New England, with no change in overall firm employment. Two-thirds of contacts report higher capital expenditures planned for 2014 versus 2013. For two contacts, a manufacturer of parts for jet engines and a maker of industrial motors and brakes, the increases are large relative to their typical levels of investment and represent substantial increases capacity. None of our manufacturing contacts has a negative outlook, but four said that they expect sales to be flat or to grow very slowly in 2014.

Selected Business Services
Consulting and advertising contacts report a strong first quarter, consistent with an accelerating economy. Healthcare consulting contacts indicate that very strong demand is ongoing, as providers continue to adjust to the changes imposed by the Affordable Care Act (ACA). Economic consulting remains a strong growth industry, although the conclusion of litigation related to mortgage-back securities and the financial sector may restrain growth slightly in the near future. Strategy consultants report strong demand growth, driven by high levels of private equity activity and increased demand for corporate work, as clients have become more comfortable with the economic outlook and begin to release pent-up demand for consulting work. Advertising and marketing contacts also report strong growth, ranging from 5 percent to 20 percent year-over-year, and cite factors including growing confidence in the economic outlook and an increased willingness among large corporations to spend in order to position themselves within their markets. By contrast, a government contractor cites continued contraction, but has observed increasing interest in new projects since the passage of the recent budget deal.

Contacts report small increases in costs and prices, ranging from zero to 4 percent. Some consultants cite minimal pressure to keep prices low, while others say that competition has forced them to keep prices flat. Employment growth is in the zero to 5 percent range, although most firms at zero either increased their workforce in the recent past or expect to do so soon if their current growth continues. All contacts are optimistic about the coming year and expect economic growth either to continue or to accelerate. Contacts cite various ongoing risks, but generally were only minimally concerned.

Commercial Real Estate
Commercial real estate contacts in Boston report that brisk demand for and tight supply of office space in portions of the city, including the Seaport District and Back Bay, have pushed asking rents up in those locations in recent months. While these localized rent increases are contributing to increases in average office asking rents in greater Boston, contacts note that rents remain flat in portions of the Financial District and in a number of suburban locations, and that rising maintenance costs mean that net rents are growing more slowly than asking rents. Speculative office construction remains limited, although respondents say that the pipeline of planned office construction for greater Boston is growing. Contacts continue to express concerns that prices being paid by investors for commercial properties in Boston, along with lending terms for commercial mortgages, embody highly optimistic assumptions concerning future rent growth on the properties. Demand for Boston properties has been particularly strong among foreign investors and domestic pension funds. A few contacts, located in Boston as well as elsewhere in the region, also expressed concern that current construction levels of high-end apartments are excessive in relation to potential demand for such units. At the same time, these contacts indicate that recently delivered luxury apartment units appear to be fetching rents in line with developers' projections.

In Hartford, sluggish leasing activity is attributed to the long, harsh winter, although fundamentals and business sentiment are described as stable. Also in Hartford, a new apartment construction project recently broke ground downtown, and investment sales interest remains healthy. Leasing deals proceeded slowly in greater Providence in the first quarter, leading to decreased confidence by one contact there, who nonetheless cites some positive developments in the Rhode Island economy that should contribute to job creation in coming months. Rents in Providence are described as flat on average, with some modest upward pressure in the class A office sector and diminishing concessions in suburban locations. Leasing activity reportedly increased in Portland in recent weeks, up from the already healthy pace seen at the beginning of the year. In addition to strong leasing demand, which pertained especially to the class A office sector and the retail sector, Portland's investment sales and development and construction inquiries grew in number. Growing demand for new construction reflects current, very low vacancy rates for downtown retail and class A office space in Portland. A regional lender faces ongoing competitive pressure to lower credit spreads for commercial mortgages, and continues to see a healthy pipeline of loan demand for most property types, with the exception of class B office space.

Contacts in both Hartford and Providence expect more slow improvement in fundamentals. The outlook for Portland's commercial real estate market is bullish in light of its recent growth and planned business expansions, while contacts expect that mixed performance will persist across different locations in the Boston metropolitan area.

Residential Real Estate
Realtors in the First District express caution but optimism about the mixed sales results that continued in the region in February. Year-over-year sales of single family homes decreased in Rhode Island, Massachusetts, and Connecticut, and increased in Maine and Vermont. (Contacts in New Hampshire were unavailable for comment in this round.) In the condominium market, sales increased relative to last year in Connecticut, Massachusetts, and Vermont, while decreasing in Rhode Island; condo sales information is not reported in Maine. The consensus across the First District is that the decline in sales will be short lived; respondents say it was partially driven by the tough winter, as well as uncertainty about new federal flood insurance rules. Signs of spring weather and new legislation limiting flood insurance premium increases are lessening these concerns. In Massachusetts, however, inventory shortages are said to be the key reason for the decline in sales. One Massachusetts contact stated "there is just not enough supply to meet demand." As a result, Massachusetts contacts say multiple bids are common and the median sales price for single family homes has increased compared to the year-earlier median in 17 consecutive months. Median sales prices also increased year-over-year in Connecticut and Maine, but declined in Vermont and Rhode Island. Residential real estate contacts say they expect sales to pick up seasonally this spring, but foresee no significant market shifts.

Return to topReturn to top

Second District--New York

Economic activity in the Second District rebounded since the last report, as the harsh winter weather abated. Prices of finished goods and services remained generally stable, though businesses in a broad range of sectors report upward pressure on input prices. Manufacturers and especially service-sector firms in the District report that activity has picked up in recent weeks. Labor market conditions have shown signs of firming, in both the manufacturing and service sectors. Both general merchandise retailers and auto dealers report that sales have rebounded in recent weeks, following a weather-related slump in the first few weeks of the year. Tourism activity has been mixed since the last report, with weather continuing to be a factor. Both housing markets and commercial real estate markets were mixed but somewhat improved, on balance, in recent weeks. Finally, banks report increased loan demand from the commercial sector, little change in credit standards, and across the board declines in delinquency rates.

Consumer Spending
General merchandise retailers report that sales rebounded strongly in March, running at or close to plan and generally on par with or up a bit from comparable 2013 levels. Weather was still seen as a factor restraining sales in March--particularly for spring merchandise--but to a lesser extent than in January and February. Contacts at major malls in upstate New York report that sales rebounded in March, following a disappointing performance in the first two months of the year, and were up modestly from a year earlier. Similarly, two major retail chains report that same-store sales, which had been disappointingly weak in the first two months of the year, bounced back in March and were on or close to plan. Inventories are generally at or near desired levels. Prices are characterized as steady overall, though one contact reports ongoing heavy discounting.

Auto dealers in upstate New York report that new vehicle sales rebounded since the last report. Buffalo-area dealers report that new vehicle sales were robust in both February and March, with double-digit percentage gains over comparable 2013 levels. Good lease deals, as well as lease turn-ins helped drive this recent strength. Rochester-area dealers also report a pickup in sales of new vehicles in recent weeks, though less pronounced, with sales up moderately from 2013 levels. Dealers in both these areas also note some pickup in used car sales and note that wholesale and retail credit conditions, more generally, remain in good shape.

Tourism activity has been mixed since the last report. Both revenues and attendance at Broadway theaters picked up in March and were up nearly 15 percent from a year earlier--in part because there are more shows running now. The average ticket price has leveled off. In contrast, New York City hotels report some softening in demand: both occupancy rates and room rates slipped below comparable 2013 levels in March, resulting in a roughly 8 percent decline in revenue per room; still, it should be noted that the number of hotel rooms city-wide is up 5 1/2 percent. Contacts surmise that unseasonably cold weather into March may still be adversely affecting travel.

Finally, consumer confidence was little changed in March: Siena College's survey of New York State residents indicates a small decline in confidence, mainly among upstate residents; the Conference Board's survey also shows a small decrease in confidence among New York State residents but a small increase among residents of the Middle Atlantic states (NY, NJ, Pa) overall.

Construction and Real Estate
The District's housing markets continue to be mixed, with severe winter weather weighing on sales in parts of the District. In particular, contacts in the Buffalo-Niagara region indicate that a combination of harsh weather and low inventory has hampered sales activity, though home prices have held steady. This pattern appears to be mirrored in other parts of upstate New York. In northern New Jersey, while weather appears to be less of a factor, a backlog of foreclosed properties continues to weigh on prices, according to one industry contact. Still, there are some signs of a pickup in the market, and builders appear to be increasingly optimistic, especially about the multi-family rental market. New York City's co-op and condo market has shown further strength in the first quarter: a leading residential appraiser notes that prices continue to rise modestly in Manhattan and substantially in Brooklyn and Queens, buoyed by a low inventory of homes on the market. In Manhattan, a shift in the sales mix towards larger apartments and new development has reportedly boosted dollar sales volume and exaggerated the price rise. Manhattan's rental market remains on a plateau, whereas rents continue to rise briskly in Brooklyn. In Brooklyn, most new development is rental housing, while in Manhattan, it is predominantly condos.

Commercial real estate markets were generally stable to somewhat stronger through the end of the first quarter. In New York City, office availability rates were little changed, as brisk leasing activity allowed several newly available spaces to be absorbed; however, asking rents continued to rise and were up roughly 8 percent from a year earlier. Office availability rates were down modestly in the Long Island and Westchester/Fairfield markets; they were little changed in northern New Jersey but up modestly across upstate New York. Outside of New York City, asking rents for office space were little changed. Industrial markets were generally steady across upstate New York but showed signs of tightening in downstate New York and northern New Jersey.

Other Business Activity
The labor market has shown increasing signs of strength. A large and growing proportion of business contacts across the District plans to expand their workforces in the months ahead--particularly in the service sector. Moreover, two major New York City employment agencies report that labor demand has strengthened across the board, in particular with increased hiring from the financial sector. One contact notes that there are only scattered wage pressures but anticipates a broader pickup in wages soon. Another agency, however, has observed a growing number of unemployed job-seekers from the health care sector. Nevertheless, graduating college students in the New York City area are reported to be finding jobs quickly, and skilled workers are increasingly difficult to find--particularly in the IT field. In upstate New York, some auto dealers mention a shortage of skilled technicians.

Manufacturing firms in the District report that overall activity continued to expand modestly in March, while service-sector firms indicate a more pronounced pickup, following a weather-related slump in early 2014. Price pressures in the manufacturing sector have picked up somewhat but remain generally subdued, while in the service sector they remain steady but fairly widespread.

Financial Developments
Small to medium sized banks across the District report increased demand for commercial mortgages and commercial & industrial loans, but lower demand for residential mortgages; consumer loan demand remains little changed. Bankers report that credit standards are unchanged across all loan categories. Respondents indicate a decrease in spreads of loan rates over costs of funds for commercial mortgages and especially commercial & industrial loans, but report no change in other categories. Deposit rates are reported to be little changed. Finally, bankers report increasingly widespread improvement in delinquency rates across all loan categories.

Return to topReturn to top

Third District--Philadelphia

Aggregate business activity in the Third District grew at a moderate pace during this current Beige Book period. Many sectors rebounded to various degrees from the economic disruptions caused by severe winter weather in January and February. Auto sales rebounded robustly over the Beige Book period, returning sales to levels above one year ago. General retail sales contacts reported moderate growth that helped bring sales levels even with the prior year's levels. Demand for general services accelerated to a moderate pace of growth; staffing services reported slight gains. After declining in the previous Beige Book period, the construction and real estate sectors rebounded sufficiently to resume a slight pace of growth. Manufacturers also reported slight growth similar to what they had reported before the severe winter weather. An extended ski season helped winter tourist destinations to do well, while reports from the shore destinations were mixed during their off-season. Lending volumes grew slightly over this period, and credit quality continued to improve. Overall, contacts reported slight increases in wages, home prices, and general price levels, similar to the last Beige Book period.

Since most sectors seem to be resuming their trends from before the recent winter disruptions, most contacts are as optimistic as before, if not more so. Overall, contacts anticipated moderate growth over the next six months and continued to express confidence in the underlying economy. In regard to hiring and capital expenditure plans, firms are beginning to increase capital expenditures to boost efficiency, but they continue to approach new hiring with caution.

Manufacturing
Third District manufacturers reported that levels of activity rebounded with a slight overall increase during the current Beige Book period, following the previous decline that had been attributed to frequent, severe weather disruptions. New orders and shipments grew slightly this period after falling slightly last period. The share of all firms reporting increases in general activity rebounded from about one-fourth to one-third, while the share reporting decreases fell from about one-third to one-fourth. The makers of food products, lumber and wood products, chemicals, primary metals, and electronic equipment have reported gains, rebounding from the flat or lower activity they reported during the last Beige Book period. They join the makers of paper products, fabricated metals, and industrial machinery that have reported gains for both periods. A mixed report came from the makers of instruments during this period. Firms that reported stronger growth attributed much of the demand to growth in the auto- and housing-related sectors. Some increased demand is reported to stem from the desire of some big-box retailers to have access to a broader domestic supply chain.

Optimism that business conditions will improve over the next six months remained high and continued to be widespread across sectors. About half of all firms continued to anticipate increases in activity; however, slightly more firms than before (now, about one-sixth) reported expectations of lower activity. About one-third of all firms reported that they anticipate higher levels of employment and capital expenditures in six months--up from one-fourth in February. Nearly half of all firms anticipate that overall capital expenditures for 2014 will be higher than they were in 2013. While most firms reported that their capital expenditures focus on technology to increase their plant productivity with few new hires, a few firms reported plans to increase both their plant and staff size.

Retail
Third District retailers reported a healthy rebound from the prior Beige Book period when sales slipped below plan and below the prior year. Retailers reported that sales grew at a moderate pace over the period and finished about even with last year. Stronger sales were observed despite ongoing poor weather that continued to limit sales potential and prompted continued heavy promotions to move inventory. Contacts also explained that year-over-year comparisons would be positive if one adjusted for the early Easter activity that was included in 2013 sales. Moreover, contacts described traffic returning to stores, reporting that the last Saturday of March was "tremendous," despite rain and snow, and restaurants were packed. Retail development managers described strong optimism for new deals over the remainder of 2014 and into next year. Contacts mentioned rising rents for lease renewals, higher capital expenditure plans for new stores, and greater attendance and enthusiasm at deal-making conferences. 

Auto sales rebounded robustly during this Beige Book period compared with the prior period when winter weather took a significant toll on sales. Dealers reported that sales grew at a strong pace, especially during several good weekends in March; the last week of March was "about as good as it gets." According to one large dealership, its sales force closed on 30 to 40 vehicles per salesperson in March. Auto dealers remain bullish for 2014. In addition to expecting to capture more sales lost to winter weather, dealers cite increased credit availability, demand for leasing, and the still-high average age of cars as factors for their optimism.

Finance
Third District financial firms have reported slight increases in total loan volume since the last Beige Book. Commercial and industrial loan volume grew modestly, and commercial real estate loans grew slightly. Other real estate loans, such as home equity lines and mortgages, changed little. Volumes of credit card lending and other consumer credit loans fell throughout the Beige Book period (until the last week); however, those declines are typical of the seasonal trend following the winter holiday credit run-up. Overall, banking contacts described increasing consumer confidence, stronger middle market lending, but continued reluctance by small businesses to extend themselves with hiring or new investments. There were some exceptions, however: Some small businesses in healthier markets began to hire, while other markets with continuing high foreclosure rates struggled to grow at all. In healthier markets, housing prices have firmed, appraisals have strengthened, and credit quality has improved. Overall, most bankers remained optimistic for growth through the remainder of the year; however, markets were divided between those who believed the economy had turned a corner and others who continued to see a slow bleed of population and business in their local market.

Real Estate and Construction
Third District homebuilders continued to report weather-related disruptions to new home sales; however, customer traffic and construction activity grew enough to resume more normal levels. One builder reported a "decent" number of contract signings in March but stated that contract closings for the entire first quarter were well below last year and even further below plan for this year for them as well as for other area builders. Most builders, large and small, expect to see a strong spring sales season in part due to growing pent-up demand from winter as well as the slowly improving economy. Some builders are using their own cash to build more speculative homes, anticipating that potential buyers will make faster decisions on a finished property than on a build-to-suit home. According to residential real estate brokers, sales activity grew somewhat from the prior Beige Book period; however, March contract numbers were still not good. Sales of existing homes were down (year over year) in most of the Third District's larger metropolitan areas in February. Pending sales and new listings were also reported as declining at a modest pace, except along the Jersey Shore where listings were up slightly but only when compared with the quiet market that prevailed after Hurricane Sandy. Throughout the Third District, brokers expect to recapture some portion of the "lost" sales over the next three months; however, some potential buyers from the first quarter of 2014 may defer a decision until 2015.

Nonresidential real estate contacts indicated slight increases--representing a resumption of nearly normal activity following disruptions from the more severe weather of the prior period. Ongoing commercial construction resumed a low level of activity but is expected to ramp up this summer, as several major projects are expected to break ground. Leasing activity also rebounded slightly with the greatest activity (and lowest vacancy rates) for offices in the Philadelphia central business district and the Lehigh Valley. Despite the ongoing slow job growth of firms that fill office space, most contacts remain optimistic for stronger growth as the year progresses.

Services
Activity among Third District service-sector firms accelerated to a moderate pace of growth since the last Beige Book. Ski resorts and other winter tourist destinations reported a stellar season and one of the longest ski seasons for many resorts. Some mountain resorts have been able to extend the ski season almost up to the opening of their golf season. Contacts along the shore destinations provided mixed reports regarding tourist traffic over the slow winter season. Responses were more uniformly positive regarding early bookings for the summer season. A few contacts from both mountain and shore resorts reported that many summer weekends are already sold out.

Other service-sector firms reported mostly moderate growth rates, with almost half reporting increased sales and over 40 percent reporting increased orders. Staffing firms that lost billable hours during weather-related business closings reported modest growth--resuming their previous trend. One central Pennsylvania firm reported seeing a lot of hiring activity across all sectors of the economy and deemed that growth to be sustainable. Overall, the vast majority of service-sector contacts are optimistic that the growth trend will continue over the next six months.

Prices and Wages
Overall, Third District contacts reported no change to the steady, slight pace of price level increases, similar to other recent Beige Books periods. Manufacturing firms reported that prices paid and prices received tended to rise slightly, about the same as last period. Auto dealers reported little change in pricing, general retailers reported ongoing promotions, and most builders reported holding prices steady, if they were not offering specials. Many contacts continued to report tight, or narrowing, margins. Generally, real estate contacts continued to report rising prices for lower-priced homes, while higher-priced homes are aligned to local market conditions. Several contacts reported that appraisals are starting to support local sales offers. Very few contacts are seeing wage pressures, although labor market tightening was observed in some smaller central Pennsylvania markets.

Return to topReturn to top

Fourth District--Cleveland

On balance, economic activity in the Fourth District declined slightly in the past six weeks. The severe winter weather appears to have negatively impacted business activity to a heightened degree; some producers and service providers are still experiencing lingering effects. Demand for manufactured products grew at a slow rate. Building contractors reported that their pipelines remained active, while field work slowed. Retailers and auto dealers experienced disappointing sales during February and into March. In the energy sector, shale gas production stayed at a high level, while coal output trended lower. Freight volume declined. Demand for business and consumer credit moved higher.

Hiring was sluggish across industry sectors. Reports by staffing-firm representatives on the number of job openings and placements were mixed, with job vacancies found primarily in manufacturing and healthcare. Wage pressures are contained. Input and finished goods prices saw little change, apart from increases in metals, building materials, and diesel fuel.

Manufacturing
Reports from District factories indicated that production levels held steady or they started to pick up as supply chain disruptions seen earlier in the year dissipated. Compared to a year ago, demand was generally consistent or somewhat higher. Many of our contacts expect production will rise relative to current levels in the upcoming months, with the strongest demand coming from the oil and gas sector and the motor vehicle industry. However, some concern was expressed about a weakening in Chinese and western European markets and its effect on new orders. Steel shipments grew slightly during the past six weeks. Contacts expressed disappointment with the overall level of market activity during the first quarter. Some believe that the severe winter weather may be partially responsible for the slow start to the year. Steel shipments are expected to grow, but at a slow pace: estimates of year-over-year growth rates ranged from 2 to 5 percent. District auto production increased modestly during February on both a month-over-month and year-over-over basis. One motor vehicle OEM reported that recent weather-related supply disruptions might negatively impact his production schedule until early summer.

Finished goods inventories have increased slightly, primarily due to an expected rise in demand or weather-related cutbacks in new orders. Several contacts noted that their capacity utilization rates rose during the past six weeks but are still within a normal range. Capital expenditures were in line with budgeted amounts for the fiscal year. Current budgets are higher than those of a year ago, with outlays being used for equipment upgrades, product development, and maintenance. Raw material price growth was mainly flat, although several reports indicated rising prices for metals. However, passing through price increases to customers was difficult. The number of manufacturers who are hiring skilled production workers and engineers has declined since our last report. Wage pressures are contained.

Real Estate and Construction
The number of new and existing single-family homes sold during February was little changed compared to the previous month. On a year-over-year basis, the number of units sold showed a modest decline. In contrast, single-family housing starts across the District fell sharply between January and February and compared to a year ago. Single and multifamily permits also declined during February. Although the drop-off in activity was attributed primarily to the cold weather, there is some concern about the housing market stabilizing after a year of fairly robust growth. New-home contracts were in the move-up price-point categories. Builders raised prices slightly on new homes after the beginning of the year to offset material and labor cost increases. Most of our contacts anticipate that the housing market will grow at a slow but steady pace in 2014.

Activity in nonresidential construction held steady during the past six weeks, with demand coming from a broad range of industry sectors. Reports indicated that the severe winter weather slowed fieldwork. While inquiries continued at a steady pace and backlogs were characterized as reasonably good, builders expressed frustration with financing issues or customers who keep pushing back contract signings. Some builders believe the latter is due to a lack of confidence in the underlying strength of the economy. One contact observed that unless clients have a compelling need, they will not move on new construction. Nonetheless, builders remain cautiously optimistic and expect modest to moderate growth this year.

Prices for concrete, drywall, and hardwood are trending higher. General contractors are satisfied with current staffing levels and plan to hire only for replacement or if business activity expands. Subcontractors are still confronting a tight supply of skilled labor; their ability to perform in a robust market and rising wage rates are a concern among many general contractors. Reports of rising costs related to healthcare are widespread.

Consumer Spending
Retailers reported that the cold weather played a role in holding down consumer spending during February and into early March. A few of our contacts observed that as weather conditions began to improve later in March, so did their sales. In general, same-store revenues were down slightly from a year ago. Cold-weather gear and small personal items were in highest demand. One contact reported a softening in purchases of consumables. Retailers are optimistic about consumer spending in the second quarter due to pent-up demand, the Easter holidays coming in late April, and warmer weather. Most projections were for single-digit increases in revenues. Vendor and shelf prices held steady. Several retailers noted that they are running more promotions than normal, though inventories were described as being in good shape. Hiring will be restricted to staffing new stores, and even here, it will be limited.

The number of new motor vehicles sold in February fell sharply compared to January figures. The decline was attributed to the persistently cold weather. However, unit volume was unchanged from a year earlier as light-truck sales continued to trend higher and auto sales moved down. New-vehicle inventories remain slightly elevated, which was credited to the extreme weather. Used-vehicle purchases during February were ahead of those in January and a year ago. The outlook by dealers for the spring selling season is positive, with several noting a rise in incentives at this time of year to help boost sales. Leasing continues to grow in popularity as an alternative to purchasing a vehicle. Dealers are anticipating an uptick in payrolls, some of which is seasonal.

Banking
Demand for business credit began to pick up after a slow start earlier in the year. Requests were strongest for commercial real estate development, including multifamily housing, equipment financing, and mergers and acquisitions. Pricing of business loans remains competitive. Consumer credit demand stayed on a slow upward trend. Requests were primarily for auto loans and home equity products. We heard a few reports about declining credit card balances. Comments on residential mortgage activity were mixed; bankers seeing an increase said that most applications were for purchase transactions. Our contacts reported no changes to loan-application standards. Delinquency rates were stable or trended lower. Core deposits (consumer and business) grew slightly since our last report. Banking payrolls held steady, with little change expected in the upcoming months.

Energy
First-quarter coal production across the District fell below year-ago levels. However, the rate of decline is shrinking, due in part to higher demand from domestic electric utilities. Going forward, little change in output is projected. Spot prices for steam coal rose slightly, while metallurgical-coal price growth was flat. Natural gas production was stable at a high level. However, the number of unconventional wells drilled has fallen off. We heard a couple of reports indicating that conventional drilling companies are experiencing historic lows in activity due to low natural gas prices. Apart from diesel fuel, equipment, material, and labor costs were stable. Hiring was for replacement only.

Freight Transportation
Freight executives reported that their bottom lines fell sharply through the first two months of 2014 due to the severe winter weather—volumes declined while costs rose. After adjusting for weather-related costs, carriers were still close to their projected growth targets. As weather conditions improved, volume began to pick up. However, one contact noted that some business that was lost to the weather is unlikely to be regained. Diesel fuel prices moved higher in January and February. Operators have been unable to pass through the entire increase via surcharges. Year-to-date capital expenditures were in line with budgeted amounts. Monies are allocated more for equipment replacement than for capacity expansion. We heard reports about some carriers experiencing difficulty meeting demand due to the impact brought about by the hours-of-service regulations. The end result could be higher rates, which would help enable carriers to purchase additional equipment. Hiring is mainly for replacement.


Return to topReturn to top

Fifth District--Richmond

The Fifth District economy expanded moderately since our last report. Manufacturing reports were mixed, ranging from lackluster to a pickup in production. Retail revenues also varied in recent weeks, with moderate growth on balance. Revenues remained generally flat in the non-retail service sector. Tourism increased, although persistent cold weather continued to lower forward bookings. Residential real estate markets improved; inventory was low in many areas although there were pockets of new construction. Construction of multifamily housing remained solid and construction of retail space increased. However, office and industrial building softened. Residential mortgage lending was sluggish and refinancing declined further. Commercial borrowing strengthened. Leasing of retail and industrial space picked up, while demand for office space weakened. In agriculture, prolonged winter weather delayed planting of row crops; prices of beef and pork rose. Natural gas production remained robust. Reports on labor markets were mixed, and average wages rose modestly. According to our latest survey, service sector prices edged up more quickly while retail prices advanced at a slower pace. In manufacturing, prices of raw materials and finished goods rose at a slower pace.

Manufacturing
Manufacturing reports were mixed in recent weeks. Winter weather continued to affect some regions and manufacturers reported that they were trying to make up lost production. A food manufacturer stated that the weather delayed shipments and also reduced some Mardi Gras orders, but production was unchanged overall. A producer of industrial equipment components reported a slowdown because capital goods orders had fallen. In contrast, a fixtures manufacturer remarked that his firm has been "busting at the seams" and he planned to expand. Another producer said he was keeping inventory low. Several manufacturers reported an increase in supplier delivery times. Manufacturers expected a pickup in orders during the weeks ahead. Prices of raw materials and finished goods rose at a slower pace, according to our survey.

Ports
Port officials reported that container volume continued to grow briskly, despite winter storm disruptions. Import growth exceeded export growth, with particular strength in housing-related durable goods, auto parts, and some seasonal products. Exports of grain and soybeans were especially robust and significant increases in exports of construction and building equipment destined for Europe moved through the Port of Virginia. Coal shipments declined. A South Carolina port official reported that a recently announced local automotive expansion will increase exports. Auto exports from the Port of Baltimore softened somewhat.

Retail
Reports on retail revenues varied in recent weeks, but generally pointed to moderate gains. A large auto dealer outside the Washington, D.C. beltway reported that business had increased dramatically, necessitating additional inventory purchases. He attributed the strength to improved consumer attitudes about the economy. A discount retailer in the Tidewater area of Virginia reported that average transaction amounts had increased, but the drawn out winter weather had reduced foot traffic, resulting in overall sales contraction. The manager of a discount store in Baltimore stated that sales revenues were unchanged despite recent price increases. However, an executive at a chain of hardware stores in central Virginia saw somewhat faster sales growth. Retail prices rose at a slower pace since our last report.

Services
Revenues remained generally flat in the service sector. A financial services executive remarked that clients were feeling more confident, but there has been no real change in their investment activity. A North Carolina hospital executive reported that demand for services was only slightly higher in recent weeks, and a CPA reported business was at typical seasonal levels. According to an executive at a national freight trucking firm, shipments have increased markedly in recent weeks, partly due to "catching up." Harsh winter weather kept many trucks from delivering goods and pre-loaded trucks could not leave warehouses because no one was present to release the freight. Service sector prices edged up more quickly.

Travel and tourism reports were generally positive. A Virginia hotel representative reported that government groups have started booking conferences again after nearly a year of decline. In Washington, D.C., tourist traffic for the Cherry Blossom Festival started in March and was described as robust, even though cold weather pushed the peak bloom time to the second week of April. An executive at a Virginia resort reported that his facility had the longest ski season in their history this winter with higher than typical occupancy. However, spring break bookings have shortened as schools make up winter class cancellations, and summer vacations are being booked for a week later than normal this year. A hotel manager in western North Carolina said bookings were "decent and growing." Most hoteliers reported that although they expect strong bookings this summer, they have not increased rates.

Finance
Recent trends continued as consumer borrowing remained depressed while commercial lending strengthened. Residential mortgage and refinance demand was sluggish, according to several bankers. A lender commented that the slower pace has led to bankers becoming more aggressive on rates to get business. New auto lending also weakened slightly in recent weeks. In contrast, demand for commercial real estate and new business lending remained robust. Credit quality of applicants has improved recently, while credit standards were unchanged.

Real Estate
Residential real estate improved, with some reports of strength. District home sales rose mildly and sale prices edged up. In some instances weather continued to slow buyer traffic, although Realtors reported a pickup as spring started. A Northern Virginia broker reported that activity remained strong and homes in his region were "getting snatched up" at or above asking price with multiple offers. Inventory was generally limited, although some contacts reported that new construction had boosted inventories a little. North Carolina Realtors reported conservative growth in single family residential building and a South Carolina contact stated that builders are starting to construct more pre-sold custom homes. A Maryland contractor stated that a townhome community located near the Washington, D.C. beltway was quickly selling units at a high price, while projects in other locations were slower to move.

Commercial construction contacts reported strong retail demand and softness in office and industrial building. A contact in South Carolina said free-standing retail was "hot," and an increase in retail construction was also noted in Virginia Beach. Construction of multifamily housing remained strong. Commercial leasing activity intensified for retail and industrial space, while demand for office space softened. Vacancy rates were unchanged on net, however. Rental rates varied across submarket, with some increases in the retail segment. A South Carolina Realtor reported that the industrial market was "incredibly active" with an increase in manufacturing inquiries and that the state's commercial retail market had ramped up. Broker reports on supply of Class A office space varied.

Agriculture and Natural Resources
Persistent cold temperatures and wet field conditions delayed planting of row crops and in some locations, limited days out in the fields. There were reports of slower small grain growth and some freeze damage to fruit trees. An agribusiness located in South Carolina reported that winter weather pushed back some of their harvesting timelines, although demand levels remained solid. Beef prices remained high and pork prices increased due to a virus currently being found in pigs. A contact reported that the spreading virus decreased the number of pigs available to farmers and reduced the number maturing to hogs.

The natural gas sector remained robust. A contact in West Virginia reported an increase in manufacturers seeking natural gas. Coal production declined at a slower rate in recent weeks. The severe winter increased coal demand and diminished stock piles at power generating plants, bringing levels below the five year average. Coal production is expected to be steady as inventories are replenished.

Labor Markets
Reports on labor markets were mixed. Skilled manufacturing workers and specialized information technology workers were in high demand. However, a contact at a financial services firm commented that his office was "skittish" about hiring. Firms reported that finding manufacturing employees with the requisite skills remained challenging. An employment contact said entry level laborers were "easily sourced." Temporary employment was generally unchanged, although some manufacturing contacts increased hiring to make up for weather-related lost production. According to our most recent surveys, manufacturing employment remained flat, the average workweek increased, and manufacturing wages grew at a slower rate. In the service sector, hiring declined slightly and average wages rose modestly.

Return to top Return to top

Sixth District--Atlanta

On balance, the Sixth District economy expanded at a modest pace from mid-February through March. Reports across sectors were optimistic and most business contacts expect near-term activity to grow at a moderate pace.

Retailers cited a slight pickup in activity after experiencing sluggish sales at the beginning of the year. Hospitality contacts in areas negatively impacted by the adverse winter weather saw improvements in activity. Home sales were mixed but prices continued to appreciate from a year ago, according to residential homebuilders and brokers. Commercial real estate activity improved with construction growing at a modest pace from last year. Manufacturers reported continued improvements in new orders and production. Bankers noted an increase in loan demand. Hiring remained restrained for all sectors except construction. Prices increased slightly but most firms continued to report having little pricing power.

Consumer Spending and Tourism
District merchants reported an uptick in activity from mid-February through March following sluggish sales in January, which were widely attributed to the severe winter weather. Valentine's Day provided a boost to activity with some contacts reporting double-digit, year-over-year, sales growth. Retailers continued to express concerns regarding the potential impact from increased healthcare premiums on consumer discretionary income. Light motor vehicle sales grew modestly over the time period.

Overall, District hospitality contacts reported positive activity after experiencing a decline in January as a result of the adverse weather conditions. However, negative impacts on the number of travelers to the District due to international political issues, especially on Latin America visitors, were a concern among many tourism contacts. The outlook for the next six months remains optimistic with most expecting an increase in business and leisure travel compared with a year ago.

Real Estate and Construction
District brokers' reports were slightly less positive than in previous reports. Brokers reported home sales were mixed. In areas where sales growth had slowed, brokers largely attributed the softness to higher home prices, limited inventory, and higher mortgage rates. Inventory levels continued to fall on a year-over-year basis and the majority of contacts reported that home prices remained ahead of the year earlier level. The sales outlook among brokers was somewhat weaker since our last report, although most contacts indicated that they expect the recent softness to be temporary.

Reports from District builders were slightly less positive than earlier reports. Fewer contacts indicated that recent activity was in line with their plan for the period. However, the majority of builders reported that construction activity and new home sales were ahead of the year earlier level. Most reports indicated that the level of unsold inventory had fallen from a year ago. The majority of contacts continued to report modest home price appreciation. The outlook among builders for sales and construction activity remains positive.

District brokers noted that demand for commercial real estate continued to improve. Absorption picked up, although contacts indicated that the rate of improvement still varied by metropolitan area, submarket, and property type. Construction activity continued to increase at a modest pace from last year. Most contacts reported that their current backlog was ahead of year earlier levels. Commercial contractors indicated that apartment construction remains fairly strong; however, some shared concerns that construction activity may be getting overheated in a few markets. Contacts reported that construction activity across other property types increased modestly. The outlook among District commercial real estate contacts remained positive with continued improvement expected over the course of the year.

Manufacturing and Transportation
Manufacturers reported increased activity across the region from mid-February through March. Significant improvements were cited in production and new orders. Weather conditions hampered activity, but the impact was not as severe as earlier this year. Finished inventory levels rose while purchasing agents reported longer wait times for supply deliveries and higher commodity prices. Nearly half of purchasing managers polled expect production levels to be higher over the next three to six months.

District transportation contacts widely reported an expansion of activity since the last report. Port contacts were especially upbeat, citing a rise in energy exports, increased shipments of bulk agricultural commodities, and record container volumes. Significant capital expenditures for port property expansion, infrastructure, and tenant activity were noted. District trucking contacts reported strong freight volumes, along with notable increases in tonnage following a significant decline in January due to the weather. Railroads continued to cite modest gains in intermodal traffic, led by container volume. Total rail carloads remained flat as significant increases in shipments of grain, petroleum, and metallic ore were offset by double-digit declines in the movement of farm products, phosphate rock, and coke.

Banking and Finance
Since the last report, some banking contacts indicated a loosening of credit as a result of increased competition. Community bankers reported improved loan demand with aggressive loan terms and pricing driven by competition from larger banks and other community banks. Commercial loans were primarily fueled by poaching transactions from other banks rather than new business formation though District bankers noted a healthy pipeline for new loans related to commercial real estate. Credit line usage fell at some banks and small business clients remained hesitant about new borrowing. Banking contacts indicated their cost of doing business was going up as compliance costs increased.

Employment and Prices
District payroll growth remained constrained from mid-February through March. Firms continued to show a preference for implementing technology to increase output as opposed to adding staff. However, hiring increased in the construction sector across most of the District. Trucking companies continued to note difficulty finding drivers. Some employers continued to show hesitance in hiring on a large scale due to concerns surrounding healthcare reform.

Contacts continued to indicate little wage pressure outside of some high-skilled positions. With regard to the Affordable Care Act, most large companies expressed little concern about the law; however, some small and service-oriented businesses noted that health benefits costs had risen significantly and more eligible employees elected coverage. Non-labor input costs increased very slowly, with a few noted exceptions, including rising costs for developed land, construction materials, and food. Unit costs are expected to increase 1.8 percent over the next year, according to the Atlanta Fed's survey of business inflation expectations. Profit margins remained tight across most industries, as contacts continued to report very little pricing power.

Natural Resources and Agriculture
Contacts reported that harsh winter weather exposed limitations in U.S. natural gas distribution infrastructure. Demand was high and there was ample supply, yet transportation and distribution of gas was limited by the weather. In order to meet demand, power plants that typically operate with natural gas were forced to revert to coal. Over the fall and winter, utility companies in the region experienced growth in their residential customer base and attributed this to household formation and migration. The outlook among energy contacts remains optimistic for the year.

While sufficient rainfall left only small pockets of dry conditions in the District, some growers reported delaying spring planting due to too much precipitation. Florida's citrus growers continued to seek ways to mitigate the effects of citrus greening and contacts were hopeful that new research funding included in the recently approved Farm Bill would help find a solution to this problem.

Return to topReturn to top

Seventh District--Chicago

Growth in economic activity in the Seventh District picked up in March, and contacts generally maintained their optimistic outlook for 2014. Growth in consumer and business spending increased. Growth in manufacturing production was moderate, while growth in construction and real estate activity was modest. Credit conditions were little changed on balance. Cost pressures remained mild. Corn, soybean, milk, hog, and cattle prices moved higher.

Consumer Spending
Growth in consumer spending increased slightly in March, but remained modest. Sales of winter-related items, such as clothing and snow removal equipment, were stronger than normal, while other sales categories picked up as the weather improved. Retail contacts noted that the colder weather had likely created some pent-up demand as customers delayed purchases of spring- and summer-related items. Light vehicle sales increased since the last reporting period, spurred by new products, increased incentives, and higher showroom traffic levels as the weather improved. Dealers also reported higher activity levels in their service and parts departments because of winter-related maintenance. However, some retailers expected that higher utility bills during the winter months would negatively affect household spending.

Business Spending
Growth in business spending increased to a moderate pace in March. Inventories remained at comfortable levels for most manufacturers. Retailers expanded their inventories despite some weather-related delivery delays. Growth in capital spending picked up. Several contacts reported new spending on equipment and information technology, along with investment in structures. The pace of hiring increased, and while hiring plans decreased slightly, they remained positive. A staffing firm noted a slight increase in demand for their industrial services, but a continuing decrease in demand for their professional services. A number of manufacturers and some retailers reported capacity expansions along with attendant hiring or plans to hire. Demand remained strong for skilled workers, with positions often difficult to fill in engineering, information technology, accounting, and other technical occupations. Contacts cited an increasing willingness on the part of firms to train workers, where shortages exist, through in-house training, tuition reimbursement, or partnerships with local high schools and community colleges.

Construction and Real Estate
Growth in construction and real estate activity was modest in March. Although conditions have improved since the last reporting period, contacts reported that adverse weather continued to restrain growth. A decline in single-family construction was offset by growing demand for new apartment projects as residential rents continued to increase. Home sales and new listings declined, though brokers attributed this primarily to cold weather and were optimistic that activity would improve during the coming months. Several contacts cited high unemployment and restrictive lending standards as barriers to more robust growth. Demand for nonresidential construction grew at a moderate pace, with several contacts noting that industrial building activity had picked up substantially. In addition, contacts expected an increase in public construction resulting from the impact of harsh winter weather on infrastructure. Commercial real estate activity continued to expand, as vacancies ticked down and rents rose. Growth was concentrated in central business districts with high-end office space.

Manufacturing
Growth in manufacturing production increased from a mild to moderate pace in March, with contacts from a number of industries reporting increased activity. The auto, aerospace, and energy industries remained a source of strength for the District. Auto and steel production recovered from the weather-related slowdown, with overtime hours increasing to make up for earlier lost production. In addition, a steel industry contact noted that capacity utilization had returned to its expected level. Specialty metals manufacturers shared in the overall improvement of conditions, with many contacts reporting an increase in new orders and order backlogs. Manufacturers of consumer goods and construction materials also indicated increased demand. In contrast, demand for heavy machinery grew at a slow and steady pace, buoyed by the construction, transportation, and energy sectors, but weighed down by weakness in mining. A number of exporters reported that growth in demand from China was slower than expected, although growth picked up in Europe and Japan.

Banking and Finance
Credit conditions were again little changed on balance over the reporting period. Corporate financing costs for a number of District firms decreased slightly, as bond spreads narrowed. Banking contacts reported moderate growth in business loan demand, mostly driven by purchases of equipment. The leveraged loan market remained active with steady deal flow. Contacts noted continued competitive pressure on structure and pricing for commercial and industrial loans. Growth in consumer loan demand was modest, with a slight uptick in demand for home equity lines of credit and continued strong growth in auto lending.

Prices and Costs
Cost pressures remained mild. While energy and transportation costs continue to be elevated, prices were lower than during the previous reporting period. Prices for nickel, aluminum, steel, and cement rose, and fell for copper and scrap steel. Retailers reported little change in prices, with the exception of some rising prices for foodstuffs. Wage pressures were slightly lower overall but mixed across industries. Overall, non-wage pressures moderated even while contacts continued to report concern about higher healthcare premiums.

Agriculture
The slow arrival of spring-like weather delayed fieldwork. However, concerns about a delayed start to planting were muted, especially in Illinois and Indiana where 2013 crops performed well after being planted late. The mood among farmers improved as crop prices increased enough from winter lows that breakeven outcomes now seem possible. Hence, there has been more forward contracting of crops than a year ago to manage risk. Higher soybean prices still support a shift in planting intentions toward soybeans and away from corn, but not as much as earlier this year. Fertilizer costs decreased from a year ago, and seed costs were flat. The livestock sector moved further into the black, as milk, hog, and cattle prices increased. Given lower numbers of hogs and cattle available to market, animals were fed longer in order to gain additional weight. Although hog operations were still battling a virus that killed many piglets, there were signs that the worst had past.

Return to topReturn to top

Eighth District--St. Louis

Business activity in the Eighth District has declined slightly since our previous report. While recent reports of planned activity in manufacturing have been positive, reports in services have continued to be negative on net. Residential real estate market conditions have deteriorated slightly, while commercial real estate market conditions have been mixed. Finally, total lending at a sample of small and mid-sized District banks decreased slightly from mid-December to mid-March.

Manufacturing and Other Business Activity
Reports of plans for manufacturing activity have been positive since our previous report. Several manufacturing firms reported plans to add workers, expand operations, or open new facilities in the District, and a smaller number of manufacturers reported plans to reduce employment. Firms in food, steel ferroalloy, roofing material, thermal, furniture, biomedical testing products, alcoholic beverage, medical equipment, industrial inorganic chemicals, and aircraft manufacturing plan to hire new employees and expand operations in the District. In contrast, firms that manufacture carbonated beverages and pharmaceuticals reported plans to close down facilities and lay off workers in the District.

Reports of planned activity in the District's service sector have been negative on net since the previous report. Firms in food, health care, and casino gaming services plan to lay off a large number of employees. In contrast, firms in online shopping, restaurant, telecommunication, marketing, accounting, logistics, insurance, and mortgage services reported plans for new hiring and expansion in District. Reports from retail contacts were generally positive. Contacts reported a number of store openings and planned openings in the St. Louis and Louisville areas.

Business contacts in the Eighth District noted that price and wage growth pressures have been generally modest in recent weeks. Contacts in Louisville noted that challenges in retaining and attracting workers have resulted in some wage growth.

Real Estate and Construction
Sales of new and existing homes declined across most of the largest metro areas of the District. Compared with the same period in 2013, January 2014 total home sales were down 12 percent in Louisville, 5 percent in Memphis, and 30 percent in St. Louis. In contrast, total home sales were up 7 percent in Little Rock. Similarly, February 2014 year-to-date single-family housing permits decreased in the largest metro areas of the District compared with the same period in 2013. Permits decreased 26 percent in Louisville, 23 percent in Little Rock, and 10 percent in St. Louis. In contrast, permits increased 14 percent in Memphis.

Commercial and industrial real estate market conditions have been mixed throughout most of the District. A contact in Evansville, Indiana, reported a languishing commercial real estate market. Contacts noted slow growth in the commercial real estate market in northeast Mississippi and no growth in the industrial market in Shelby County, Mississippi. Contacts in St. Louis reported increased demand for industrial space, while office leasing and sales slowed in the first quarter of 2014. On the other hand, commercial and industrial construction activity improved throughout most of the District. A contact in Louisville reported new commercial construction plans in west Louisville. A contact in Memphis reported a new office building construction in the east Memphis business corridor and several new industrial projects in DeSoto and Fayette counties in Mississippi. A contact in Little Rock reported a new industrial construction project. Contacts in St. Louis reported an ongoing construction plan at the Gateway Commerce Center and several industrial construction plans in St. Charles and north St. Louis County.

Banking and Finance
Total loans outstanding at a sample of small and mid-sized District banks decreased 1.3 percent from mid-December to mid-March. Real estate lending, accounting for 72.9 percent of total loans, decreased 1.3 percent. Commercial and industrial loans, accounting for 15.7 percent of total loans, decreased 0.2 percent. Loans to individuals, accounting for 5 percent of total loans, decreased 0.9 percent. All other loans, accounting for 6.3 percent of total loans, decreased 4.7 percent. During this period, total deposits at these banks increased 0.5 percent.

Agriculture and Natural Resources
District farmers are expected to plant 1 million fewer acres of corn in 2014 (a decline of 4 percent) relative to 2013. In contrast, District farmers are expected to plant 570,000 and 511,000 more acres of soybeans and rice this year than in the previous year (an increase of 2 percent and 37.6 percent), respectively. Year-to-date coal production in the District for February 2014 was 5.4 percent lower compared with the same period in 2013. Coal production for February 2014 was 4.6 percent lower than in February 2013.

Return to topReturn to top

Ninth District--Minneapolis

The Ninth District economy continued to grow at a moderate pace since the last report. Increased activity was noted in commercial construction and real estate, professional services, manufacturing, tourism and energy. Mining and consumer spending were level, while agriculture was mixed and residential real estate and construction activity decreased. Labor markets continued to show signs of tightening, and wage increases were moderate. Overall price increases were modest.

Consumer Spending and Tourism
Overall consumer spending was level since the last report. Recent traffic was down from a year ago at a Minneapolis area mall largely due to unusually cold and snowy weather, while sales were up slightly. Sales at a Montana mall were up 5 percent in February compared with a year ago, while March sales slowed somewhat. A Minnesota-based food producer reported that recent sales were down slightly from a year ago, while a Minnesota-based clothing retailer noted that same-store sales were down slightly. Meanwhile, a car dealer in Minnesota noted strong sales during the past few weeks.

Late winter tourism activity was up somewhat. In northwestern Wisconsin, recent lodging levels were strong, while advance bookings for summer vacations were filling up. Several Montana ski resorts were able to extend their seasons due to the deep snow. According to a survey, 57 percent of Montana tourism business owners expect increases in visit numbers during 2014, while only 4 percent expect decreases. A travel agency in Minnesota noted that spring break travel bookings were about the same as last year.

Construction and Real Estate
Commercial construction activity continued to grow since the last report. The value of March commercial permits in Sioux Falls, S.D., increased 18 percent from a year ago. A large university is proposing a $190 million athletic complex. Overall residential construction activity decreased. In the Minneapolis-St. Paul area, the value of March residential permits decreased slightly from March 2013, while the value of March residential building permits in Billings, Mont., decreased. Residential building permits in Sioux Falls dropped significantly in value in March from a year earlier.

Activity in commercial real estate markets increased since the last report. Several cities in Minnesota noted increased interest in office, retail and hotel projects by developers. Residential real estate market activity decreased since the last report. In the Sioux Falls area, February home sales were down 2 percent and inventory was down 5 percent, while the median sale price increased 3 percent relative to a year earlier. In Eau Claire, Wis., March home sales declined and the median price increased from March 2013. Meanwhile, February home sales in Minnesota were down 11 percent from the same period a year ago; the inventory of homes for sale was down 1 percent, while the median sale price rose 9 percent.

Services
Contacts from a wide variety of professional business services firms noted increased activity since the last report. An architecture firm reported that business recently hit record levels due to increased apartment construction. An engineering firm said growth was spreading across the District. A law firm noted growth in a broad mix of specialties. An accounting firm reported that while activity was slower in the beginning of the year, it picked up recently.

Manufacturing
District manufacturing activity increased since the last report. A March survey of purchasing managers by Creighton University (Omaha, Neb.) indicated that manufacturing activity increased in Minnesota and the Dakotas. In Minnesota, a medical device parts supplier was expanding its production facilities and a producer of recycling machinery was expanding its production and shipping facilities to meet strong international demand. Several unmanned aerial vehicle makers have recently expanded in eastern North Dakota due to the location of a test facility there.

Energy and Mining
Activity in the energy sector continued to increase at a brisk pace. Late-March oil and gas exploration increased in North Dakota and decreased slightly in Montana from the last report, while production remained at record levels. A North Dakota grain elevator recently finished a conversion that will allow the facility to load and ship sand used for hydraulic fracturing. Mining activity was stable. Production at district iron ore mines in early 2014 was roughly level from a year earlier. In Montana, regulators recently approved the expansion of a gold mine, while two other proposed operations were in the exploration stages.

Agriculture
District agricultural conditions were mixed, with livestock and dairy producers performing well, while crop producers were in worse shape. March prices received by farmers fell from a year earlier for corn, wheat, soybeans and chickens; prices increased for cattle, hogs, milk, eggs and turkeys. While crop prices increased slightly in March from the previous month, th...
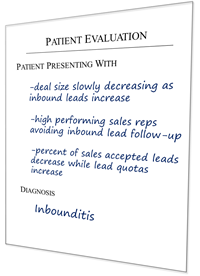
17 Apr 14:43

What You Don’t Know About Your Pipeline That’s Killing Your Sales

by Keenan

What do your sales pipeline stages look like?

How many do you have?

Are they working, does your pipeline tell you what you need to know?

If you’re like most sales organizations your pipeline stages are average. They do just enough for you to track sales, to manage opportunities and to provide a rough forecast. But, also like most sales organizations, when it comes to crunch time, when it comes to the end of the quarter, your pipeline fails you and you’ve missed  your number again. High or low, it doesn’t matter. If you miss your forecast substantially (high or low), you’re not doing your job as the sales leader and that’s because you don’t what’s happening inside your sales funnel.  A big culprit of this “blurry vision” — pipeline stages that are too big.

When pipeline stages are too big, it’s hard to know what’s going on.

When is a pipeline stage too big? When too many sales yes’s need to be achieved to get to the next stage, they’re too big. When too many sales actions and efforts are required or when the stages are wildly complex the stages are too big. When sales stages are too complex, when there is lots of activity, lots of moving parts, big sales stages become an abyss and it’s time to consider breaking them up. It’s almost impossible to accurately know what’s going on when a stage is too big and the result is an inaccurate forecast.

Slide2

Deals end up all over the place when a stage is too big!


When a stage is too big you don’t have the visibility needed to know where the deal actually is. It’s hard to know if it’s close to moving to the next stage or if it’s still in the beginning. The key is to avoid big stages and break them down in to more manageable stages.

A Good Pipeline Stage Size;

Start with the complexity. If there is a certain complexity in a stage such as a demo, or a trial, consider making the demo or trial it’s own stage. This way you can separate the impact and data results from the trial from the effort required to get a commitment to the trial and from the review phase. The key is to make sure there aren’t too many complex sales efforts in a single stage.

Also, consider length of time. If your sales cycle is a year long. Having a two sales stages that can take 5- 6 months each and two stages that can be done in a few weeks will cause you problems. Deals get stuck in a stage with little visibility and because the stages are naturally long, you don’t find out they are in trouble  until it’s too late.

Activity can also play a role. Like anything, the more parts that are involved, the more points of failure. Consider building sales stages that don’t require too many activities. If there is too much going on in a stage, too many activities that have to be accomplished, one trip up can slow everything to a halt and you may have no idea what the problem is.

Make sure stages align with the buyers journey, how your buyers’ buy. The best thing you can do is to break the sales cycle down so it aligns with the most important and impacting “YES’s” required from your buyers to get the sale. Each “yes” gets you closer and it’s more manageable. (this video breaks down the next “yes” concept.

Let me be clear. I’m not a fan of big, 10 stage pipelines. I personally prefer no more than 6, unless there is a compelling, justifiable reason. But, at the same time, a pipeline with only a few stages that allows deals to become lost or wallow for months, does you or your sales people no good.

Take a look at your current pipeline stages. Are they fluid. Do you find some take longer to move out of than others. Do you know your average “time in stage” data? Is it skewed to one or two stages?  It shouldn’t be. It doesn’t have to be equal, but if one or two of your stages is taking up the majority of the selling time, you have a stage problem and it’s affecting forecasting.

To improve forecasting, you need to know the flow-through rate of your opportunities from stage to stage. If one or two stages takes a long time to leave, rest assured you’re losing deals and slowing down the process.


This is the methodology I use to map sales cycles to pipeline. Check it out. 

ebook-real-sales-cycleDownload the ebook

17 Apr 14:43

How to Use Social Analytics to Improve Your Marketing Performance

by Steve Rayson

Big data is very much in vogue these days and social media networks are some of the largest sources of big data. There are literally billions of posts, interactions and shares which you can analyze. Buried in this social data are insights that can help you improve your marketing and give you the competitive edge. However, where do you start, what is relevant for your business? I wanted to take a practical look at how you can use social analytics to gain insights and improve your performance. To this end I have included expert tips from people working in social media and marketing

What Do We Want To Achieve And Hence What Should We Measure?

It can be costly and take a lot of time to analyze social data, so what are the benefits we are looking to achieve. Ultimately we want to use analytics to improve our social media marketing performance, this might include:

  • Improving audience reach (e.g. increasing followers, amplification of content to more people)
  • Positive feedback and praise (eg plus ones and sharing, which is a form of endorsement)
  • More engagement in conversations
  • Better understanding of our target audience
  • Converting people to customers (the key metric)
  • Doing better than our competitors

These objectives start to define the social data we need to analyze. This social data falls into three types namely:

  • Your own social data: how well are you doing and what can you learn
  • Your competitors’ social data: how well are they doing and what can you learn from them
  • Wider social data: what resonates with the target audience and what are the trends

Based on your analysis of what works you can build a social playbook, in essence a set of plays that based on your data drives the most engagement and conversions. This playbook should be a source of competitive edge, allowing you to move from data to insights to actionable tasks or plays.

1) Your Own Social Data Analytics

The easiest place to start is analyzing your own social media data. From this analysis you can work out what works best for you in terms of driving engagement and conversions. You can then develop for your social playbook examples of best practice. In simple terms find your strongest performing content, understand why it worked and make it easy for your teams to replicate it.

When reviewing your own social data you need to cover the following areas.

Reach (direct and amplified)

Reach is a combination of your own followers and the followers of the people that share your content, the people that amplify your content. Follower analysis is a reasonably straightforward task, you can use various tools to assess the number of followers on the different social networks and you can start to analyze the nature of these followers such as by region, by job role and by gender. Are your followers the followers you want, are they potential buyers and influencers. Tools like Twitonomy, Twtrland and Followerwonk work well for Twitter and Circlecount, Circloscope and Steady Demand work well for Google Plus. With these tools you track spikes in the number of your followers and assess what caused these increases.

In Google Plus you can use Ripples to see how a post was shared more widely and who helped amplify it. Unfortunately it is less straightforward to review who is sharing your content across all networks and to assess the degree of amplification. In BuzzSumo we have introduced a feature that allows you to see who has shared your content. You can start by doing a domain search for your content in BuzzSumo and then viewing sharers for each article. This allows you to then analyze the people that shared your content and their reach.

Our research shows, not surprisingly, a direct correlation between content shares and the number of influencers that share the content.

How to Use Social Analytics to Improve Your Marketing Performance image 18PuaWzNSiI w6wC5alNLK9w08D6iUxIAUX4PiChwKiTnpdIBHwMgU9fPRDAOA9GqBDuHk8UCCQkbe6KxcP5p8Okfm KhyS1ThRQ4ORZrKbHBJw7KzHDGF4WVd7iG8AzpQ

Positive feedback

Each network has its own way to allow people to promote or like content such as likes, plus ones, favorites and thumbs up on blogs. These built-in mechanisms are relatively easy to measure.

What is more valuable are positive comments or sentiment. Many of the monitoring tools recognize this and will keep track of positive sentiment. Thus tools such as Brandwatch, Bottlenose and others will provide you with data on sentiment and allow you to drill into this.

Content shares

Shares are are arguably more powerful than likes as the person is resharing the content to a wider audience. This can happen on some networks with a like or plus one depending upon personal settings but sharing is a powerful endorsement. On your own site you may have share buttons and counters so that you can see for an individual content item how it has been shared. It is much harder to see across all content and who shared the content. This is where you can use BuzzSumo. Just type in your domain and you will get the most shared content on your site. For any individual article you can click ‘view sharers’ to see who shared it.

Conversations

This is the direct engagement you have with people on social networks. It is harder to analyze but you can see the number of posts that receive comments and drill down into these discussions. As a general rule conversations and comments are good indicators of engagement.

Conversions

This is arguably the most important aspect to review to assess how well you are doing. A large number of followers is a vanity metric if it doesn’t lead to conversions. You can track clicks through from your links in your social posts as a starting point and with tools such as Oktopost you can monitor clicks through to landing pages and form completions. You can take things a lot further with Google analytics. You can track conversions based on traffic from social networks. You can define conversions relevant to your site such as a purchase or completed an enquiry form. In your CRM you can also track lead sources of conversions.

Summarizing your own social data

True Social Metrics is one tool that will help you pull all this data and analysis together. You can connect your various social pages and also connect your account to your Google Analytics to track conversions or economic value. Below is a sample report.

How to Use Social Analytics to Improve Your Marketing Performance image KYG 2zVaeWTCuLZE5VKIWvcu 1JYq1nPKhDB74EM5z3NFdezZEWCx6HxNNNPyCXvsVhinUy JAr8 7DFJ5Gyu MCo6IMqhKZ3Lx9HrHIrsyUECwCX c9yby4yXMyqs8How

Whilst averages are important, more important in my view are the actual figures for each post. True Social Metrics gives you this data and identifies your best posts which you can re-sort as follows:

How to Use Social Analytics to Improve Your Marketing Performance image FY5ELuSAWf6 2ItxgFPloSymMXT8Jmu2TYcvH6EKZMkVY8dU 0r5DNVFY7kgE5A359lsNl3t9dEynB5xdSd6fmGF63ecIK95p4Cm7KrcSu2lS5b4HU1rxBdy4DXmBAvDfA

Thus using True Social Metrics will give you a great starting point. However, I would suggest you aim to create a more detailed spreadsheet with the following data for your best posts:

Creating this spreadsheet will give you a great starting point in understanding and evidencing what works for you currently.

How to Use Social Analytics to Improve Your Marketing Performance image P5MKcJOd1Mya6GxXJBYFU8Gl owcleAs4dGw2MXyNL4nlNTvCjwHHZbX4CO dZUQW6qUXYCB3p41fIWh vmJFsLBtYoGTtT6 ajfFLzJqyCjeVCD2S pWtWUL RNKKfDZg

2) Analyzing Competitor Social Data

The analysis of your own social data is only one part of the story. Your competitors may actually be performing better than you, so analyze their performance. I think there are two areas to focus on in the absence of conversion data which are engagement and share data.

The good news is that a lot of the data is freely available. You can use free tools for example to review their Twitter or Google Plus performance. You can use tools like Twitonomy, Steady Demand or many others. Below is an example of a report from Twitonomy for Social Media Today and who they engage with.

How to Use Social Analytics to Improve Your Marketing Performance image wK6i1bHFyh RB4 57HZmYnlQncT8eVsyzp43BqdpFDPd5D1nOpg3gkAzqx7MxIa576utqDWuevN3 moLU8rtvOzy5uH3RHna6wJifx2tbcn5 G32DztPCdrzpD4 VvSIqA

With BuzzSumo’s advanced features, currently in beta, you can see the networks where a competitor gets most of their shares. In the case of Social Media Today the most productive network is Twitter and the content formats that get most shares are infographics and list posts as seen below.

How to Use Social Analytics to Improve Your Marketing Performance image 8kaOV0cMRNwk5qPRJOZpWjyIZl9R2YRpyw9Ug4M NOw4Q yttYfV4HA9S8MyaXLyia2RRLDEp9kqhF6s j RZU UJFQvJDG 69aPk5NhVGCj aZ ORqkOms Ndpv6LFHRg

In terms of timing I can also look at the total shares by the day an article was published. Monday is the best performing day for Social Media Today though interestingly the weekends still perform quite well.

How to Use Social Analytics to Improve Your Marketing Performance image sX9752Jhk8fFd0u0DMdGh FKirOXF9Wy7SXWCoUWyPqsdwx7nWgAB14gbOErrxswcxDA5wumiLrSWX91iiRzKaoHf4ohom3QKhryqnHQ7d4KtKK2wKl9JZYJibqHOneZkg

You also need to get behind the detail to look at individual posts and with the current version of BuzzSumo you can review their most shared content and who shared it. Simply type in their domain and search for their most shared posts in the last month. Below are the most shared SMT posts in the last month (nice to see one of my own at number 3).

How to Use Social Analytics to Improve Your Marketing Performance image evX9kY7zOr3sXSyfGnI1o1YZExSbtR42m XNtTa4P61Cum3Id8EYvqSfOmx r1oUrtjgwSBbxZGvfDUNehrgM3nTUXuUD3L7xtUIx9sGfN4nMrXt64svWakfVn8Oa0Dntg

You can take this analysis further to see who shared the content by clicking view sharers.

Hopefully, this will form of analysis will help you understand what is working for your competitors and identify where they perform better than you and why? You can then assess what can you do to improve your performance such as:

  • Put more focus on a different network
  • Use different content formats
  • Publish on different days
  • Reaching out to influencers

3) Analyzing Industry and Topic Data – Find What Works in your Area

The third form of social analytics data to review is for your industry or topic as a whole. From the analysis of your own social data and that of your competitors you will already have a good view on what networks are most used, which influencers amplify in these networks and the types of content that get traction. However, you also need to look at the wider picture.

You can undertake a Topsy search to see what is being discussed in your topic area on Twitter or use other tools to do this across multiple networks such as Brandwatch, Zuum or Bottlenose. You can also use a BuzzSumo search to find the most shared content for any topic areas across all social networks. This will help you understand what type of content and posts resonate with the audience.

You also need to pay attention to general trends and assess if they apply to your industry. For example, researchers for the NY Times discovered longer articles were more likely to be emailed than shorter articles. This is consistent with our own research at BuzzSumo which has found a direct correlation between the number of shares and the length of the article as shown below.

How to Use Social Analytics to Improve Your Marketing Performance image eZA2krK6Gh7 OMs4lDFGFkfHENKYhZ8By D70 iZfRuIcp1yGN60xIyity8ci4ydn 9YWDMkQxp3IP8djnODXa1y9 gFfgApLV98lpO l6pcGGJ4 NgxDkbh9lf7sgcquw

Maybe this opens up an opportunity to produce longer form content. There is also a lot of other general research on timings, frequency and content formats. For example, our research at BuzzSumo has found across all industries infographics perform best in terms of shares.

However, whilst you should be aware of these findings you should not blindly follow them but rather assess whether they apply to your industry.

Build your Social Playbook to Gain a Competitive Edge

Once you understand what works, based on hard data from these three areas of analysis, you can build a Social Playbook, by which I mean a set of best practice examples or plays which are proven to improve your performance.

For example, based on your evidence you can craft examples of posts that are more likely to get maximum engagement and a set of rules or guidelines for your teams to follow.

Steady Demand is a case in point, they analyzed hundreds of thousands of Google Plus posts and demonstrated that posts with three elements (of a certain content length, mentioned people and used a hashtag) consistently outperformed other posts. Below is a live example from their site.

How to Use Social Analytics to Improve Your Marketing Performance image RwIFjtM nhZQ YNe5X2VfnoUtI3hjxTHpC6mDAyDX7X8BLs7vzsL CidpcBqwzRxoD7 QfxIf0IoN uUuXoNFpMMCDNOrldpb1xsH11I5nl7sXZd19W0rcjvFJf0dDMrLw

Thus to gain maximum engagement on Google Plus you might be advised to include these three elements.

You need to build a set of plays that work for you in your area. These will address such things as timing and frequency, content formats on certain networks and key influencers on specific networks to engage with. I think it is also useful to build exemplar posts which act as guides for each of the main networks. What better way to onboard a new member of your team than to show them what works. This is not to rule out experimentation but just to ensure the playbook is based on evidence from your social analytics.

Andrew Darling, Director of Global Marketing at TBG, believes harnessing data from social media is now a key task and “being able to gain insight from this data is becoming a secret weapon for marketers.” I agree completely with this assessment. Social analytics can provide insights which you can translate into guidelines and action to give you the competitive edge in your marketing.

Social Analytics Tips from the Experts

I was keen to make this post practical so I reviewed some of the best posts in this area and asked some of the experts in the field for their tips.

David Somerville, Head of Social Media at Fresh Egg sets out three key analytics tasks:

“Ensure you measure the effectiveness of each individual post you make (via each platform), so you can see what is working and what’s not. Measure the engagement levels (likes, shares, favourites etc) for each post then look for any patterns – for example, do your photos always get better engagement, what hashtags are working etc.”

“Ensure your goals are set-up correctly within Google Analytics to track your conversions. By tracking your macro conversions (sales) and micro conversions (email sign-ups, information requests etc) then you can better report on how social media referral traffic is contributing to conversions on site, both last click and attributed ones.”

“Use event tracking on your on-site active and passive social media buttons, so you can then measure their usage within Google Analytics. This is especially useful if you want to test the placement of active social media buttons on a page or see how many people are visiting your site and then going to your social media networks.”

Joseph Parker, Senior Media Outreach Specialist at Digital Relevance believes “the key to successful social campaigns is the research that goes into verifying that those you connect with represent the audience that are likely to convert. Define ‘conversion’ at the onset, and use that as your guide.” Joseph also recommends you use Google Analytics as an “outline” for defining conversions that can be tracked.

Joseph adds once you find key influencers have a good look at who they are following. This could lead you to similar individuals who wield more influence. Joe recommends tool such as Socialbro and Followerwonk to analyze your current Twitter followers and your targeted followers.

Leo Widrich co-founder and COO at Buffer provided a really useful tip in a recent post when he pointed out that almost any report inside Google Analytics can be created as an email report and sent to you in a variety of forms—csv, excel, pdf. He receives his in the form of pdfs. To create an email report just click the Email button near the top of your desired report. The button should be immediately below the report name and next to buttons for exporting and adding reports to your dashboard.

Robin Colner, a digital marketing professional at Digistar Media has pointed out the importance of being able to track links in your posts. “Capturing data on the activity associated with links shared by use of a link shortener is one of the most important data sets to analyze.”

Jennita Sable Lopez from Moz outlined in a post recently on how they analyse their social performance. Using various tools they grab data from various channels and collate this into a spreadsheet as follows.

How to Use Social Analytics to Improve Your Marketing Performance image HtohBXwZOIweGBLasVWpbKhdU8TMkGxvSGwuw1 VuHEogX6E3tSVIKN6hHkdYfzCUC z 05qN74FHF7Jey73u0hkf2Sm3r2pffqdiRL8bQUAfzLBI ZiSj GNuwccbsDfA

Mari Smith, a Facebook marketing expert, recently shared her advice on the 5 key metrics to assess in relation to Facebook posts namely:

  • Frequency: How frequently you post both daily and weekly
  • Timing: What days you post and what times
  • Content type: Articles, videos, images, questions or lists
  • Length: Check what length works for your posts
  • Tags: Do certain tags drive more engagement and conversions

Jeff Riddall at gShiftlabs advises you to look at wider trends beyond your content to know what the customer is looking for across the spectrum – search, local, mobile and social. He advises you to “identify and focus on keywords and content for which you already have momentum – then create optimized content based on these first.” Testing keyword performance and conducting keyword research (including via social channels) regularly is key in his view. I particularly liked Jeff’s advice to “build a rhythm of execution”, it is not about a one-off exercise.

Lauren Mikov, social media consultant and fellow SMT contributor advises you to back up your analytics with in-person data (if that is relevant to the business.) “Often I find that people get so hung up on their data that they forget to track conversions ‘IRL.’ It can be awkward at first to ask “how did you find us?” on the phone or in person, but it can quickly become a habit and give you a concrete way to measure the success of your social campaigns.”

Valentin Boulan at Tamar UK believes in analyzing which social channel is driving most traffic, conversions and revenue to your site, and identifying the strengths and weaknesses for each channel (which is best to drive traffic, organise new competitions, promote new product, etc.)

His advice is to “find who your most active social media followers are – only 4.7% of your following is what drive 100% of your social referrals.”

17 Apr 14:42

Five ways listening to social data can help your business

by Sam Oakley

It's broadly accepted that social media data contains a wealth of potentially game-changing insights.

It's also broadly accepted that getting to those insights is nigh-on impossible without having access to data scientists and huge budgets.

I'd argue that the latter is no longer true, here's why...

Put your hand up if you’ve ever been in this situation: You’re down the pub and you just cranked out one of your top three stories, everyone laughs and then the guy, who you hardly know, pipes up with “It’s funny that, because I once…”

He goes on to tell a story that has nothing to do with what you were just talking about but it’s funny enough and no-one seems to mind the blatant hi-jack that’s just taken place. Except you.

The story he’s just told is proof that he was never listening in the first place, just waiting to talk, it says “I’m not interested in you, I just want the attention of the people around you.” It’s a broken conversation.

Unfortunately it’s all too common an analogy in terms of the way brands engage with people through social media.

Take Habitat’s spamming of totally irrelevant #tags last year as a particularly extreme example but there are others, many others.

Of the brands we speak to very few can tell us what matters to their audience at any given time – and if you don’t know what things your audience cares about, how do you expect to be one of them?

Don’t get me wrong, it’s not easy for brands to be relevant to lots of people, at the same time, all the time, but our research shows very strongly that there are a few quick(ish) ways of making a big difference:

Listen for people talking about themselves, not just when they talk about you

If you’re only listening to what people say about you (selective hearing) then you’re only scratching the surface of the value that social data can provide.

Knowing what people think of you can be interesting, but as a marketer that will rarely affect how you deliver the campaign in front of you.

However, knowing what websites your customers really like, or what videos they shared, or what TV shows they watch is likely to be more valuable. 

Use your resources to create things people care about, use social data to work out how

Understanding what role you can play in your customers’ social space is key to being a good listener. 

In most cases this ends up as a mixture between curating content from elsewhere and creating original pieces. Either way if you’re doing this based on gut instinct then you’re missing a huge opportunity.

We ran a few early tests by simply taking the YouTube videos shared by a group of people on Twitter who all shared a common interest, then copying the tags from those videos into a spread-sheet. After about half an hour of work some very clear patterns started to emerge.

Understand your community and reach your audience’s audience

Someone doesn’t have to have a million followers on Twitter to be an influencer. If you look at the people who make up your community on Twitter (for example), you will quickly see that some people are more networked / more active than others.

Just as a good listener in a conversation listens to more than just the words being said (you read body language, read the room etc…), listening to, and coming to understand the makeup of your community is crucial to having constructive conversations with it.

I find a free tool called twiangulate quite useful in doing this over small numbers of people. The point is that by understanding the way your community is connected to each other you can isolate groups and individual who will give you access to far larger audiences.

Isolating these people allows you to be far more specific in how you create and curate content.

Test your hypotheses. Who will define your next campaign?

You’re launching a new product. You have a good idea of the target audience but outside of the focus groups, you have no real large scale information about who will end up being the early adopters and superfans that any new product needs if it’s going to hit the mainstream.

Social listening can play a huge role in helping you build out this picture during the early stages of a campaign, allowing you to tweak messages / change how you’re working with content and be more relevant to the people you want to engage with.

Check out free tools like twtrland as a starter for this.

Demonstrate value from social and make it work on other people’s terms.

Getting of the above done takes both time and resource, and to commit that, you’ll need to prove value.

I’m not going to get into the debate around the ROI of social media here, rather just share a few thoughts around sidestepping the whole debate around what is / isn’t a valid metric.

Using social data as just a new kind of consumer insight can make it quite easy to build a business case without having to prove the value of a Twitter follower or Facebook like.

So, for example if you know that your community likes certain kinds of YouTube videos, then sharing that data with the PPC team can (and in my experience almost always does), open up new opportunities.

Similarly, sharing socially collected data about what sites your audiences like with media buyers or info about influencers with PR teams can generate real improvements in those channels’ performance.

If you can improve the performance of a channel where there is an accepted ROI framework, then you don’t even need to engage in the debate.

The ROI simply becomes the extent to which it makes all the other channels more effective.

None of these challenges are easy to address but as traditional (and digital) media channels fragment further it will only get more important that brands start to change the way they approach social media.

Broken conversations are a waste of time and money and, with relatively limited resources, they don’t need to happen.

17 Apr 14:42

How Influence Drives The New Buyer’s Journey

by Dan Newman

By this point it is safe to say the buyer’s journey has changed. Consumers do more of their own research, and they engage with more content to support their decision-making. In fact the numbers look something like this:

  • 70-90% of the buyers journey is complete prior to engaging a vendor (Forrester)
  • Consumer engages with 11.4 pieces of content prior to making a purchase (Forrester)
  • Consumers are 5x more dependent on content than they were 5 years ago. (Nielsen)

So we know the information pool is tremendous and consumers are picking and choosing content to support their purchase requirements, but this raises another question that may be the key to businesses unlocking the power of content:

Why are consumers choosing certain articles over others?

With literally hundreds of pieces of expert, brand and user generated content being published to the internet at any given minute, online consumers have more than just information asymmetry, they have information overload which means they need a way to find the signal through the noise.

On March 25, Inpowered, a company that focuses on the new influence-marketing category released a study that they deployed the resources of Nielsen to perform. The goal of the study was to determine which type of content was most instrumental at various purchase stages of the consumer journey in terms of driving a purchase decision.

In this study Nielsen looked at the three different types of content mentioned above to determine which was most impactful in the buyer’s journey across the three best known stages defined as brand familiarity, brand affinity and purchase intent. Here is a brief rundown of the three types as defined in this study.

  1. Expert Content (3rd Party Content which they defined as credible)
  2. Brand Content (from the brand or brand employees)
  3. User-Generated (Reviews such as Yelp or Amazon)

What Did The Study Find In Terms Of Contents’ Impact on Influencing a Purchase?

If I ever sought to find a study that validated influence marketing (consider the source) this would be the one.

While all three types of contents showed some uplift for the consumer at various points in the sales process, expert generated content proved to be the most effective for giving brands improved sentiment across all three phases of the buyers journey. The results in simplest form across the various stages of the buyer’s journey read like this.

Brand Awareness: Expert content had an 88% greater impact than brand content and 50% better than user generated reviews.

Brand Affinity: Expert content had a 50% greater impact than brand content and a 20% better response than user reviews.

Purchase Intent: Expert content lifted intent over brand content by 38% and 83% over user reviews.

Influence Particularly Powerful At The Onset And At The Point Of Purchase

The study without a doubt revealed the strength of expert generated (influencer) content, but if you read between the lines I believe a stronger correlation can be found. This is in the relationship between the experts and the buying cycle vs. other types of content. Here are my observations.

  1. Experts are critical at the onset of a purchase cycle. Since readers trust this group their content often introduces new products and services to readers who may otherwise not be aware.
  2. Brand content becomes more powerful the further you get into the sales cycle. While expert content is always preferred, likely for its neutrality, as customers become closer to buying they tend to gravitate toward greater trust in a brand delivered message.
  3. Influencers (experts) are far and away the most trusted at the point of sale. Many tend to think reviews can deter purchased but it appears that once a buyer is close to making a purchase they are more willing to overlook negative reviews.

As content continues to become more and more intimately part of the buyer’s journey, brands will continue to need to find the right-mix of influencer (expert) and brand content. Of course more content generally offers more potential visibility, it is more important that brands place content that buyers will trust in front of them at the right time in the cycle.

17 Apr 14:41

How is Performance Marketing Beneficial?

by Chitraparna Sinha

The performance marketing industry has evolved from affiliate marketing. Do not confuse it with affiliate marketing per se. Performance marketing is a good way to begin earning online either as a publisher or a merchant.

In performance marketing, there is a mutually beneficial business model for merchant partners and website publishers, no matter whether they are in the relationship through affiliate partnership or through direct connectivity.

Performance Marketing

In this business model, the job of the publishers is to drive traffic to the website of the merchant partner and the publisher is paid according to its agreement with the merchant, which includes sales, referrals and/or leads.

Role of Performance Marketing in Publishing

Performance Publishing is the vertical branch of performance marketing where websites are created with the purpose of selling the services and products of other companies.

Here the publishers are paid only for completed transactions, which is unlike CPM (cost-per-impression) or PPC (pay-per-click) models where publishers were paid for per impression and click basis.

Why is this better?

This is definitely better than traditional affiliate marketing because here there is no scope for seeing inflated or misleading clicks and impressions. A merchant won’t get too elated seeing 10,000 impressions or clicks for a product or service, knowing that there are no sales.

You would agree that performance marketing refines the affiliate industry in a better fashion.

As a publisher:

  • You create product / service oriented content.
  • You promote the content to targeted markets.
  • You generate complete sales.
  • You get PAID.

As a merchant:

  • You don’t waste money on CPM or PPC.
  • You have a clear idea about the number of sales publishers are generating.
  • You just pay the pre-agreed commissions after each sale.
  • There is no waste of money.

In short -

 publishers SELL + merchants EARN = publishers EARN as well

Have you tried performance marketing?


Copyright © 2014 Blogging Tips. This Feed is for personal non-commercial use only. If you are not reading this material in your news aggregator, the site you are looking at is guilty of copyright infringement. Please contact us so we can take legal action immediately.

The post How is Performance Marketing Beneficial? appeared first on Blogging Tips.

17 Apr 14:39

5 Social Media Skills Millennials Lack

by Ryan Holmes

This blog post originally appeared in Fortune. View the original here.

They’re the generation brought up on Facebook. Some have never known a world without the Internet. The innermost details of their lives have been exhaustively Instagrammed, and they get their news from Twitter, not TV.

But when it comes to using social media at work, millennials — the generation whose birth years can range anywhere from 1980 and 2000 — can be surprisingly, even dangerously, unprepared. “Because somebody grows up being a social media native, it doesn’t make them an expert in using social media at work,” says William Ward, professor of social media at Syracuse University’s S.I. Newhouse School of Public Communications. “That’s like saying, ‘I grew up with a fax machine, so that makes me an expert in business.’”

According to Ward, who has 13,500 Twitter followers and teaches a series of popular undergraduate and graduate courses on social media at the university, millennials are lacking in a number of critical areas. While they’re very good at connecting with people they already know, they often fail to understand the professional opportunities and pitfalls posed by networks like Twitter (TWTR), Facebook (FB), LinkedIn (LNKD), and Instagram.

Combined with some of the other predispositions of Generation Me – idealism, entitlement, a need for instant gratification, and recognition — this can be a recipe for trouble. “Companies hire millennials because they think they’re good at social media. Then their bosses discover they don’t have those skills and get frustrated,” Ward says, noting that social media expectations are often higher for millennials than for older workers, who may be just as inept.

For students and recent grads entering the workforce, some social media 101 is definitely in order. In particular, career-minded millennials desperately need to brush up on these five social media skills:

Knowing when to hit the bleep button

Last September, Business Insider attracted attention for firing its chief technology officer, Pax Dickinson, because of comments he made on his personal Twitter account. While Dickinson’s Tweets on women and minorities were especially offensive, the situation hints at a larger issue. Millennials sometimes fail to appreciate that personal profiles can have professional repercussions. Twitter, Facebook, and other networks are largely public platforms; comments made can — and often do — get back to bosses. As the Dickinson case shows, few employers are eager to associate themselves with off-color or offensive content, even when it may be intended as a joke.

Using social media to actually save time

According to a 2013 Salary.com survey, the most frequently visited personal website at work is — you guessed it — Facebook. As networks proliferate — and millennial employees not only check Facebook but also post on Twitter and browse Instagram and more — social media has the potential to be a devastating time-suck. Yet it can also be a time saver in the office. A recent McKinsey report notes that social media has the potential to save companies $1.3 trillion, largely owing to improvements in intra-office collaboration. Internal social networks like Yammer enable employees to form virtual work groups and communicate on message boards. Instead of endless back-and-forths on email, co-workers can post and reply in continually updated streams. None of this is revolutionary, but millennials are often still in the dark on ways Facebook-like innovations are being taken behind the firewall.

Understanding how to crunch the numbers

While millennials often have an intuitive understanding of what resonates on social channels (hard to go wrong with cat GIFs), quantifying what works and what doesn’t is another matter. Should the success of a Twitter campaign be measured on the basis of re-tweets, mentions, replies, referral traffic, or sales leads? What are the best times of day to post on Facebook, and what is the optimum post frequency? Which analytical tools are best for crunching the numbers? While social media is about authentic human interaction, it’s also an arena where data can easily be collected and applied to improve results. Knowing what data to look for, where to find it, and what to do with it separates real experts from mere social natives.

Mastering the multi-network shuffle

It’s one thing to be a Twitter guru or have a huge LinkedIn following. The real talent lies in orchestrating different platforms to work together and in understanding the niche each fills. Visual networks like Instagram and YouTube, for instance, are increasingly the foundation of campaigns by social-savvy brands like Nike (NKE), Red Bull, and Mercedes. Catchy images and videos are, in turn, seeded onto traditional text-based networks like Twitter and Facebook. From there, links lead viewers back to blogs and company pages, sending customers spiraling deeper into the sales funnel. Meanwhile, uniform hashtags across platforms help unify and track the overall campaign. Even millennials with deep social credentials often fail to understand the profound multiplying effects of integrating different networks.

Networking professionally on social media

By the time millennials graduate from college, many have dutifully filled their LinkedIn profiles with part-time positions, internships, extracurriculars and academic accomplishments. But the network’s true job-finding power is often overlooked: Hiring managers and CEOs who would normally be out of reach are often just a connection or two away. In fact, you don’t need to be connected at all. A paid feature called InMail, for instance, enables users to send emails directly to any one of LinkedIn’s 277 million members. Truly enterprising job seekers can hunt down big fish like Richard Branson, Bill Gates, and Deepak Chopra, then send a pitch straight to their inbox. Notoriously footloose millennials — forever in search of the next job opportunity – might well take this tip to heart when searching for greener professional pastures.

Of course, amassing these skills is no short order, and millennials aren’t the only offenders. “The real problem is that we expect people to know these skills without providing any training,” social media professor Ward says. As the number of social networks expands and platforms are used in more sophisticated ways, it’s unreasonable to expect anyone — even the most plugged-in users — to just intuitively get it.

For millennials competing in a tight market, these skills — unheard of just a decade ago — can mean the difference in finding and keeping a job. “Students using digital and social media professionally in an integrated and strategic way … have an advantage,” Ward says. “[They're] getting better jobs and better internships …”

17 Apr 14:39

Dirty Database? Clean It Up with Inbound Marketing.

by Dan Stasiewski

Dirty Database? Clean It Up with Inbound Marketing. image hurdle launching inbound strategy

One of the biggest hurdles to launching an inbound strategy for most companies is the existing database of leads. Many of the leads have been accumulated over the years and remained uncontacted except for the occasional sales email, enewsletter blast or tradeshow invite. With a database like that, it’s no wonder marketers who plan to make an investment in marketing software want to make sure they have the right list before they launch.

But saying you need to clean your database before you go inbound is like saying you need to organize your personal contact list before sending messages. It’s not a best practice; it’s a stall tactic. With the right inbound marketing strategy, some contacts will immediately engage with your brand. Other contacts will re-engage over time. Still others will never take action on your inbound marketing activity. This is true for a clean database or a messy one.

The difference between launching with inbound now and waiting until you’re confident your database is in the right place for it is simple: The former will acquire new better leads more quickly while the later makes you work with the same old bad leads you’ve always had.

Making Inbound Clean Your Database For You

We recently started working with a client who, over the years, gained leads through tradeshows and purchased lists. This particular client acknowledged their database wasn’t up to snuff when it comes to having the right contacts and the right information about those contacts. They had even worked with a marketing automation platform in the past that didn’t do anything to improve their list because it was simply used for drip sales emails.

Rather than delay the launch of a full-scale inbound marketing program, this client asked us to help them implement a content marketing, demand generation and automation program that would move the needle immediately. With more than 13,000 contacts, little confidence in the quality of the data and incomplete intelligence, the five-month-old program has whittled down its list of inactive contacts to just over 5,000, while gaining more intelligence on the reactivated leads and generating more than 650 new leads.

How did they do it? The simple answer is they didn’t wait to make sure their database was in the right order before sending that first educational guide to their list. And they followed that first guide with additional educational offers that asked new questions on forms through progressive profiling. At the same time, they promoted their educational offers through blog posts, social media updates and social advertising platforms in order to gain new leads. They went all in for inbound without hesitating—and it paid off.

Gaining New Insights Over Time with Inbound

One of the biggest benefits of this client’s launch into inbound is that, by asking the right questions on landing page forms for educational offers, they were able to update their database with the latest information on many of their existing contacts. Some people changed companies. Others changed titles. Still others were replaced by new people who became leads.

More importantly, these contacts that either converted or simply engaged had their activity recorded. This meant we could begin the process of scoring the existing leads to determine if they were actually the contacts the client’s sales team should get in touch with. Visiting the pricing page or downloading a case study indicated the contact was moving closer to being a sales-ready lead. Plus, new information provided by contacts as they filled out additional forms could help shape sales conversations once the lead initiated sales contact.

Sifting through their database to ensure existing data integrity or verifying contact information would have only slowed down these quick but important wins from inbound marketing.

A Simple Cleaning Solution You Can Take Now

If you’re still not confident with your list or simply want to ensure email deliverability before you start sending email blasts to contacts in your database, there is one some simple cleaning solution that does make sense before you launch into inbound: Email validation. (Full disclosure: Our agency does work with a client that provides email validation services.)

Having your list validated prior to sending that first email from your marketing software can save you from receiving a scary notice from your ESP that your bounce rate is too high. Since the process usually only takes a few business days at most, it can also quickly help you gain internal buy-in when you let others know you’ve done some cleanup work before that first email goes out.

Most database issues will be solved overtime through frequent communication with your contacts through various inbound marketing activities. So if you’re concerned about your database, the best thing you can do is start inbound marketing—the longer you wait the more stale that old database will become.

Dirty Database? Clean It Up with Inbound Marketing. image 943fda88 a56b 42fe 99b0 5cbd89de5949

17 Apr 14:39

How to Tell a Consistent Story Across All of Your B2B Marketing Channels

by Rachel Foster

How to Tell a Consistent Story Across All of Your B2B Marketing Channels image iStock 000016359347 Medium

Multimedia is big in B2B.

According to the 2014 B2B Content Marketing Benchmarks, Budgets and Trends – North America report, B2B marketers are using a variety of media types. The top 10 B2B content marketing tactics include online presentations, white papers, videos, case studies, social media, blog posts and more.

If you are experimenting with new tactics, it can become hard to tell your story across all of your channels. The more tactics you have – and the more people who are creating content for you – the harder it is to keep your message consistent.

However, telling a consistent story is vital if you want to raise brand awareness, attract high-quality leads and convert them into customers. The TechTarget Media Consumption Research Brief revealed that 65% of B2B technology buyers review at least four pieces of content before they make a shortlist of vendors. If a buyer sees four pieces of your content – with four unrelated messages – the buyer won’t be able to understand your value or make a business case for your products or services.

Here are four ways you can tell a consistent story across all of your B2B channels:

1. Think of your audience first and your channel second.

You can create amazing ebooks, videos and social content, but if your target audience doesn’t think it’s relevant, you’re wasting your time and resources. TechTarget found that “media is only effective if the information that it features is relevant to their research and is helpful for them during the process.” If your content isn’t relevant, your buyers will search your competitors’ content until they find what they are looking for.

2. Stay focused on your long-term business goals.

Many B2B marketers don’t think about their overarching goals when they create content. They often get caught up in short-term planning (e.g. promoting an upcoming webinar) but fail to think about driving business in the long term.

If one of your goals is to attract more high-quality leads and convert them into customers, then your messaging should focus on moving customers through your sales cycle. Each piece of content should lead customers to another related piece of content where you expand on your story and work on gaining their trust.

3. Create content guidelines.

If multiple people contribute to your blog or other content marketing efforts, then you must create and enforce a style guide. The guide can outline:

Information about your target audience, so contributors will keep your ideal readers in mind when they create content

    • Your desired tone
    • What topics you will and won’t consider
    • Blog post length specifications
    • Tips on formatting content for easy reading
    • Information on how to submit content to your editorial team or content marketing manager

4. Hire a content marketing manager.

Your content marketing manager will ensure that all of your content tells a consistent story and helps you reach your business goals. They are skilled at planning content strategies and developing editorial calendars. They will also work with your contributors to ensure that every piece of content meets your standards.

If you want customers to follow your story across multiple channels, you must think of the story first and the channel second. For example, don’t rush to the latest social network if you don’t know your story. This will just create confusion. Instead, use the tips outlined above to get a clear sense of your target audience and your message. This will help you to better engage customers and move them through your sales cycle.

17 Apr 14:39

What Has Fishing and Lead Generation Got In Common?

by Sprout Traffic

What Has Fishing and Lead Generation Got In Common? image fishingforleads1I have never been good at fishing and the times I tried to fish I never had much success. The one fish I did catch wasn’t big enough and I had to put it back, I then ended up getting irritated with the midges (little flies in Scotland), so I gave up and went home. It got me thinking of an analogy that fishing and lead generation have a lot in common.

Catching a shark

If you are shark fishing, you need various tools and resources such as a good rod, a big boat and some other people/friends to help out. Much like if your business was to land a big customer (a shark) they will need some good tools (software, great content, inbound website) and resources (a team of people and premises). When you have all the right things, then you have a better chance of being successful. If you are lucky and you manage to catch a shark with your fishing rod and small boat, then you may end up getting bitten by the big shark as you cannot handle it.

Fishing in the wrong pond

If you are fishing in the wrong pond, you will usually get the wrong fish or no fish at all. If you want some salmon and you are fishing in a pond of carp you will not get salmon. Similarly, if you promote your marketing messages in the wrong areas such as LinkedIn groups with the wrong audience, have the wrong social media followers on Twitter, using the wrong keywords in your PPC or search campaigns, then it will result on you not attracting the right catch and not generating the right type of leads.

Using the right type of bait when fishing

The analogy here is the bait is your marketing message – if you are using the wrong type of bait you will attract the wrong type of fish. If you have not worked out who your personas are and use the wrong messaging (which affects SEO terms, content) then you will attract a lead that is not right for your business.

Just get your fish from the fisherman

Fisherman. They use big nets, which in marketing can be website and the right messaging. They have the experience and know where the fish are in the sea. With their big net and knowledge of the area they catch a lot of fish and sell them. The analogy here is you hire a marketing specialist agency, like Sprout Traffic, to generate you the marketing leads that right for your business.

So if your marketing is like my fishing (who doesn’t know how to fish and has failed at catching fish except the really small ones that I had to put back) you will struggle in marketing and feel like you are spending a lot of time being busy without much success.

Finally, you know the midges that bothered me when fishing. The analogy there is they are the sales guys or your managing director that are moaning at you for not giving them leads.

If you want to get started on the first step to catching the right fish, download our essential guide to creating your buyer persona.

What Has Fishing and Lead Generation Got In Common? image creating a buyer persona1

17 Apr 14:38

She Went To A Social Selling Workshop and You Won’t Believe What Happened Next

by Andrew Jenkins

She Went To A Social Selling Workshop and You Won’t Believe What Happened Next image iStock 000009437077Small

Some say that it takes 21 days to form a habit; others argue that is a myth. A recent study by the European Journal of Social Psychology has actually dispelled that myth. The study found that, on average, it takes people 66 days to form a habit. In fact, those studied took anywhere from 18 to 254 days to form a habit—quite a discrepancy from the popular notion of 21 days.

Why all the talk about habits? I will explain, but let me ask a question. How many of you have taken part in one-day training or workshop sessions? You get all worked up with new ideas, new methods, and new tools, and then you go back to work and gradually the interest you developed dissipates, either because of existing work pressures that preclude your ability to use your newfound expertise or because the need or opportunity does not present itself as urgently or frequently as expected.

This problem is common with many training and workshop situations. I know a systems analyst whose employer sent her for expensive training that was required for impending projects. Unfortunately, when she returned to work the project was repeatedly delayed and her newfound capabilities waned. When the project finally launched, she was in panic mode trying to relearn what she’d been taught.

I have seen and experienced the same with sales training. Without ongoing practice and performance measurement, it’s hard to make things stick and ultimately become habit. That’s what I want to discuss here: forming a social selling habit.

I want to be fully transparent. ArCompany and I offer social selling workshops to salespeople and marketers in a variety of industry sectors. However, we do not stop there. If I was a personal trainer, I would not have turned you into a specimen of physical fitness just by giving you a tour of the gym. The same applies to social selling workshops.

The most we can accomplish is exposing participants to new tools, methods, and thinking. It is only through consistent effort and application of what they learned, along with ongoing review and measurement, that the learning becomes ingrained. Ultimately, we are not teaching about tools or technology. We teach so that participants will adopt a new social selling mindset that becomes second nature to them.

I teach entrepreneurship and business model design at OCAD University. We use a number of frameworks in the course but we workshop them numerous times throughout a semester (note, more than 21 days). I take my students from simple models to more complex ones by layering on other factors and attributes to the situation being examined. The initial exposure to the frameworks lays the groundwork and then workshops over the course of the semester serve as practice. What is really rewarding is hearing from my students after they have finished the course that they have continued to apply what they learned and have been successful in doing so; that they use the framework more intuitively—dare I say, habitually.

We hear the same from those we teach about social selling. We know that an afternoon or even a full day’s exposure to our curriculum does not compare to ongoing effort. We take great pride in hearing about their successes and seeing their online presence grow and flourish.

So if you hear people dismissing the idea of a social selling workshop or training session, ask them to clarify what they mean. Are they against workshops and/or training because of their poor track record as one-offs? Or are they like us, championing ongoing social selling development programs?

If a company or individuals take what they are exposed to in the initial social selling session and participate in an ongoing program that sets goals and tracks performance, their social selling capabilities have greater likelihood of becoming habitual and achieving permanence.

It is all well and good to teach someone how to optimize their LinkedIn profile and use LinkedIn for prospecting, but those insights become more powerful if associated goals are developed and pursued. Performance metrics could include such things as network growth, funnel growth, developing prospects into qualified leads, account penetration, InMail open rates, Inmails to Calls/Meetings conversion rates, and, most importantly, closed sales resulting from social selling efforts.

So I was being a bit facetious with my title. Many times people have participated in social selling workshops, webinars, or training sessions, and when they left and returned to work they fell back into their old habits. They claimed that they didn’t have time to adopt everything that they learned. They picked and chose what they wanted to adopt from what they learned, but without accountability, ongoing practice, and measurement, the prospect of them become successful social sellers was unlikely, possibly even doomed.

In order to be a successful social seller, a person needs to go back to work after that first workshop and map out a plan either on their own, with colleagues, or with support from specialists like ArCompany (yes, I was selling there). Like the aforementioned personal trainer example, people are more successful adopting new habits and achieving goals by stating them publicly and having accountability built into it.

We would love to hear from people who have adopted social selling. How has it gone for you? We would like to hear what has worked and/or what you found to be hard about forming the habit. Provided you are comfortable, we would love to hear from those who tried and gave up or simply didn’t achieve the goals they set out to pursue. What prompted you to abandon the pursuit? What obstacles stood in the way of your success? Maybe there is still an opportunity to turn things around, even gradually.

Drop us a line and let’s chat.

17 Apr 14:37

Social Media Lead Generation: Opening the Gate for Gated Content

by Anqi Cong

Gated content is a term that isn’t heard very often, but everyone knows what it is. For instance, think of Pardot’s whitepaper download form: it asks for your name, company, and email before it allows you a copy of their whitepaper. The key here, of course, is obtaining your email, an easy and surefire way to contact you with further demonstration proposals and sales promotions. Annoying but effective, the tactic of gated content offers a quality piece of content in exchange for a little bit of contact information. Its usefulness to marketers and simplicity to implement has made it a staple of lead generation.

However, the tactic of gating content is two-sided. On one hand, it’s effective for revealing the names of previously anonymous people on the other side of the screen and providing a bit of preliminary information on their interests. On the other, it’s estimated that gating content reduces downloads to an incredible 2-5% of what they could’ve been.

As with all marketing decisions, there’s a tradeoff to be made when deciding whether or not to gate content.

Social Media Lead Generation: Opening the Gate for Gated Content image Screenshot 2014 04 08 23.55.54

Whitepapers are almost always gated content, but the people who download them are genuinely interested in the topic.

Suppose you do decide to gate your content. You cut your downloads, the visibility of your content, and how much it’s going to be shared. How are you going to make up for the lost leads?

First, keep in mind that the leads that you gather from gated content are likely to be of higher quality, because these people have overcome a barrier (albeit a small barrier) to obtain something of interest to them, thus proving the extent of their interest.

But what about a proactive way to promote these?

Social media proves itself to be an effective channel of distribution for gated content. Twitter is especially conducive to this purpose. If your short, Twitterified hook catches their attention and manages to get them to click, it’s more likely that they will go through with the form on the download page. Intuitively, it makes sense that anyone who clicks the link has already decided that they want to view the content, and as long as the form is not tedious or intrusive enough to turn them away, it is likely that they will go through with it.

However, gated content tends to be less “viral” on social media. This is a direct function of the smaller number of people who will read the content, which is all the more reason to promote the content more heavily through social media.

Of course, there are always people who will bounce at the last minute. Any one of many reasons could explain this behavior. It’s easy to get greedy and go overboard on gating content, and just as easy to go in the opposite direction, not gating enough and ending up with too few contacts.

What are your tips on how to strike a balance between gated and non-gated content?

17 Apr 14:36

SEO and Your Inbound Marketing Strategy – Part 2

by Jeff Evans

Optimizing Your Content and Social Media Efforts

SEO and Your Inbound Marketing Strategy   Part 2 image IMA seo 2 header imageInbound experts agree that SEO is a vital component of the entire marketing process. In our last article we examined how to optimize your inbound program before you ever even write your first word.

Things like site organization, key word planning and creating buyer personas are all part of inbound and include SEO in order to work.

In this installment of SEO for inbound, we will be considering how SEO affects your inbound efforts once you start writing content for your website.

Your blog, your messages on social media and things like your landing pages and call-to-action pages each have a role in your inbound program and without SEO will not drive traffic to your site. In addition, let’s take an intense look at how SEO and your content process affects lead generation.

CONTENT MARKETING

An entire science has evolved around creating content within your inbound strategy. Good marketing skills involve creating content for your blog, as well as different content with special types of visuals and wording for an offer. Then there is action language that pulls a qualified lead through the conversion part of the funnel with a CTA or an email.

Content is what makes inbound exciting and captivating for both your visitor and search engines. It is where your company can begin to bring in and nurture leads to buy what you have sell.

Using keywords as well as a mixture of psychology and methodology for each stage of your buying process is what makes the heart of a marketing expert beat fast and furious. As we stated in our first article on SEO and inbound, there are several points of view on what makes up the lead nurturing process. For argument’s sake, we are going to begin with the offer.

The Offer

Considered the beginning of the buying process by many, the offer attracts a visitor to your website. Maybe they were brought to your site by an email promising a download, or a social media message promoting a checklist.

The offer must contain something of value and is different for each stage of the lead nurturing process.

Would you like to buy a widget?

TOP OF THE FUNNEL OFFERS

A first time visitor to your site who has been attracted there by your offer is usually in the research stage of the buying process. They are not ready to make a purchase. In fact, 98% of users who visit your site are never going to come back, much less give you their personal information.

The offer that a visitor receives at the top of the funnel should be mostly informational or educational, as well as concentrate on your industry as a whole. This is not a good time to point out the advantages of your product and price points.

For example, if you are selling widgets, a top of the funnel offer might be an educational white paper on how widgets are changing the way people do something. It could be a downloadable checklist of the top reasons why everyone needs a widget (not just your widget). Then there is the greatly loved eBook where you might segment the information you give based on where the visitor/lead is in the funnel.

You can also experiment with videos, free trials, discounts and newsletters. They all work, as long as the content is rich and has value.

I just saw a suggested post on Facebook about widgets.When I clicked on it, there was a cool offer; a checklist for organizing my Widgets.

When you are creating your offer think about what a potential visitor/buyer is thinking about when they are doing research on your widget and answer those questions for them in the top of the funnel offer. Use your keywords and action language that compel them.

The actual language you use varies. Unfortunately there isn’t a magic ball that will tell you exactly which words to use. This is where A/B testing comes in. Testing is a great way to identify which wording provides the most click-throughs for your offer.

MIDDLE OF THE FUNNEL OFFERS

A visitor who is in the middle of your funnel is most likely a qualified lead by now. They have given you some of their information (via the landing page that we will talk about later) or they have found your site using different key words that signal they are closer to making a buying decision.

There still needs to be lots of value with a middle of the funnel offer, however you can ask for a bit more information before you give it away too.

At this point in the buying process, a person is assessing the alternatives they have. They are gathering information about the solutions available for their type of problem. If they are on your website, then they are evaluating YOUR solution vs. your competitor’s. This is where the language you use in content gets a little more explanatory than educational.

The potential customer is thinking more about making a purchase. They have evaluated several options. They are ready to ask ask more distinctive questions.

There are a couple of widget-smiths in the area. I saw a conversation about it on Facebook. That widget organization list was helpful. I have room for another widget.

It is also where search terms get a little more involved.

Which widget has the best design?
How do widgets work?
Where do I get widgets in Inboundtown?
Payment plans on widgets?

Craft your blog, offer, landing page and social media plan around the questions your potential buyer is asking.

Using your SEO keywords, a middle of the funnel offer should explain the advantages of using your product. You can still use eBooks at this stage, or delve into the webinar. Actual case studies where your product or service has been used to great gain are a great way to convert middle of the funnel visitors as well. You might also consider an actual video of your product in action.

Once again, keywords and strong action language that is A/B tested is the way to get that “click” and secure more information on your lead.

BOTTOM OF THE FUNNEL OFFERS

The lead nurturing process is critical because most people who come to your website are not ready to make a buying decision. Regrettably, most businesses do not employ any type of lead nurturing process when it comes to inbound marketing. Even more alarming is that they don’t measure their results.

When you nurture leads with great SEO optimized content, and measure as they move through the funnel, you will have actual proof of what language works and what doesn’t, as well as a growing list of qualified leads to work with to grow and expand your business.

Bottom of the funnel leads are ready to buy. At this point they need reassurance and trust, as well as some pertinent information about your product.

I am going to buy a widget today. At lunch time, I am going to sit outside and order one from my phone. 
Widget Price List
Widget Coupon
Widget Deals

These well-qualified leads need an offer that lets them know you are a trustworthy business, as well as things like

  • Pricing Sheets
  • Product Guidelines
  • Business Cases
  • Testimonials
  • Company Awards and Recognition

The offer pages that you have on your website will be different, according to your visitors and where they are in the buying process. We also suggest having different offers geared to each buyer persona and each stage of the funnel. This is a great way to include evergreen offers on your website that visitors can always come to in the future.

Building offers takes time and practice, but the more offers a website has, the better chances you have of converting that visitor into a closed sale.

An offer can’t stand on its own though. It needs other pages on a website in order to exist, breathe and invite visitors in.

The Landing Page

A well-crafted landing page will do many things for a user.

It will Take them from the idea of an offer to actually receiving it. It should contain a well-placed, concisely worded and strong CTA button – make sure it stands out.

SEO and Your Inbound Marketing Strategy   Part 2 image IMA seo 2 cta button

A landing page will stimulate a user mentally and visually.

There should be just one offer or purpose. Don’t confuse your visitor with multiple offers and ideas, or links to different offers. Laser in on the offer, the language and the purpose.

Include other items like customer testimonials, awards and recognitions and sometimes even social media links that build trust and confidence.

SEO and Your Inbound Marketing Strategy   Part 2 image ima seo2 award2

Contain a form where the visitor will give some of their information to get something of value.
Have the same visuals and verbiage that got the visitor there in the first place – don’t confuse your potential customer with brand new information and graphic
Be topped by an engaging headline followed by a small amount of content that compels a reader to action immediately – like, within seconds – they NEED what you’ve got.

YOU ARE GOING TO LOVE THESE TIPS ON CLEANING YOUR NEW WIDGET

Did you know that our widget are made from special material?

Widget-smith widgets are hand-made in Inboundtown by smiths trained for years in the craft. Your widget has taken hours to make and is one of a kind. The materials were hand-picked by company owner, Dan Widget, a fifth generation widget-smith who hails from European immigrants.

These tips on cleaning our hand-crafted widgets will help you to take care of what we hope will become a family heirloom.

Here are some great ideas from our friends at Kissmetrics on creating the perfect landing page.

SEO and Your Inbound Marketing Strategy   Part 2 image IMA seo2 landing page design

Image Source: Kissmetrics.com

Each of these landing page components is going to be filled with your keyword SEO and strong action language. As with offers, your website should have several landing pages geared to different offers, different buyer personas and different stages of the lead nurturing process.

The Call-To-Action

SEO and Your Inbound Marketing Strategy   Part 2 image IMA seo2 CTAWhen a reader gets to your landing page, if they even read the headline you are ahead of the game. If they read your content the odds are that they are going to click on your CTA – it’d better be good. The visitor needs to know what to do next, like now, ASAP!

The words you use on your call-to-action should be short, and inspire the visitor to move through the process, because they NEED what it is you have to offer them.

This is the part of the sales process where you get them from window browsing to actually buying something.

A good call-to-action has several parts:

  • Value
  • Sense of Urgency
  • Ease of Delivery
  • A sense of connection between your company and the user

Ask questions, use numbers or statistics, be bold, use testimonials or just be yourself. Your buyer persona and your product will each determine what your call-to-action looks and feels like.

Your website will cultivate many different CTA’s for various offers, landing pages and blogs. Be clever about the CTA and your lead base will increase.

The Thank You Page

Every user who actually clicks on one of your offers and gives you any of their information needs to end their experience with a heartfelt Thank You.

There are many components to a thank you page, however from an SEO standpoint, the object here is purely to delight your visitor. Yes, use your keywords. Yes, try to upsell on another offer. Yes, give your company information if that is applicable.

However a big fat thank you with one or two keywords sprinkled in will do just fine here.

The Email

Sending emails as part of your inbound efforts has come back into marketing vogue. In fact, it still remains the number one way to reach potential buyers.

The information that you collect through your landing pages, offers and call to action pages will all be critical in how you plan to set up and send emails.

Once again, lead nurturing takes center stage with email content and who you send them to. To accomplish this, your email list should be segmented and blasts sent out according to how each segment is being cultivated.

Here are a few ideas about how to divide your email list:

  • Identify existing clients
  • Know when to convert visitors to prospects to qualified leads to clients
  • Design a system for encouraging site visitors to sign-up for your emails
  • Make sure that each name in the system has a “begin date” in their record
  • As a prospect moves through the marketing funnel and gives you more information, consider adding birth dates and other important dates that give you an excuse to send them an email
  • If you can, segment by location, income, marital status, etc.

Having your email list segmented will make it much easier to target the right prospects with the right information at the right stage in the buying process.SEO and Your Inbound Marketing Strategy   Part 2 image IMA SEO 2 Email

Your email list segmentation works a lot like your offers do. The people on your list who qualify as prospects will be sent top of the funnel information.

Middle of the funnel prospects who are actually reading your emails will need to receive more personalized emails that provide explanations and options for contact with your company. If a person has made it this far in your list, and you create awesome emails with links back to your page for new offers, you are probably going to close your sale.

Put each segment on some type of rotation – called drip marketing – which requires a follow up email, or even a phone call, depending on the type of lead.

There are several excellent email marketing companies out there who offer free or low cost alternatives to help automate your email process.

The Blog

The blog has become the central force in attracting potential clients to your website. By writing about industry related topics and including your SEO targeted keywords, your company can use a blog as the jumping point for every other inbound method you employ.

Distribute your blogs across social media networks using a link to your blog page and slowly but surely, your lead base will begin to grow.

These days, no one really knows how long a blog post should be; anywhere from 800 to 1500 words seems to suit Google just fine – as long as the content is original, researched well, has proper links and uses your keyword strategy.

The use of visuals in blogging is also a great way to get noticed. Make sure you name every picture or graphic you add to a blog post using at least one of your keywords – Google ranks using photo descriptions as well.

What should you write about? Go to your competitor’s blogs and see what they are writing about. Review your buyer personas and write content based on the questions they are asking.

Create content that varies:

  •             Posts about your industry
  •             Posts that are visually heavy
  •             Posts that are funny
  •             Posts about your company
  •             Posts directly related to your products and services

You will find that will good keyword research and buyer personas, finding something to write about isn’t going to be hard.

The Headline

Google loves a good headline. It entices a reader to read your content. If it does that – your headline is working!

  • It tells the reader what your content is about. Make sure it’s short, specific and not misleading
  • It is optimized for search engines, but only after you have considered your target audience
  • It triggers an emotion or a need in the reader

With a little research, you can find some great examples of how to write good headlines, and even headline words that have gone viral.

SOCIAL MEDIA PLATFORMS

When you start planning your inbound marketing strategy, instead of running out and signing up for every social media site out there, take a close look at each one and how it relates to your buyer persona and your business.

SEO and Your Inbound Marketing Strategy   Part 2 image IMA SEO2 Social Media Platforms

Cooper Smith of BusinessInsider.com wrote an interesting article on the major social networks called The Demographics Of Social Media Audiences, And The Unique Opportunities Offered By Each Network. In it he sites the big differences in the major platforms available to your company. Take a look at your buyer persona and figure out which social media audience is going to be the best for you.

COMMUNITY BUILDING

An often overlooked part of the SEO domain is putting yourself out there as a part of your business. Building relationships both online and throughout your community is a great way to peak interest and curiosity about you and your brand.

Become a part of a select few groups on your chosen social media platforms and engage well with them. Quality is better over quantity here folks.

THE USER EXPERIENCE

SEO and Your Inbound Marketing Strategy   Part 2 image IMA SEO2 User ExperienceDon’t forget that creating a good buyer persona at the beginning of the SEO process translates to a potential client later on. Optimize your website for search engines, but make sure your visitor likes it first. If your website is so optimized for engines that a user gets very little stimulation, then the entire process it pointless.

You are in business to sell to people, not search engines. Making search that your website and content is engaging for visitors should be your first goal, with search engines coming in second.

Search Engine Optimization in relation to your inbound marketing strategy can be an amazing way to get more traffic to your website. Using SEO both before and after the content creation process creates a great experience for both the search engines and, more importantly, your potential customer.

Creating good content that is geared toward your targeted audience, as well as suited toward web crawlers increases your chances of creating more leads, as well as being included in higher search rankings.

And never forget how your SEO and content efforts relate to your lead nurturing process. The inbound marketing strategy, when used correctly, will create big wins for both you and your customers.

As always, an inbound marketing agent can help you with every step of the SEO process as well as creating your inbound strategy and making it work for your business. Are you the “Master of Your Domain”?

SEO and Your Inbound Marketing Strategy   Part 2 image b2e4c25c 86cc 4969 8dbe d6fea3bd4f901

17 Apr 14:36

Why Get Ahead Of The Buyer?

by Tibor Shanto

 By Tibor Shanto - tibor.shanto@sellbetter.ca

Rear view

I recently saw an ad for a sales program, and that big bold letters enticing me to buy read: “How To Get Ahead Of Your Buyer”. While I get where they were coming from, or more accurately who they were trying to appeal to, but there was just something wrong with the way it was phrased.

I think one of the biggest challenges sales people have is not to get ahead of the buyer, it seems to me that getting ahead of the buyer is the same as “leaving the buyer behind”, a dangerous notion and more dangerous practice.

One of the key things we help sales teams accomplish with the EDGE framework is alignment with the buyer. Executing the sale in a way that keeps you engaged and in step with the buyer, leads to a number of pluses, not to mention more sales.

Alignment is key, it helps you focus and cover objectives, which then allows you to offer practical means of helping the client achieve those objectives. The idea of getting ahead of the buyer has an old school ring of pain and needs based selling.

When you rush ahead of the buyer, because you are familiar with the scenario, you’ve seen and heard it before, you tend to want to “close” too early, usually relying on old school “closing techniques”. In some ways I thought we were past this, but this ad and a recent discussion in a LinkedIn group suggest that we are not. That discussion was based on the question “What’s the best, most effective question you’ve ever asked a client?” Apparently some sales people still ask what keeps the prospect awake at night. With thinking like that, and leaving the buyer behind, sellers move to close too early in the process, you may feel you are done your discovery, but the buyer is still defining and refining their requirements. Moving to close at this stage will at worst make the buyer feel pressured, scare them to compare to others, and at best, slow down the deal, requiring a longer sales cycle, the use of more resources, and less time to spend on other opportunities.

When this happens, and other companies enter the fray, price will not only become an issue, but a central issue. What was your deal to win, now becomes your deal to buy, and there is never money in that.

The flip-side of getting ahead, is falling behind, the relationship approach, “whatever makes you happy, I’ll be here when you’re ready.” The net effect of this again is that the buyer learns whet they require, after all you are there with all the facts and didees, and when they are ready to buy, they do so from the guy asking for the order, not the one waiting.

Work with the buyer, lead the buyer, based on their objectives, your expertise as a subject matter expert, but don’t get ahead, or fall behind, manage the alignment.

What’s in Your Pipeline?
Tibor Shanto 

17 Apr 14:36

The Hidden Value of Influencers in B2B Content Marketing

by Lee Odden

B2B influencer marketing

In the 2014 B2B Content Marketing Trends report from Content Marketing Institute and MarketingProfs, the top challenges that B2B content marketers face include: lack of time, not being able to produce enough content, not being able to create the kind of content that engages, lack of budget, and lack of content variety.

Sound familiar?

Stats like “Buyers are two-thirds to 90% through the sales funnel before they contact sales” (Forrester) and “72% of B2B buyers use social media to research solutions to purchase.” (DGR 2014 B2B Buyer Behavior Survey) have a lot of B2B marketers focusing on content and social media programs that require far more resources and time to deliver leads than most business managers have patience for.

As a long time B2B marketer operating with very little budget (self imposed of course), few resources and huge obligations to produce a quantity of quality content that can attract, engage and convert new business – I’m intimately aware of the top challenges revealed in the CMI study.

Producing high quality content consistently over a period of time is only part of the battle. In today’s age of information overload, amplification and promotion are essential in order for that great content to get noticed. Outside of advertising and the outright purchase of traffic, there isn’t much in the way of organic amplification options outside of the increasingly difficult practice of SEO and the moving target of organic social media.

And yet there is one approach that has been delivering great returns.

One of the most effective ways to shortcut your path to B2B content marketing success is to align with those that already have it.

Consider this: If you can find a way to solve multiple problems for your target audience working with influencers that are already known as experts in those solution areas, your brand will grow your own networks of influence, expand reach to new audiences and increase influence as a trusted authority for what your customers buy. That’s a winning set of outcomes in my book.

To put this approach into action, here are 5 essential steps for tapping into the hidden value of working with influencers for B2B content marketing programs:

1. Influencer Marketing Goals

Influencer Marketing Goals

A big part of identifying influencer content goals is about understanding what’s possible. Here are a few suggestions:

  • Change how the brand is perceived
  • Connect with a new audience of buyers
  • Support thought leadership and PR goals
  • Support content, social media and search marketing programs
  • Create relationships with industry experts
  • Increase the quality of leads
  • Shorten sales cycle
  • Increase the number of referred leads
  • Increase organic media mentions

I could go on and on, but you get the idea.

2. Topic and Content Type Selections

Influencer Content Topics

Think of how your brand wants to be known – what does the company, product or service really stand for? Then empathize with your target audience to hone in on what information customers actually need in order to buy from you. Topic selection is about being the best answer for the core questions: How do you want to be known as a brand? What information do buyers need to move from awareness to interest to inquiry?

Understanding your distinct audience groups can reveal content types that resonate best based on platform and buyer preferences. Typically, there’s an anchor piece of content that’s robust like a research report, ebook or white paper supported by complementary content types like blog posts, articles in industry publications, videos, infographics, or sponsored content. Content plans should map topics with content formats and media to provide a roadmap of how the co-created content will be published, promoted, and repurposed.

3. Identify, Qualify and Recruit Influencer Participants

Recruit B2B Influencers

With a clear understanding of the key goals, topics and content, it’s time to find influencers that are already known as authorities in those areas. In fact, your industry participation should have revealed some of the more obvious candidates long before you need them. Influencer discovery tools can be effective at finding and qualifying niche influencers. Examples of such tools includes Traackr, Followerwonk, or GroupHigh.

Once you’ve identified your key B2B influencers, it’s important to qualify them. Balance qualification according to metrics like size of network along with quality of interactions. It’s not enough for an influencer to be dubbed “famous”. They also need to be effective in their ability to influence change of perspective and likelihood to take action amongst their own community.

To warm the waters, create opportunities to engage with influencers, before the ask to participate in your content project. Engage through commenting on their blog posts, connecting on social networks, getting introduced through mutual connections and being useful. Then, learn what they value before soliciting participation. If it’s mostly fame, that’s pretty easy. If it’s a higher purpose, you’ll need to find a way to make a connection between the project you’d like to work together on and that thing that inspires the influencer to do what they do.

The more influential, well known and respected you and the brand you work for are, the easier it will be to secure participation from the top tier influencers. Always work on enhancing your own reputation as you create value for your influencer partners.

4. Create and Promote the Co-Created Content

B2B Influencer Promotion

Once you gain agreement to participate, it’s time to collect content. Usually this can be done via email, but you might need to do it by phone and transcribe the conversation. Understand that most B2B influencers are very busy, so make participation attractive and easy for them. They must see that a nominal effort on their part will result in a substantial return.

Provide information that will make it easy to promote the finished product too, whether it’s a report, and eBook or an info graphic. Pre-write social shares, provide a preview and emphasize success.

Organic content promotion in general can work well with a hub and spoke model where the hub is the focal point for your content on a particular topic and the spokes are channels of distribution for engaging community and promoting content. Those channels are most often social networks, but can include email lists and paid promotion channels as well.

5. Optimize Content Performance

Optimize Influencer Performance

With content performance optimization, it starts with clear goals and identifying the key performance indicators or metrics that you will track to determine that your program is on or off track.

For the influencer(s), track the social shares they make of the content, engagement that results and the performance of their contributions. Do they get mentioned by other blogs, is their content getting on-page engagement via comments or specific social shares? Is the content referring traffic and inquiries effectively to your landing pages?

For the overall content program, monitor promotion metrics like social shares, pickups in industry media and blogs, look at referring traffic sources from social networks, search engines and direct referrals. Evaluate the program like you would any other content marketing initiative to determine the impact on overall program, marketing and business goals.

Establish benchmarks from the start and monitor post launch to determine trends and outcomes. Did the project help change the way your brand is talked about on the social web? In the industry? Were you able to connect with a new audience of buyers? Did the co-created influencer content serve as a resource for other marketing and PR initiatives? What could you do to improve performance?

Collecting content performance information will help you refine your approach in all aspects of working with B2B influencers to co-create content: from identifying influencers to the theme of the content to promotions.

For those that want even more insight into this practice of B2B influencer content, I’ll be presenting on this very topic at the Content2Conversion conference in New York May 6-7 this year: “Influencer Content: How to Win Buyers Hearts, Minds and Wallets with Content Optimized for Search, Share and Sales”. I hope to see you there.

Photos: Shutterstock


Email Newsletter Gain a competitive advantage by subscribing to the
TopRank® Online Marketing Newsletter.

© Online Marketing Blog, 2014. | The Hidden Value of Influencers in B2B Content Marketing | http://www.toprankblog.com

17 Apr 14:35

For Brand Messages, Distribution Matters.

by Sarah Skerik

Why do press releases still matter? I tackled this question in an interview with The Pulse Network at the Inbound Marketing Summit a couple years ago.

A post on PR Daily today questions the value of press release distribution, given the declining number of journalists. [link]

So who really does read press releases these days?

In short, the audience is still vast, and it includes all of your organization’s key constituents. Press releases are extremely public means of communications.

  • The tens of thousands of credentialed media on PR Newswire for Journalists tally more than one million press release reads each month.
  • On PR Newswire.com, the press releases we issue garner more millions more reads each month. Most of those readers find the content via search engines.
  • On Twitter, if you search the term “PRNewswire” you’ll see an avalanche of tweets referencing press releases – often several per minute.

Our clients tell us the press releases they issue have resulted in coverage on Good Morning America (with no pitching!), increases in landing page traffic of more than 200%, record app downloads and the generation of qualified leads for sales teams. The key take-away is this: all of your brand’s constituents are reading the PR content you distribute. Failing to calibrate your content accordingly leaves measurable results on the table.

Distribution drives results.

What drives these results? Distribution. Distributing messages beyond the realms of the journalists on your targeted media lists and your brand’s followers on social networks delivers specific and measurable results. Well-crafted messages are found by new audiences, re-distributed across peer and professional networks and are surfaced in search engine results – often for months after the messages are originally issued. Distribution is the key to driving ongoing message discovery and introducing your brand to new constituents.

Disappointing results? Take a hard look at the message.

If your press releases aren’t generating results, before you blame your distribution channels, take a look at the messages. Here are some tips for making your press releases relevant, useful and effective in today’s connected digital environment:

  1. Is your content truly interesting and useful to your target audiences? Framing your message in the context of what your audience cares about or will find interesting will enliven your message, and prevent it from reading like a missive from the ivory tower.
  2. Do your headlines convey the messages that will appeal to audiences? Headlines aren’t for branding. They shouldn’t be coy. Headlines need to arrest the eyes of your reader, and inspire them to stop, and read your message. Keep the headline short – about a hundred characters. Use a subhead to add the brand mention and additional detail – you needn’t be so mindful of length there.
  3. Do you embed specific and measurable calls to action toward the top of your messages? Give your readers a path to take by providing a link to a relevant web page that will further engage them with your brand. Invite them to read an excerpt of a white paper, view a demo or provide robust Q&A that will answer their obvious questions. In addition to courting media coverage, the press releases you issue are also portals for your brand, and can deliver new audiences right to their doorstep. Don’t rely on a link to your homepage that’s buried down in the boilerplate. Make it easy for people to find relevant information, and take the next step.
  4. Is the copy you distribute designed to be easily scanned by readers on all kinds of devices, using bold subheads and bullet points to surface key themes? Many people are reading press releases on tablets and smartphones. Organize the body of your press release content into easy to scan chucks, and use numbered or bulleted lists to draw attention to key points.
  5. Does your PR team illustrate press releases with visual content, such as videos, images and infographics? We really can’t emphasize the value of visuals enough. Search engines and social networks are increasingly visual, and plain text simply doesn’t carry the same weight. Relying on plain text reduces the effectiveness of messages.

The practice of public relations today requires an increasingly deft touch. PR Newswire’s own distribution network is designed to deliver customized content to the journalists, bloggers, web sites and media outlets that subscribe to our news feeds. Ensuring the content they receive from us is relevant to their interests and areas of coverage is the cornerstone of our media relations programs and services.

Likewise, the development of e-mail pitches and press releases takes a similar deft touch. But don’t leave distribution out of the picture. If your organization wants to increase inbound web site traffic, acquire new followers, find new audiences and earn some media along the way, broad outbound distribution of your messages via a service like PR Newswire will deliver measurable results.

17 Apr 14:35

4 Realities of Inbound Marketing You Can’t Afford to Neglect

by Guest Post

4 Realities of Inbound Marketing You Can’t Afford to Neglect written by Guest Post read more at Small Business Marketing Blog from Duct Tape Marketing

It’s guest post day here at Duct Tape Marketing and today’s guest is Rohan Ayyar – Enjoy!

Inbound marketing and social media participation for brands are one of the most effective promotion tactics today. The whole world of marketing is now skewed towards “earning customers” instead of “buy, beg, or buy your way in” that outbound marketers follow, if this Inbound vs. Outbound Marketing infographic on Mashable is to be believed.

The fundamental shift in consumer behavior is certain now: individuals are in control of what information they choose to receive. Not only do they have options when it comes to brands while buying, but they can also choose who they want to hear from.

According to Mashable’s infographic, more than 84% of 25-34 year olds have abandoned their favorite website because of intrusive or irrelevant advertising. More than a whopping 86% of people skip television ads. At least 200 million Americans have registered for FTC’s “Do Not Call” list. Over 91% of email subscribers have unsubscribed from an email list they previously opted into.

Clearly, outbound marketing is having a hard time. On the other hand, inbound marketing works, but only when you go at it the right way.

Here are a few inbound marketing realities you can’t afford to neglect:

1. No one gives two hoots about your brand, product, service or whatever

This one’s hard. In fact, it’s the hardest truism about being in business today. Contrary to whatever you might think about your business, your prospective customers don’t really give a damn about you. It’s a hard pill to swallow. Does it mean all that passion, sweat, blood, and tears you put into running your business are for naught?

Customers aren’t overly concerned about you, and won’t be either, for as long as you beat your big corporate chest with your “campaigns,” you are just carrying out interruption marketing.

What the world does care about is solutions to problems. Your prospective customers are looking for solutions that can make their life better somehow, in some way. Whatever fits the bill – with respect to products and services – takes the cake.

2. Competition has no face

Once upon a time, all that a company would have to worry about – apart from producing goods and delivering services – was competition from similar companies selling similar products. Today, competition comes in new garbs everyday.

First, there’s the information overload that customers are slowly getting immune to (which means that they mastered the art of ignoring what you have to say). Second, the competition comes from smarter and leaner companies that have learnt the art of keeping customers engaged (with inbound marketing practices, of course).

If you’ve ever wondered why all that money being spent on campaigns never managed to bring in a dollar, it’s because of this competition overload. You just have a lot more to do today.

Are you ready to deal with it?

3. Marketing is the new way of giving

Capitalism was almost a result of selfishness. Ayn Rand was a staunch advocate of “self-worth” and “self-preservation.” She wrote whole tomes like Atlas Shrugged to get that point across. That was then.

Capitalism is still about making a profit. It’s just the way profits are made has changed with inbound marketing. This new line of marketing calls for “selflessness.” It calls for giving away more than you ask for. It calls for altruism, generosity, and spreading buckets of value through content, information dissemination, and relationship-building on social media.

Take whatever route you like, just make sure you give.

4. Inbound is harder than outbound

Most rookie entrepreneurs believe that since inbound marketing is relatively cheaper than traditional marketing, it ought to be easier. As they say, “Talk is cheap.” However, it’s easy to forget that work comes at a premium.

Inbound marketing is harder than traditional marketing. As a matter of fact, marketing is always hard as Drew Williams of HubSpot candidly explained. There are a whole lot of things to get used to. Businesses have to produce an unimaginable amount of content. There’s social media, there’s content (which itself stretches into blog posts, videos, podcasts, slide decks, infographics, curated content, and a whole lot more), which companies have to produce at an alarming rate.

Then there are multiple channels to tap into. Marketing itself is now a hodge-podge of tasks, departments and functions. Teams need to put their heart into all of these. They need to learn and use sophisticated tools for manifold tasks ranging from project collaboration to publishing, from web analytics to video conferencing. What’s more, they need to be effective at that, produce results and justify ROI.

How do you go about inbound marketing? What are the biggest challenges you’re facing in getting inbound leads? How do you convert these to sales? Do you have any new tactics or strategies to share?

Rohan Ayyar bio photoRohan works at E2M solutions, a premium digital marketing firm specializing in creative content strategy, web analytics and conversion rate optimization for startups. He is an avid blogger, with posts on Search Engine Journal, Social Media Today and Moz, among other places. Rohan hangs out round the clock on Twitter @searchrook – hit him up any time for a quick Q&A.

Related posts:

  1. The Problem With Inbound Marketing I’ve been promoting the concept of inbound marketing for about...
  2. Are You Ever “Finished” with Inbound Marketing? Enjoy this guest post from Michael Reynolds is President/CEO of SpinWeb...
  3. The Inbound Marketing Guidebook Hubspot co-founders Brian Halligan and Dharmesh Shah have synthesized, condensed...
17 Apr 14:35

Getting to Know Your Audience: Why Customer Reviews Are Key to Your Marketing Success

by Alex Espenson

Getting to Know Your Audience: Why Customer Reviews Are Key to Your Marketing Success image Customer Reviews 300x198Selling products, services or even content to users and potential customers today is never a simple task, especially with the rapid increase in online and mobile shopping. Knowing how to truly connect with your customers to create an authentic relationship and bond is a way for you to ensure you genuinely understand what your loyal followers want from you. Understanding why customer reviews are so important can also give you more insight into your current level of customer service that is provided to those who use your company.

Customer Reviews Give Insight into Product Quality

Customer reviews left by those who have purchased products or services from your brand give you more insight into the current level of product quality you are producing and selling. Knowing how your customers feel about the level of quality you provide is a way for you to make improve your offerings to any item that is not performing well or getting the highest reviews possible.

They Show You What’s In Demand

Reading the reviews your customers leave for you, both good and bad, is another way to learn more about which of your products or services are currently in high demand. Although it is possible to track the metrics of your sales within most shops and eCommerce platforms available today, customer reviews can give a more personal story attached to the items, and is a great way to find additional inspiration for future products or services you may want to offer. Listening to customers can open doors to new products and services.

They Can Be Used as a Tool to Rebuild the Relationship You Have With a Customer

When you receive a negative review regarding your company, product, or specific service, it’s important to consider using the review platform as an opportunity to rebuild the relationship with an individual customer directly. According to SocialMediaToday, 95% of unhappy customers are likely to return to a company for future business if their issue is resolve professionally and in a timely manner.

Understanding the benefit of using a review system to respond to your customers effectively and respectfully is essential, not only to for retaining current customers, but also for generating new leads—because if you don’t listen to your unhappy customers, then they may just speak loudly enough for the rest of the world to hear. When that happens, you might find that the damage done to your reputation is almost irreparable.

Avoid Getting Defensive

Avoid getting defensive or using a customer review platform to berate a customer who has been disgruntled with the services or products you have sold them. Instead, use the platform to respond in a professional manner, offering refunds, discounts, exchanges or additional support. Toyota is a great example of how you can bounce back from a PR nightmare. Always be sure to provide customer support in the form of a representative, phone number or even an email address to work with customers directly.

Avoid Removing Negative Reviews

It is also important to avoid removing or entirely deleting any negative reviews or comments you receive about your business, as this may ward off potential customers who were at one time interested in your brand and the services or products you sell. When you filter content and rid negative reviews, onlookers may believe your brand has something to hide, or does not believe in free speech and voicing personal opinions. Allowing all users and past customers to state their mind openly will keep others from forming negative opinions against your business for filtering and blocking opposing views. Of course, if the reviews are unnecessarily offensive or use vulgar language, then you may need to remove them for the sake of other readers. Use your judgement, and make sure that you’re not just pulling down posts for fear of bad publicity.

When you take the time to get to know your audience by reading any customer reviews your company has, it is much easier to deliver the products and services they are seeking The more time and effort you put into improving the overall level of customer service you provide will also help to increase your online credibility, in addition to your professional reputation—no matter what industry or field you inhabit.

17 Apr 14:35

5 Sales & Marketing Thought Leaders Weigh In on Inbound Marketing

by Dan McDade

Symptoms of InbounditisIn January I wrote the blog: How to Diagnose if Inbounditis is Killing Your Sales Pipeline, which was published by DemandGen Report. In the article I assert:

"A healthy, driven inbound marketing department is great, but over-reliance on inbound marketing (what I call 'inbounditis') negatively affects the revenue backbone of any company. In fact, it makes the whole sales pipeline sick.

"The three major symptoms of inbounditis are:

1. Deal sizes gradually decreasing as inbound leads increase;
2. High-performing reps avoiding inbound lead follow-up; and
3. The percent of sales accepted leads decreasing while lead quotas increase.”

Several PowerViews' alums also shared their thoughts on the subject:

including AA-ISP founder Bob Perkins who said:

"I will quote a dear friend, Antarctic Mike, who said, 'Finding net new business is the fuel of champions.' I couldn’t agree more. There is something about hunting down new contacts and business that fuels the engine of top sales reps. Relying solely on inbound activity is akin to eating junk food 3 meals a day for a month … it isn’t adequate fuel for high-performing sales reps."

Next up: Kyle Porter, CEO of SalesLoft:

"Less qualified leads in the pipeline! Leads are never more qualified than when you pick them on your own (outbound). With inbound, you are subjected to lead quality issues and you have less control! But you need both! Inbound + Outbound = Awesomebound."

From Matt Heinz, president of Heinz Marketing:

"Inbound marketing can be both highly effective and highly inefficient. If you’re relying on inbound marketing and leads only today, you will soon reach a point at which you can no longer effectively scale your business." You can read the rest of that article here.

Joanne Black, No More Cold Calling AND Pick Up the Damn Phone:

"You Call That a Lead? It's time to change how we talk about sales leads. Inquiries are not leads, and neither are those 'coveted' lists of names. Suggesting otherwise borders on insulting.

"Leads are people who express interest in discussing your product or service. They match the profile of your ideal client. They have budget—and a need. And they want to learn more about how you can help grow their businesses. It is downright misrepresentation when companies position themselves as lead-generation experts. It sounds so good (so easy), and so we jump. That’s how we get our sales funnels clogged with cold leads that waste our time and almost never pan out.

"Good salespeople know how to build qualified pipelines. That’s our job, and we’re good at it. Marketing has its own role to play—an important, critical one. We need their help more today than ever … just not with qualifying leads."

Note: Joanne and I disagree on the definition of a lead and whether or not marketing should be involved in the process of qualifying leads. In my opinion, focusing on budget may not always be the optimal route. I also believe that marketing still plays an effective role in qualifying leads. With that said, Joanne and I see eye-to-eye on the majority of other issues. Her books reflect her insightful level of expertise, and I highly recommend them.

From Chris Snell, Inside Sales Manager, SMB at Care.com

"Here's what I see are the top two symptoms of inbounditis:

1. ISRs (inside sales reps) rely too much on being farmers, and when dry times come (just like they do for real farmers!), they've lost their hunting skills and wind up going hungry.
2. ISRs become slaves to the reactive, and if there's a charge to break into new verticals with new products, you can't just wait for prospects to come, you've got to go out and get them."

Conclusion: Unless you are selling a relatively low-priced commodity, over-dependence on inbound leads to smaller deals with lower-level decision makers. An optimized balance of inbound and outbound marketing techniques, i.e. “allbound marketing,” consistently generates high quality leads that ultimately produce revenue. And that, dear reader, is the bottom and the top line.