Shared posts
13 May 07:24
8 Ways to Create Shareable Social Media Content
by Danielle Cormier
According to Jonah Peretti, founder and CEO of BuzzFeed, creating content people love to share is the key to success. These 8 useful tips will help you create socially shareable, relevant content. Just make sure you spend as much time getting your content out there as you do actually creating it.
13 May 07:24
Top 10 Must Read Tips to Run a Successful Facebook Business Page
by Genevieve Lachance
Marketing your business on Facebook is something that should be well planned; having a successful Business Page requires that you understand the platform. Here are 10 tips you can use to run a successful Facebook Business Page.
13 May 02:57
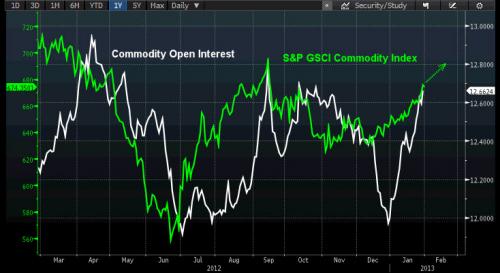 Инвесторы наращивают вложения в сырье самыми быстрыми темпами за год, что может свидетельствовать о том, что после достижения ценами на этой неделе пиковой за четыре месяца отметки ралли на товарных рынках продолжится.
Рост вложений в сырье на максимуме за год, сулит ралли
by kmaksimov
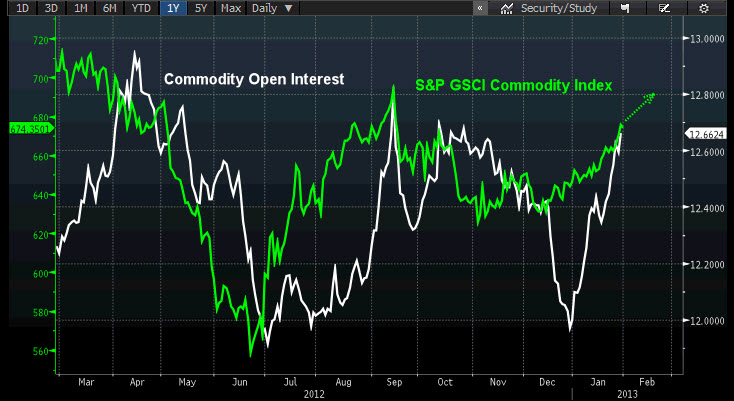 Инвесторы наращивают вложения в сырье самыми быстрыми темпами за год, что может свидетельствовать о том, что после достижения ценами на этой неделе пиковой за четыре месяца отметки ралли на товарных рынках продолжится.
13 May 02:57
 В Китае и Индии была равная численность сельского населения, когда Ху Цзиньтао встал у кормила власти в КНР, однако спустя десятилетие китайская демография изменилась, и при новом вожде Си Цзиньпине поток переселенцев из деревень, подстегивающий рост китайской экономики, будет куда слабее.
Снижение доли крестьянства в Китае угрожает росту ВВП
by kmaksimov
Alexander Didenkoпохоже кое кто на Блогберге вовсю использует мощь функции FFM :)
 В Китае и Индии была равная численность сельского населения, когда Ху Цзиньтао встал у кормила власти в КНР, однако спустя десятилетие китайская демография изменилась, и при новом вожде Си Цзиньпине поток переселенцев из деревень, подстегивающий рост китайской экономики, будет куда слабее.
13 May 02:56
 Новым лидерам Китая достается экономика с доминирующей ролью государственных компаний, ответственных за самое резкое среди других стран БРИК снижение оценочной стоимости акций за последние 10 лет. График показывает отношение цены к прибыли индекса Shanghai Composite на фоне индикативных индексов MSCI для Бразилии, России и Индии на протяжении десятилетия. По состоянию на октябрь, оценочная стоимость китайских компаний снизилась на 76 процентов, свидетельствуют данные в терминале Блумберг. Как показано на нижней панели, капитализация китайского рынка примерно в $2,8 триллиона сопоставима с суммарной капитализацией в $3,1 триллиона остальных стран БРИК.
Оценка китайских акций упала больше других в БРИК с 2002
by kmaksimov
 Новым лидерам Китая достается экономика с доминирующей ролью государственных компаний, ответственных за самое резкое среди других стран БРИК снижение оценочной стоимости акций за последние 10 лет. График показывает отношение цены к прибыли индекса Shanghai Composite на фоне индикативных индексов MSCI для Бразилии, России и Индии на протяжении десятилетия. По состоянию на октябрь, оценочная стоимость китайских компаний снизилась на 76 процентов, свидетельствуют данные в терминале Блумберг. Как показано на нижней панели, капитализация китайского рынка примерно в $2,8 триллиона сопоставима с суммарной капитализацией в $3,1 триллиона остальных стран БРИК.
13 May 02:56
 Пять лет спустя после того как мировые фондовые индексы достигли пика, стоимость компаний из развивающихся стран показала самое резкое падение, хотя их экономики росли наибольшими темпами. График показывает, что отношение рыночной цены к балансовой стоимости акций индекса MSCI Emerging Market с октября 2007 года снизилось на 47 процентов. Этот же показатель упал на 41 процент для японского индекса Nikkei 225 Stock Average, на 38 процентов для индекса Stoxx Europe 600 и на 27 процентов для индекса Standard & Poor’s 500. Как видно на нижней части графика, экономический рост, по данным Международного валютного фонда, был выше именно в развивающихся странах.
Акции развивающихся рынков упали глубже остальных с 2007
by kmaksimov
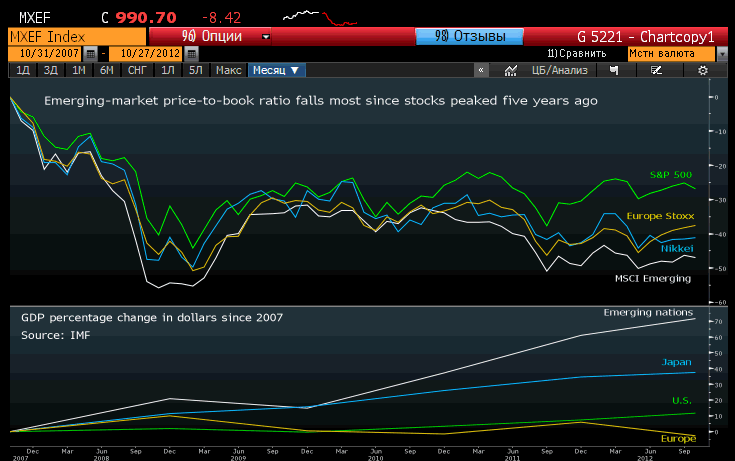 Пять лет спустя после того как мировые фондовые индексы достигли пика, стоимость компаний из развивающихся стран показала самое резкое падение, хотя их экономики росли наибольшими темпами. График показывает, что отношение рыночной цены к балансовой стоимости акций индекса MSCI Emerging Market с октября 2007 года снизилось на 47 процентов. Этот же показатель упал на 41 процент для японского индекса Nikkei 225 Stock Average, на 38 процентов для индекса Stoxx Europe 600 и на 27 процентов для индекса Standard & Poor’s 500. Как видно на нижней части графика, экономический рост, по данным Международного валютного фонда, был выше именно в развивающихся странах.
13 May 02:29

Crude Oil Trade Setup Forming - by ChrisVermeulen (StockTwits)
Alexander Didenkolong term view
13 May 02:06
Marketwatch опубликовал интересную статью о текущем портфеле Сороса
http://www.marketwatch.com/story/george-soross-long-term-picks-2013-05-10
Основные вложения - Citigroup, Google, Morgan Stanley, Delta Airlines, JP Morgan, Apple, AIG.
Основные вложения - Citigroup, Google, Morgan Stanley, Delta Airlines, JP Morgan, Apple, AIG.
13 May 01:58
Mark Hulbert: The Dow Theory’s buy signal
Alexander DidenkoМаркетвоч крутой. Список фидов можно найти тут: http://www.marketwatch.com/rss/
The Dow Theory generated a buy signal at Friday’s close, right? According to Mark Hulbert’s research, it depends on which Dow Theorist you ask.


13 May 01:54
Michael Casey's FX Horizons: Japan’s biggest export? Deflation
Forget cars, Nintendo machines or anime. Japan’s biggest export right now is deflation, writes Michael Casey.


13 May 01:54
Outside the Box: Why Wall Street is unmoved by gold fever
When it comes to gold, what might Wall Street know that moms and pops in developing markets do not?


13 May 01:53
John Prestbo's Indexed Investor: Sell in May, but when should you buy?
One problem with that catchy old adage, “Sell in May and go away,” is that it doesn’t tell you when to come back. The answer, it turns out, is October, writes John Prestbo.


13 May 01:52
Michael Sincere's Long-Term Trader: Why I stopped using stop loss orders
A big problem with stop losses is that you give up control of your sell order. During volatile markets, that can cost you money. But there is an alternative, writes Michael Sincere.


13 May 01:51
Mark Hulbert: Investors can’t beat the machines
As computer-driven trading increases, the ability of individual investors and professional advisers to beat the market, and the computers, becomes that much more difficult.


11 May 22:30
Bernanke-Haters at the Sohn Conference
by J. Bradford DeLong
Alexander DidenkoСонин из РЭШ рекомендует прочесть
Druckenmiller noted everyone is saying, "love the market long term, looking for a correction." He believes the opposite, loves market short-term, but hates it long term. Strongly disagrees with quantitative easing by Bernanke now. Only agreed with the first QE. "His bond buying is controlling the most important price in the US economy." Says it will end badly, despite money-printing being beneficial to financial assets currently. When Fed slightly tightens, that will hurt things he says. Bernanke completely ignored strong economic data in January and February, but with slightly soft data later, he printed even more money. Expects a "melt-up" in the short-term, due to Fed's current policy…. Bernanke is “running the most inappropriate monetary policy in history.”
"The majority of what we do at our firm is event driven - the 'macro' is the event right now."… Now he wants to talk Japan. His firm has developed an index to test the acuity of the situation - puts up a slide showing 10 Japanese finance ministers in the last five years, five in the last three years, crowd laughs. "Japan starts with the answer as far as what they want to do, then backfills to get there, like China's economy does." (His "index" slide is here) "You have to be shitting me," Bass says about Japanese bond issuance, "they're adding a ponzi scheme to a ponzi scheme." Japan is on tilt, completely insolvent and their policy is now more than twice as aggressive as ours 70% of the amounts that the Fed is using in an economy that is a third of the size). He points to some anecdotal evidence where counterparties with Japanese debt issuers are starting to rethink their forward assumptions. He says as these episodes start piling up. "This is the end of the beginning."
"Central Banks have reveled in their role, flooding the market with money, they think printing money is 'free' and they don't see the cost- since there is no inflation." We have modest growth, and build-up of risk. "The world needs growth; from innovation." Quantitative easing has caused a distorted recovery. People owning bonds, stocks, is doing fine. Ordinary citizens are not feeling the effective equivalent of Dow 15,000. Causing class warfare. His idea: Those who own long-term bonds of US Governments or others, own things that are not priced correctly. There is no safe haven in these markets. There is no such thing.
Paul Singer: Bernanke Destroying "The Value Of Money" And "Uprooting The Basic Stability Of Society":
[T]he financial system (including the institutions themselves, products traded, and risks taken) has “gotten away from” the Fed’s ability to comprehend. The Fed is primarily responsible for that state of affairs, and it is out of its depth. Former Chairman Greenspan created – and reveled in – a cult of personality centered on himself, and in the process created a tremendous and growing moral hazard. By successive bailouts and purporting to understand (to a higher and higher level of expressed confidence) a quickly changing financial system of growing complexity and leverage, he cultivated an ever-increasing (but unjustified) faith in the Fed’s apparent ability to fine-tune the American (and, by extension, the world’s) economy. Ironically, this development was occurring at the very time that financial innovations and leverage were making the system more brittle and less safe…. Under Chairman Bernanke, the combination of ZIRP and QE completed the passage of the Fed from sober protector of a fiat currency to ineffective collection of frantically-flailing, over-educated, posturing bureaucrats engaged in ever more-astounding experiments in monetary extremism.
If you look at the history of Fed policy from Greenspan to Bernanke, you see two broad and destructive paths quite clearly… the cult of central banking, in which the central bank gradually acquired the mantle of all-knowing guru and maestro… arrogance, carelessness and a rigid and narrow orthodoxy substituting for an open-minded quest to understand exactly what the modern financial system actually is and how it really works. The second path is one of lower and lower discipline…. Monetary debasement in its chronic form erodes people’s savings. In its acute and later stages, it can destroy the social cohesion of a society as wealth is stolen and/or created not by ideas, effort and leadership, but rather by the wild swings of asset prices engendered by the loss of any anchor to enduring value…. Speculators win, savers are destroyed, and the ties that bind either fray or rip. We see no signs that our leaders possess the understanding, courage or discipline to avoid this.
It is true that the CEOs of the world’s major financial institutions lost their bearings and were mostly oblivious to their own risks in the years leading up to the crash. However, as the 2007 minutes make clear, the Fed was clueless about how vulnerable, interconnected and subject to contagion the system was. It is not the case that the Fed completely ignored risk; indeed, several Fed folks made “fig leaf” statements about the risks of the mortgage securitization markets, as well as other indications that they appreciated the possibility of multiple outcomes. But nobody at the Fed understood the big picture or had the courage to shift into emergency mode and make hard decisions…. Ultimately, of course, as the system was collapsing and on the verge of freezing up completely, the Fed shifted into the (more comfortable and much less difficult) role of emergency provider of liquidity and guarantees….
QE is a very high-risk policy, seemingly devoid of immediate negative consequences but ripe with real chances of causing severe inflation, sharp drops in stock and bond prices, the collapse of financial institutions and/or abrupt changes in currency rates and economic conditions at some point in the unpredictable future. However, the lack of large increases in consumer price inflation so far, plus the demonstrable “benefits” of rising stock and bond markets, have reinforced the merits of money-printing, which is now in full swing across the world. In the absence of meaningful reforms to tax, labor, regulatory, trade, educational and other policies that could generate sustainable growth, “money-printing growth” is unsound. We believe that the global central bankers, led by the Fed as “thought leader,” have no idea how much pain the world’s economy may endure when they begin the still-undetermined and never-before attempted process of ending this gigantic experimental policy. If they follow the paths of the worst central banks in history, they will adopt the “tiger by the tail” approach (keep printing even as inflation accelerates) and ultimately destroy the value of money and savings while uprooting the basic stability of their societies….
Printing money by the trillions of dollars has had the predictable effect of raising the prices of stocks and bonds and thus reducing the cost of servicing government debt…. But it is like an addictive drug, and we have a hard time imagining the slowing or stopping of QE without large adverse impacts on the prices of stocks and bonds and the performance of the economy….
At some stage, central banks inevitably realize, regardless of whether they admit the catastrophic nature of their own failings, that the cessation of money-printing will cause an instant depression. Even though at that point the cessation of money-printing may be the only action capable of saving society, that becomes a secondary consideration compared to the desire to avoid immediate pain and blame. The world’s central banks are in very deep with QE at present, and the risks continue to build with every new purchase of stocks and bonds with newly-printed money….
There are many current theories as to why the price of gold had been drifting down and then collapsed in mid-April. We are trying to sort out various possible explanations, but we urge investors to be cautious in their thinking about what circumstances would likely cause gold to rise or fall sharply. The correlations with other assets in various scenarios (risk on or off, economic normalization, inflation, the rise and fall of interest rates, euro collapse) may shift abruptly as the macro picture evolves. Many people think that if stock markets continue rising, and/or if the U.S. and Europe restore normal levels of growth and employment, then the rationale for owning gold is weakened or destroyed. This perception may be correct, and it is certainly a topic that is currently much discussed, but ultimately another set of considerations is likely to dominate.
The world is on a seemingly one-way trip to monetary debasement as the catchall economic policy, and there is only one store of value and medium of exchange that has stood the test of time as “real money”: gold. We expect this dynamic to assert itself in a large way at some point. In the meantime, it is quite frustrating to watch the price of gold fall as the conditions that should cause it to appreciate seem more and more prevalent. Gold may not exactly be a “safe haven” in the sense of an asset whose value is precisely known and stable. But it surely is an asset that, in a particular set of circumstances, becomes a unique and irreplaceable “must-have.” In those circumstances (loss of confidence in governments and paper money), there are no substitutes, and the price of gold may reflect that characteristic at some point.
And Matthew Yglesias:
Hedge fund Bernanke hate: A lot of folks have remarked on the amazing outpouring of hatred for Ben Bernanke's allegedly inflationary monetary policies from the hedge fund set at the recent Sohn Conference, but I don't think anyone's really nailed it. Here's the thing about rich hedge fund guys. They're people. And like other people you may have met, they like money and don't like paying taxes. Where rich people are different is that they have a lot of money, so it's really tempting to say "hey lets take that money and give it to people who need the money more."
Rich people who don't like paying taxes don't like the idea of macroeconomic stabilization policy. That's because it'd convenient for them if the market economy could be not just a practical tool for allocating goods, but an moral framework imbued with deep ethical significance.
And that, in turn, is an idea that sits oddly with the concept that actually you have a bunch of bureaucrats in the Federal Reserve System making the economy plug along. So rich guys indulge fantasies of shifting back to a gold standard or something else that would restore divine right to the monetary system. But beyond that, the central banker they like best is the central banker who's most obscure. Conventional monetary policy was something economists and bond traders paid attention to, but nobody else. Alan Greenspan raising or cutting rates by 25 basis points wasn't a big spectacle. Since the easing (or tightening) was based on interest-rate targeting rather than quantitative monetary creation, you didn't get articles about "printing money". It was all just there in the background.
Ben Bernanke is as if the Wizard of Oz stepped forward from behind the curtain and turned out to be a really powerful wizard. The whole market economy turns out to be an elaborately orchestrated affair, with deep involvement by government central planners who weigh a variety of situations before determining outcomes. In that kind of world, there may still be reasons to eschew certain kinds of tax hikes. But they're practical, pragmatic reasons. They're not moral reasons, in which taxes violate the natural hierarchy of the market because there clearly is no such hierarchy.
Paul Krugman: More on the Roots of Bernanke Hatred:
Matthew O’Brien follows up on the hedge-fund-guys-who-hate Bernanke question, and points out that hedge funds have actually done quite badly for a decade, and especially since the crisis began. He also suggests that what the hedgies really hate isn’t Bernanke so much as the IS-LM framework he (and I) basically work in, and hate it all the more because it has worked so well.
This makes a lot of sense. It’s also worth noting that the named Bernanke-haters — Druckenmiller, Singer — are “bond bubble” guys who we can guess, though without knowing for sure, have spent years shorting Treasuries; and what they have found out is that it’s the equivalent of the “widow maker” trade in Japanese bonds. In fact, some of them may have been making the widow maker trade in Japan too.
So these may well be guys who were absolutely sure that their fiscal-doom investments were going to pay off big, and ended up losing money instead. They could respond to this setback by rethinking, considering the possibility that the academic macro types at the Fed and elsewhere actually had a point. Instead, however, they’re yelling that it’s a rigged market, and that the Fed is destroying Western civilization.
05 May 04:21
Chart of the Day: Yen and 10 Year Interest Rate Differential
by Marc Chandler
By Marc Chandler, Global Head of Currency Strategy, Brown Brothers Harriman
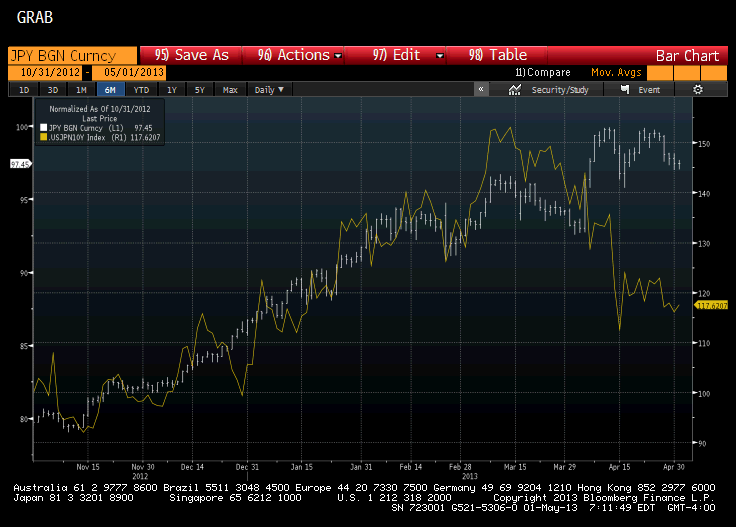
This Great Graphic, we created on Bloomberg, shows the how well the US-Japanese 10-year interest rate differential (yellow line) tracked the dollar’s advance against the yen (bar chart) since the Japanese election was announced in mid-Nov last year.
A divergence opened in April as the US premium fell, but the dollar remained firm. The situation may not clarify itself until after Japan’s Golden Week holiday end early next week.
With poor US economic data, softening inflation, and the Fed still committed to purchases $85 bln of MBS and Treasuries every month, a significant backing up of US interest rates seems unlikely. The 10-year yield may stay below 1.80%, the April high water mark. Evidence that the US economy is slowing, with the risk of a sub-2% pace in Q2, while the core PCE deflator has fallen toward 1% (or lower) and the US 10-year yield can fall toward last year’s low near 1.40%.
For their part, the 10-year JGB yield has steadied in narrow ranges around 60 bp. This is a few basis points above levels that were prevailing when BOJ’s Kuroda unveiled the qualitative and quantitative easing strategy.
After the Golden Week holidays, Japanese institutional investors may begin deploying this year’s investment strategy. However, the idea that the risk-averse investors will be aggressive buyers of US Treasuries and European bonds at or near record lows, with questionable credit quality, is a stretch. While investment outflows may disappoint, inflows may slow as the foreign appetite for Japanese equities wanes after a huge run. Through mid-April, foreign investors have bought nearly $65 bln of Japanese shares.
05 May 04:19


42 stocks closed at all-time lows
by Mike
“It is one of the great paradoxes of the stock market that what seems too high usually goes higher and what seems too low usually goes lower.” – William O’Neil
| Symbol | Price | Volume | Avg. Volume | % Vol. Increase | |
| FRCN |  |
0.0001 | 23454800 | 0 | N/A% |
| AVEO |  |
2.65 | 15230422 | 1636000 | 830.95% |
| XIDE |  |
0.7883 | 6549024 | 1936840 | 238.12% |
| SAPX |  |
0.0038 | 4878624 | 13927700 | -64.97% |
| QID |  |
24.04 | 4416201 | 4755560 | -7.13% |
– Click here for today’s full list –
05 May 04:18
How Can I Measure the Distance between Price and a Moving Average?
by Arthur Hill
Chartists can use the Percent Price Oscillator (PPO) to measure the percentage difference between price and an exponential moving average. The PPO is measures the percentage difference between two exponential moving averages. We can set the shorter EMA equal to one and this will reflect the closing price. We can then set the longer EMA to measure the distance from price (shorter EMA). The example below shows the PPO(1,200,1), which measures the percentage difference between the S&P 500 (1-period EMA) and its 200-day EMA. I set the signal line at one to hide it on this chart. The S&P 500 is currently 8.457% above its 200-day EMA.

Click this image for a live chart.
Click this image for a live chart.
Alexander.didenko likes this
05 May 04:11
Testing Our New Economic Indicators
by Chip Anderson
Hello Fellow ChartWatchers!
As I mentioned last time, we've recently started adding key economic datasets to our database so that you can chart them with our SharpCharts charting tool. This week, we added the weekly Unemployment Indexes including the Initial Jobless Claims number. The symbol for that index is $$UNEMPCIN.
$$UNEMPCIN behaves inversely to the stock market - when the market is doing well, initial jobless claims are falling and vice versa. We can see this directly by charting the inverse index - $ONE:$$UNEMPCIN and overlaying that with the S&P 500. Check out the following chart to see what I mean:
(Click here for a live version of this chart.)
This chart is a monthly line chart. I'm using months instead of weeks to smooth out some of the noisyness of the data.
Now, in addition to the two overlaps price plot lines, I've also added the 12-month Correlation indicator and the 24-month Correlation indicator. As you can see, both of those lines spend most of their time above the zero line in the middle of that plots. That confirms what we can intuitively see - that the red and blue lines move more-or-less in unison (i.e., they are positively correlated).
What's interesting is that points in time where the correlation lines dip below zero. That happens when the red and blue lines start moving in opposite directions. Note that on the 24-month correlation line, those dips correspond with major changes in market direction. Those same signals are on the 12-month Correlation indicator as well, but they aren't quite as easy to pick out. Still, whenever the 12-month Correlation of these two lines dips below zero, it might be time to look for the market to change direction.
- Chip
05 May 04:09
A Meaningful 3 Week Pattern in $COPPER
by Greg Schnell
On a huge macro scale, we are trying to break out of a consolidation range. 13 year. Breaking out on Dow, SP500, Nasdaq, $RUT. Unfortunately, the rest of the globe has not been confirming.
But the 2 days since the Fed announcement since they removed the upside limit on intervention has really changed the shape of the market.
This was a major week for the markets.
Here was a view from April 24. Notice by right clicking on the Perf Chart you can bring up the cycle tool and slide the yellow line, left to right!!!!!! (That 's a new feature!)
Compare that to now.
The $UTIL relative strength line plummeted. That is actually a good thing. The transition to tech leadership this week was particularly acute.
The transports were doing well, now the techs are starting to move. Next should be the industrials and raw materials. So I visited the $COPPER chart.
The 7% move in Copper yesterday was working real hard and I believe a trend change.
Unlike the $INDU market Copper kept climbing from open to close. The $INDU market opened high, climbed slightly and gave back into the close.
There are 7 big green volume candles on the daily JJC. Live Chart
We need to look at the bigger picture in Copper. $COPPER
So one week does not make an all clear and the problems are wider spread than America, so its still cautionary. But in 7 trading days things have clearly reversed.
It's pretty important timing in the market as normally a summer swoon sets in. This week and the change of behaviour to the growth side of the cycle is very encouraging for me.
We also made a confirming move above the $SPX 1597,$TRAN, $RUT, $INDU, $TYX. We are still in a dicey spot on the charts. But when you are looking for technical signals, we got a bag of confirmations this week. Short term we might have run a bit too far, too fast. Big picture, we got some great signs this week. $COPPER's change was huge in my mind.
Good Trading,
Greg Schnell, CMT
04 May 22:29


128 Years of Dow Components
by Barry Ritholtz
Want to know what has been in the Dow Jones Industrials over the past century and change? Click thru for an interactive chart that shows the full history of the Grandpappy all of indexes.
128 years of the Dow — what’s in and what’s out
click for interactive chart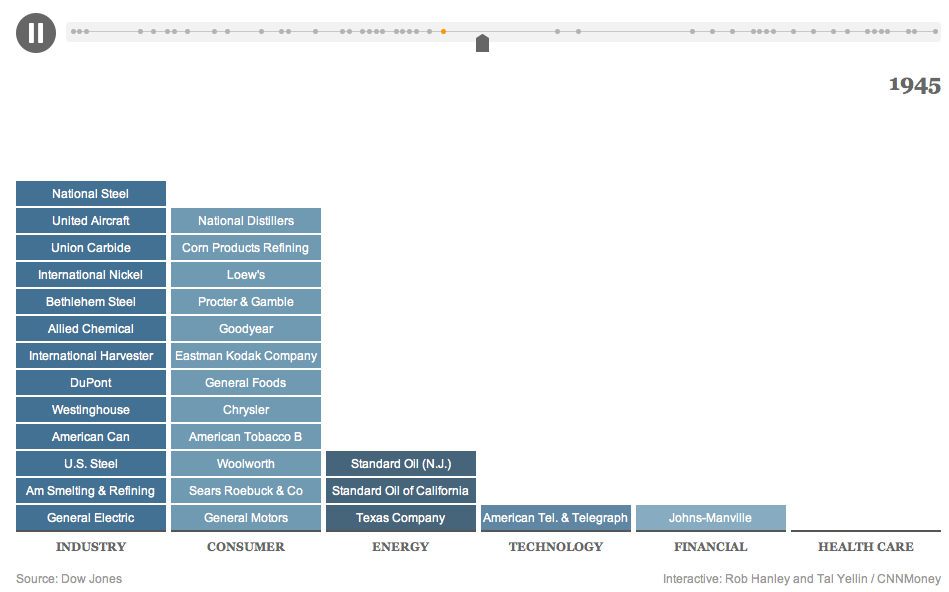
Source: CNNMoney
Hat tip Tal Yellin
04 May 22:28


Every Genre of Music. Graphed and Sampled
by Barry Ritholtz
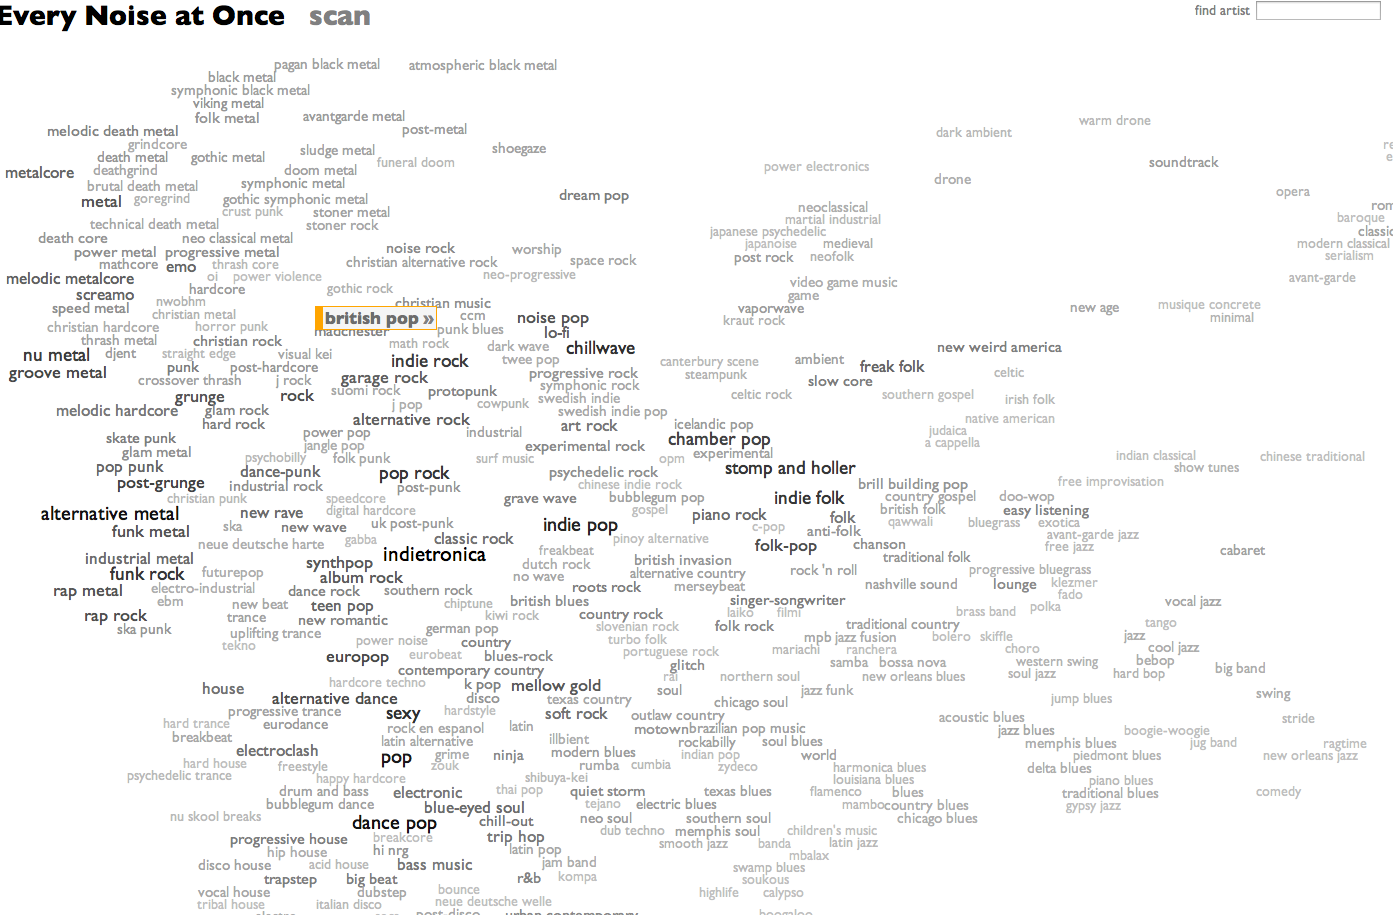
Crazy cool interactive graph of all musical genres, including samples for every example. Looks like it required a Herculean amount of labor.
(note it worked better on IE/Safari than Firefox)
click for interactive site
Source: Furia via boingboing
04 May 21:29
Package CLAG updated to version 2.10 with previous version 2.7 dated 2013-04-30
Title: CLAG: an unsupervised non hierarchical clustering algorithm
handling biological data
Description: CLAG (for CLusters AGgregation) is an unsupervised non
hierarchical clustering algorithm designed to cluster a large
variety of biological data and to provide a clustered matrix
and numerical values indicating cluster strength. CLAG
clusterizes correlation matrices for residues in protein
families, gene-expression and miRNA data related to various
cancer types, sets of species described by multidimensional
vectors of characters, binary matrices. It does not ask to all
data points to cluster and it converges yielding the same
result at each run. Its simplicity and speed allows it to run
on reasonably large datasets.
Author: Linda DIB, Raphael CHAMPEIMONT, Alessandra CARBONE
Maintainer: Raphael CHAMPEIMONT
Diff between CLAG versions 2.7 dated 2013-04-30 and 2.10 dated 2013-05-02
 CLAG-2.10/CLAG/DESCRIPTION                |   12 +++++-------
 CLAG-2.10/CLAG/LICENSE                    |only
 CLAG-2.10/CLAG/MD5                        |   28 ++++++++++++++++------------
 CLAG-2.10/CLAG/NAMESPACE                  |    1 -
 CLAG-2.10/CLAG/NEWS                       |    7 +++++++
 CLAG-2.10/CLAG/R/CLAG.R                   |   18 ++++++++++++------
 CLAG-2.10/CLAG/data                       |only
 CLAG-2.10/CLAG/inst/doc/CLAG-tutorial.Rnw |   10 +++++-----
 CLAG-2.10/CLAG/inst/doc/CLAG-tutorial.pdf |binary
 CLAG-2.10/CLAG/man/BREAST.Rd              |only
 CLAG-2.10/CLAG/man/CLAG.clust.Rd          |    8 ++++----
 CLAG-2.10/CLAG/man/DIM128.Rd              |only
 CLAG-2.10/CLAG/man/DIM128_subset.Rd       |only
 CLAG-2.10/CLAG/man/GLOBINE.Rd             |only
 CLAG-2.7/CLAG/inst/extdata                |only
 CLAG-2.7/CLAG/man/CLAG.loadExampleData.Rd |only
 16 files changed, 49 insertions(+), 35 deletions(-)
04 May 21:29
How R Grows
by Joseph Rickert
(This article was first published on Revolutions, and kindly contributed to R-bloggers)
R-bloggers.com offers daily e-mail updates about R news and tutorials on topics such as: visualization (ggplot2, Boxplots, maps, animation), programming (RStudio, Sweave, LaTeX, SQL, Eclipse, git, hadoop, Web Scraping) statistics (regression, PCA, time series,ecdf, trading) and more...
by Joseph Rickert
Saturday morning I was drinking my coffee wondering how much effort goes into R worldwide. (It’s my job.) I noticed that there were 4469 packages on CRAN, and it occurred to me that tabulating the packages by publication date would give some indication of how much effort is being expended to improve packags and keep them up to date. With very little work at all I was able to read the table on the Available CRAN packages by date of publication page and produce this plot.
Maybe I should not have been, but I was surprised to see that most CRAN packages were either created or updated in the last year or so. Apparently, only 264 packages haven’t been touched since 2010 or before. (If you are ever worried about whether an older package is going to work for you, go to the CRAN checks page for the package and look at the notes. For example, the CRAN check for vioplot, the current longevity record holder, look just fine to me .)
This is astounding! Like most people, I suppose, I tend to use only a small number of packages on a regular basis. I’m clueless about what most of the other packages do, and don’t think much about them. But they are all meaningful to somebody, probably thousands of somebodies, and a tremendous number of hours are being spent to keep them current and improve them. So the next time a colleague refers to R itself as a “statistical package” find a way to make this point: “Package” sounds so small, “wrapped up”, and done, but R is never done, it is a language that is constantly changing, improving and increasing its expressive power through the ongoing efforts a global, large scale engineering effort. The success of R is in no small part due to the mechanism that the R core group implemented to enhance the language through the parallel, asynchronous efforts of the package developers.
A little munging (download packages-post.r) on the CRAN Package Check Results page shows that there are at least 2,596 package maintainers active now. Since many packages have multiple authors this number is probably way less than the number of package developers. Nevertheless, it gives some idea, a lower bound, on the number of people that are actively involved in creating and maintaining R packages. Also, I might be wrong, but I am guessing that people who volunteer to maintain a package are also involved in improving it. So the following plot that lists the developers who are maintaining at least 10 packages must be the trace of untold hours of “after hours”, solitary work. I think we all owe a tremendous debt of gratitude to these R superstars and all the other package developers. After all, it’s not their job.
R-bloggers.com offers daily e-mail updates about R news and tutorials on topics such as: visualization (ggplot2, Boxplots, maps, animation), programming (RStudio, Sweave, LaTeX, SQL, Eclipse, git, hadoop, Web Scraping) statistics (regression, PCA, time series,ecdf, trading) and more...
04 May 21:28
Package copulaedas updated to version 1.3.0 with previous version 1.2.1 dated 2013-01-11
Title: Estimation of Distribution Algorithms Based on Copulas
Description: This package intends to provide a platform where EDAs
(Estimation of Distribution Algorithms) based on copulas can be
implemented and studied. It contains complete implementations
of various EDAs based on copulas and vines and also offers the
possibility of implementing new algorithms that can be
integrated into the package. EDAs are implemented using S4
classes with generic functions for its main parts: seeding,
selection, learning, sampling, replacement, local optimization,
termination, and reporting. The package also provides a group
of well-known benchmark problems and utility functions to study
the behavior of EDAs.
Author: Yasser Gonzalez-Fernandez and
Marta Soto
Maintainer: Yasser Gonzalez-Fernandez
Diff between copulaedas versions 1.2.1 dated 2013-01-11 and 1.3.0 dated 2013-05-02
 DESCRIPTION                    |   18 ++++-----
 MD5                            |   68 +++++++++++++++++------------------
 NEWS                           |   22 +++++++----
 R/CEDA.R                       |    8 ++--
 R/EDA.R                        |    4 +-
 R/VEDA.R                       |   14 ++++---
 R/edaCriticalPopSize.R         |    4 +-
 R/edaIndepRuns.R               |    4 +-
 R/edaOptimize.R                |    4 +-
 R/edaReplace.R                 |   16 ++++----
 R/edaReport.R                  |    4 +-
 R/edaRun.R                     |    4 +-
 R/edaSeed.R                    |    4 +-
 R/edaSelect.R                  |    4 +-
 R/edaTerminate.R               |    4 +-
 R/margins.R                    |    4 +-
 R/problems.R                   |    4 +-
 inst/CITATION                  |    8 ++--
 inst/doc/copulaedas-manual.pdf |binary
 man/CEDA-class.Rd              |   20 +++++-----
 man/EDA-class.Rd               |    4 +-
 man/EDAResult-class.Rd         |    4 +-
 man/EDAResults-class.Rd        |    4 +-
 man/VEDA-class.Rd              |   78 ++++++++++++++++++++++++++---------------
 man/edaCriticalPopSize.Rd      |    8 ++--
 man/edaIndepRuns.Rd            |    6 ++-
 man/edaOptimize.Rd             |    6 ++-
 man/edaReplace.Rd              |    4 +-
 man/edaReport.Rd               |    4 +-
 man/edaRun.Rd                  |   12 +++---
 man/edaSeed.Rd                 |    4 +-
 man/edaSelect.Rd               |    4 +-
 man/edaTerminate.Rd            |    2 -
 man/margins.Rd                 |    6 ++-
 man/problems.Rd                |   16 ++++----
 35 files changed, 220 insertions(+), 160 deletions(-)
04 May 21:28
New package bigRR with initial version 1.3-6
Package: bigRR
Type: Package
Title: Generalized Ridge Regression (with special advantage for p >> n cases)
Version: 1.3-6
Date: 2013-04-29
Author: Xia Shen, Moudud Alam and Lars Ronnegard
Maintainer: Xia Shen
Description: The package fits large-scale (generalized) ridge regression for various distributions of response. The shrinkage parameters (lambdas) can be pre-specified or estimated using an internal update routine (fitting a heteroscedastic effects model, or HEM). It gives possibility to shrink any subset of parameters in the model. It has special computational advantage for the cases when the number of shrinkage parameters exceeds the number of observations. For example, the package is very useful for fitting large-scale omics data, such as high-throughput genotype data (genomics), gene expression data (transcriptomics), metabolomics data, etc.
Depends: R (>= 2.10), hglm
License: GPL (>= 2)
LazyLoad: yes
Packaged: 2013-05-02 08:18:18 UTC; xia
NeedsCompilation: no
Repository: CRAN
Date/Publication: 2013-05-02 19:40:26
Type: Package
Title: Generalized Ridge Regression (with special advantage for p >> n cases)
Version: 1.3-6
Date: 2013-04-29
Author: Xia Shen, Moudud Alam and Lars Ronnegard
Maintainer: Xia Shen
Description: The package fits large-scale (generalized) ridge regression for various distributions of response. The shrinkage parameters (lambdas) can be pre-specified or estimated using an internal update routine (fitting a heteroscedastic effects model, or HEM). It gives possibility to shrink any subset of parameters in the model. It has special computational advantage for the cases when the number of shrinkage parameters exceeds the number of observations. For example, the package is very useful for fitting large-scale omics data, such as high-throughput genotype data (genomics), gene expression data (transcriptomics), metabolomics data, etc.
Depends: R (>= 2.10), hglm
License: GPL (>= 2)
LazyLoad: yes
Packaged: 2013-05-02 08:18:18 UTC; xia
NeedsCompilation: no
Repository: CRAN
Date/Publication: 2013-05-02 19:40:26
04 May 21:26

MCMC for non-linear state space models using ensembles of latent sequences. (arXiv:1305.0320v1 [stat.CO])
by Alexander Y. Shestopaloff, Radford M. Neal
Non-linear state space models are a widely-used class of models for biological, economic, and physical processes. Fitting these models to observed data is a difficult inference problem that has no straightforward solution. We take a Bayesian approach to the inference of unknown parameters of a non-linear state model; this, in turn, requires the availability of efficient Markov Chain Monte Carlo (MCMC) sampling methods for the latent (hidden) variables and model parameters. Using the ensemble technique of Neal (2010) and the embedded HMM technique of Neal (2003), we introduce a new Markov Chain Monte Carlo method for non-linear state space models. The key idea is to perform parameter updates conditional on an enormously large ensemble of latent sequences, as opposed to a single sequence, as with existing methods. We look at the performance of this ensemble method when doing Bayesian inference in the Ricker model of population dynamics. We show that for this problem, the ensemble method is vastly more efficient than a simple Metropolis method, as well as 1.9 to 12.0 times more efficient than a single-sequence embedded HMM method, when all methods are tuned appropriately. We also introduce a way of speeding up the ensemble method by performing partial backward passes to discard poor proposals at low computational cost, resulting in a final efficiency gain of 3.4 to 20.4 times over the single-sequence method.
04 May 21:25

Learning Mixtures of Bernoulli Templates by Two-Round EM with Performance Guarantee. (arXiv:1305.0319v1 [stat.ML])
by Adrian Barbu, Ying Nian Wu, Song Chun Zhun
Dasgupta showed that a two-round variant of the EM algorithm can learn mixture of Gaussian distributions with near optimal precision with high probability if the Gaussian distributions are well separated and if the dimension is sufficiently high. In this paper, we generalize their theory to learning mixture of high-dimensional Bernoulli templates. Each template is a binary vector, and a template generates examples by randomly switching its binary components independently with a certain probability. In computer vision applications, a binary vector is a feature map of an image, where each binary component indicates whether a feature or structure is present or absent within a certain cell of the image domain. A Bernoulli template can be considered a statistical model for images of objects (or parts of objects) from the same category. We show that the two-round EM algorithm can learn mixture of Bernoulli templates with near optimal precision with high probability, if the Bernoulli templates are sufficiently different and if the number of features is sufficiently high. We illustrate the theoretical results by synthetic and real examples.
04 May 21:25

Model Selection for High-Dimensional Regression under the Generalized Irrepresentability Condition. (arXiv:1305.0355v1 [math.ST])
by Adel Javanmard, Andrea Montanari
In the high-dimensional regression model a response variable is linearly related to $p$ covariates, but the sample size $n$ is smaller than $p$. We assume that only a small subset of covariates is `active' (i.e., the corresponding coefficients are non-zero), and consider the model-selection problem of identifying the active covariates. A popular approach is to estimate the regression coefficients through the Lasso ($\ell_1$-regularized least squares). This is known to correctly identify the active set only if the irrelevant covariates are roughly orthogonal to the relevant ones, as quantified through the so called `irrepresentability' condition. In this paper we study the `Gauss-Lasso' selector, a simple two-stage method that first solves the Lasso, and then performs ordinary least squares restricted to the Lasso active set. We formulate `generalized irrepresentability condition' (GIC), an assumption that is substantially weaker than irrepresentability. We prove that, under GIC, the Gauss-Lasso correctly recovers the active set.
04 May 21:24
New package dma with initial version 1.2-0
Package: dma
Type: Package
Title: Dynamic model averaging
Version: 1.2-0
Date: 2013-05-2
Author: Tyler H. McCormick, Adrian Raftery, David Madigan
Maintainer: Hana Sevcikova
Description: Dynamic model averaging for binary and continuous outcomes.
Suggests: MASS, mnormt
License: GPL-2
LazyLoad: yes
Packaged: 2013-05-03 03:09:17 UTC; hana
NeedsCompilation: no
Repository: CRAN
Date/Publication: 2013-05-03 08:16:31
Type: Package
Title: Dynamic model averaging
Version: 1.2-0
Date: 2013-05-2
Author: Tyler H. McCormick, Adrian Raftery, David Madigan
Maintainer: Hana Sevcikova
Description: Dynamic model averaging for binary and continuous outcomes.
Suggests: MASS, mnormt
License: GPL-2
LazyLoad: yes
Packaged: 2013-05-03 03:09:17 UTC; hana
NeedsCompilation: no
Repository: CRAN
Date/Publication: 2013-05-03 08:16:31