Shared posts
Trump says he’s willing to ‘risk’ giving up rights as he pushes to extend a surveillance law.
50% Transfer Bonus From Ultimate Rewards To Marriott
I logged into Chase Ultimate Rewards today to make a transfer and noticed a new item at the top of the transfer page: I hadn’t seen this elsewhere so figured it was worth mentioning. True to form, the T&C show that you can receive a 50% transfer bonus when you transfer Ultimate Rewards points to Marriott Bonvoy right now. There doesn’t appear to be a limit to the number of points you can transfer. The bonus runs through May 15th, 2023. Is It Worth It To Transfer Ultimate Rewards Points [...]
The post 50% Transfer Bonus From Ultimate Rewards To Marriott appeared first on Pizza In Motion.

Weathering 10 Days With COVID In Hotels
I spent 10 days in hotels quarantining with COVID-19 to keep my family safe. Along the way I learned why hotel life in limited service and extended hotels leaves much to be desired.
The post Weathering 10 Days With COVID In Hotels appeared first on Pizza In Motion.

Carnival Opts In for New CDC Cruise Program; Mask Requirement Dropped

Carnival Cruise Line today confirmed that it will participate in the U.S. Centers for Disease Control and Prevention (CDC) updated program for cruise ships operating in U.S. waters, and is advising guests of the following changes:
- Effective with cruises departing Mar. 1, masks onboard will be recommended but not required. There may, however, be certain venues and events where masks will be required.
- Carnival will continue to meet the standard of vaccinated cruises, but children under five years old will not be included in any vaccinated guest calculation, and thus will not be required to receive an exemption to sail
- Effective with cruises departing Mar. 1, some additional flexibility in pre-cruise testing requirements will become available.
"We have had a very successful restart of guest operations thanks to the support of our guests, the commitment of our shipboard team, and the effective protocols we have put in place,” said Christine Duffy, president of Carnival Cruise Line. “The public health situation has continued to improve, providing confidence about these changes. Our protocols will evolve as we continue to remain dedicated to protecting the public health of our guests, crew and the communities we visit.”
Duffy said that Carnival’s highest responsibility and top priority is always compliance, environmental protection, and the health, safety and well-being of our guests, the people in the communities we touch and serve, and our shipboard and shoreside personnel. “We appreciate the ongoing collaboration among multiple government agencies, as well as the support of Alaska officials and other delegations,” she added.
‘General Hospital’ and ‘Iron Man’ Animated Series Actor John Reilly Dies at 84

‘General Hospital‘ and ‘Iron Man‘ Animated Series Actor John Reilly Dies at 84. According to his family, Actor John Reilly has passed away at age 84. Marvel fans would know Reilly best for his work on the animated 90’s Iron Man series as the voice of Clint Barton/Hawkeye. John also held an impressively long career on the television series General Hospital from 1984 through 2013.
John’s daughter Caitlin shared the news of his passing via Instagram with a photo of her and her father along with the caption, “John Henry Matthew Reilly AKA Jack. The brightest light in the world has gone out. Imagine the best person in the world. Now imagine that person being your dad. I’m so grateful he was mine. I’m so grateful I got to love him. I’m so grateful I made it in time to hold him and say goodbye. I honestly don’t know what I’m going to do, but I know he’ll be with me. I love you forever Daddy.”
Our deepest condolences go out to John Reilly’s family, friends, and fans at this time 
Be sure to check back here at Chip and Co. for all things Marvel
Featured Photo Credit: Aaron Montgomery/jpistudios.com
Source: ComicBook
The post ‘General Hospital’ and ‘Iron Man’ Animated Series Actor John Reilly Dies at 84 appeared first on Chip and Company.
A Guide to the Most Unique Spots in Tokyo
Tokyo is a city of superlatives — a place where ancient tradition and cutting-edge modernity live side by side. Neon lights bathe entire neighborhoods in a Technicolor glow, while centuries-old shrines sit quietly around the corner.
The city pulses with creativity, from a culinary scene that spans Michelin-starred sushi counters to ramen shops tucked down narrow alleys, to fashion districts that set global trends, to a cyberpunk-inspired nightlife straight out of a dreamscape.

It’s time to explore the buzz of Tokyo. (Photo Credit: Ryoji Iwata)

Tokyo Tower shines bright against the city’s endless horizon. (Photo Credit: Yusheng Deng)
Beyond the bustling streets, natural escapes are never far — hop a train to mountain trails, wander serene bamboo forests, or retreat to tranquil gardens that feel worlds away from the skyscrapers above.
With one of the most efficient rail systems on the planet, it’s easy to uncover every layer of Tokyo’s personality, from the iconic to the unexpected. Here’s our guide to the city’s most unique spots.
Golden Gai: Tokyo’s After-Dark Wonderland
Golden Gai isn’t the kind of night you map out in advance — it’s best experienced on a whim. Tucked into six narrow alleys laced with crooked staircases, this nightlife enclave crams more than 200 quirky, one-of-a-kind bars into a few city blocks.

Of Golden Gai’s six alleys and 200 bars, which one will you choose? (Photo Credit: @katy)
Each of the neighborhood’s unique gems is a world unto itself: One might be blasting 80s punk, another screening cult films, and another serving as a haven for artists, musicians, writers, and the occasional celebrity.
Starting around 9 pm, the neighborhood buzzes with energy. Leave your camera in your pocket (photography and video are discouraged), carry a bit of cash for cover charges, and savor the chance to soak it all in the old-fashioned way.
TeamLab: Tokyo’s Immersive Digital Dreamscape
What began in 2001 as a small interdisciplinary collective of artists, architects, animators, and designers has transformed into one of the most celebrated cultural phenomena in the world. The mission of TeamLab was simple yet ambitious: To reimagine the relationship between people and art through the lens of technology.

Step into a dreamscape at TeamLab, where art and technology collide. (Photo Credit: Note Thanun)
Inside, expect to be surrounded by floor-to-ceiling installations that respond to your presence — flowers bloom at your feet, galaxies swirl above your head, and waves of color shift with every movement. Each 360-degree exhibit blends light, sound, and sensation into an experience that’s equal parts art installation, science experiment, and playground for the imagination.
It’s as Instagram-worthy as it is thought-provoking, with rotating exhibits ensuring that no two visits are ever alike — just remember to reserve tickets in advance.
Onsens: Tokyo’s Take on the Classic Hot Spring
Japan’s volcanic landscape gifts the country with thousands of natural hot springs, or onsens, each offering its own mood — from rustic outdoor baths to sleek urban retreats, private escapes to bustling communal pools. No matter your preference, there’s an onsen experience to match every personality.

Soak away the city buzz in a serene Tokyo onsen. (Photo Credit: Nichika Sakurai)
For a first dip in Tokyo, head to Toshimaen Niwa no yu, a serene bathhouse open until 11 pm — perfect for a late-night soak. Here, mineral-rich waters drawn from natural springs flow into multiple pools, complemented by a Bade Pool, steam saunas, a full-service restaurant, and tranquil views of manicured Japanese gardens.
Keep in mind that many onsens have age restrictions (typically 13 and up) and enforce strict tattoo policies. Small tattoos can often be covered with bandages, or you can seek out one of the growing number of tattoo-friendly onsens around Tokyo.
Convenience Store Cuisine: Tokyo’s Best-Kept Secret
Tokyo is a culinary playground, and we encourage you to savor it all — from steaming bowls of ramen and crispy tempura to donburi rice bowls, fresh nigiri, izakayas, hole-in-the-wall gems, train station eats, and Michelin-starred splurges. When you want to keep things casual or just grab tasty souvenirs, Japan’s convenience stores — known as konbini — are your secret weapon.

Bento boxes are proof that Tokyo’s best bites can be found at a corner shop. (Photo Credit: Chloe Lefleur)
Step into a 7-Eleven or FamilyMart and you’ll find shelves lined with surprisingly delicious options: Fresh bento boxes, perfectly wrapped onigiri (stuffed with fillings like pickled plum or tuna), endless varieties of instant ramen, hot snacks such as yakitori skewers, and an array of sweet and savory filled breads.
Best of all, microwaves are right there in the store, so you can heat and enjoy your finds on the spot. It’s fast, flavorful, and uniquely Japanese.
Where to stay: Kimpton Shinjuku Tokyo
The post A Guide to the Most Unique Spots in Tokyo appeared first on Life is Suite.
Justice Department Is Scrutinizing Takeover of Credit Karma by Intuit, Maker of TurboTax
by Justin Elliott and Paul Kiel
ProPublica is a nonprofit newsroom that investigates abuses of power. Sign up to receive our biggest stories as soon as they’re published.
The Department of Justice is scrutinizing Silicon Valley giant Intuit’s $7 billion takeover attempt of Credit Karma, an upstart personal finance firm that became a competitor when it launched a free tax prep offering that challenges Intuit’s TurboTax product.
The probe comes after ProPublica first reported in February that antitrust experts viewed the deal as concerning because it could allow a dominant firm to eliminate a competitor with an innovative business model. Intuit already dominates online tax preparation, with a 67% market share last year. The article sparked letters from Sen. Ron Wyden, D-Ore., and Rep. David Cicilline, D-R.I., urging the DOJ to investigate further. Cicilline is chair of the House Judiciary Committee’s antitrust subcommittee.
Government lawyers worry that allowing Intuit to snuff out a promising startup could harm American consumers seeking free tax prep options, according to a June memo from the company side that describes Intuit’s legal strategy, which was obtained by ProPublica.
The government is particularly interested in “the influence that Intuit’s purchase of Credit Karma will have on consumer tax preparation platforms and [the] software market,” according to the memo.
At this stage of the government’s review, the DOJ has requested more information from the companies, according to Intuit securities filings. After Intuit and Credit Karma respond, the government will decide whether to seek to block the deal.
Chris Sagers, an antitrust expert at the Cleveland-Marshall College of Law, said it appeared that Intuit was seeking the deal to eliminate a competitor. It reminded him of the “copy-acquire-kill” strategy that lawmakers criticized Facebook for at landmark antitrust hearings on Capitol Hill last week. “It won’t be lost on the DOJ staff lawyers that it is likely Intuit’s motive,” Sagers said.
An Intuit spokesman didn’t answer questions about the memo but said in a statement that: “By joining forces with Credit Karma, we plan to create a personalized financial assistant that will help consumers find the right financial products that put more money in their pockets. This is a benefit neither company could easily achieve on their own.”
He added: “This combination is not about tax. We are confident in the clear consumer and competitive benefits of our combination and look forward to continued engagement with regulators.”
The DOJ declined to comment. Credit Karma did not respond to a request for comment.
As part of its probe of the deal, the government is also asking Intuit for more information about its participation in the Free File program, under which TurboTax and other tax prep companies are supposed to offer free tax filing options to most Americans. As ProPublica has reported, millions of Americans eligible for the free services end up paying for tax prep anyway, often because of industry marketing efforts to steer them toward paid options.
In 2017, Credit Karma became the only major new entrant to the online tax prep business in over a decade. Its model threatened to upend the industry. The company offers a suite of free financial services (like credit monitoring) to its more than 100 million members and then makes money by using their data to pitch them credit cards and other financial products. Credit Karma’s tax prep product was just another way to draw in more user data.
Credit Karma boasted that it “never” charged for tax prep, even for services that “could cost over $200 when filing with TurboTax.” It was a departure from the model that had shaped the tax prep industry since the mid-2000s: advertise “free” tax prep in order to draw in new customers, and then use a variety of tactics to make as many users as possible pay. TurboTax is the undisputed master of the craft.
Credit Karma is a distant threat to TurboTax’s dominance — the company filed 40 million returns last year — but the relative newcomer ranks as the fifth-largest provider of online tax filing and has been growing rapidly.
Intuit already is considering a strategy to placate the DOJ to win approval for the deal: offering to spin off Credit Karma’s tax preparation product and sell it to another company, according to the memo. Such remedies are common. The logic is that if two companies seeking to merge have some overlapping business lines, those are sold off to a third party in order to preserve competition that the merger would otherwise extinguish.
But selling off the business, known as a divestiture, might not be enough, the memo acknowledges. That’s because Credit Karma’s tax prep product might not be able to survive as a potent competitor once it is spun off.
“Credit Karma offers its tax preparation business for free, primarily to generate business to its consumer finance platform,” the memo notes. “In order for DOJ to accept the divestiture remedy, the agency will need to be satisfied that Credit Karma’s tax preparation business will be viable when separated from Credit Karma’s robust consumer finance platform.”
Some antitrust experts view divestitures with skepticism because of instances in which they have fallen apart. In one notorious case, the government allowed supermarket chains Safeway and Albertsons to merge on the condition that they sell off stores in 130 local markets around the country. Just months after the deal went through, the small firm that bought the divested stores went bankrupt. Albertsons bought some of them back during the bankruptcy process.
“I’d be hesitant to rely on a divestiture in any deal where there’s serious anti-competitive risk,” Sagers said.
Merger enforcement has declined under the Trump administration in general. And the Antitrust Division, led by Assistant Attorney General Makan Delrahim, has accepted some controversial mergers on the basis of divestitures, including the Sprint-T-Mobile deal.
The department’s guidelines state that, to pass muster, a divestiture must include all business assets that would allow the third-party purchaser “to be an effective, long-term competitor.”
The timeline for the DOJ’s investigation is not clear. In Intuit’s most recent public statements, the company said it expects the deal to close in the second half of 2020.
Do you have access to information about Intuit or Credit Karma that should be public? Reach Justin Elliott by email at justin@propublica.org or via Signal at 774-826-6240. Here’s how to send tips and documents to ProPublica securely.
Where people in our region are filling out the census, and where they’re not, in 12 maps

This article was first published by the DC Policy Center.
About 95% of US households will fill out their 2020 census information using forms mailed to their house that they will reply to via the internet, phone, or mail. In the Washington region, the self-response rate from these forms varies greatly depending on location, density, race, population, and income.
What are census self-response rates?
The US Census Bureau is currently engaged in counting every person who lives in the United States as part of the 2020 Decennial Census. However, not everyone is counted in the same way: the Census uses different methods to count people living in traditional households, in group quarters (such as dorms, nursing homes, and military barracks), and in transitory locations (such as work camps and homeless encampments).
While a small number of households in remote areas — largely in Alaska and northern Maine — and Native American communities that opt-in, are directly counted by Census personnel, and 5% of households — largely rural ones that either do not receive mail delivery or where mailing address information cannot be verified — have Census forms left at their residences by Census personnel, roughly 95% of American households—including essentially all households in the Washington region —are in “self-response enumeration areas,” or places where Census forms are mailed to all housing units, and households are required to reply by internet, phone, or mail.
Although “Census Day” was April 1, only 57% of households in self-response areas nationwide have completed their Census forms. Normally, 45 days later, on May 13, Census personnel would begin visiting housing units that had not submitted responses — whether because they were vacant or because households had not received or had ignored their Census forms — to collect responses in person.
However, the COVID-19 pandemic forced the Census Bureau to suspend all field operations on March 18, which at the time meant hand-delivering Census forms to households without mail delivery. This delivery, which restarted the week of May 4, does not require direct interaction with residents, but it is not clear when it will be safe for Census personnel to begin performing follow-up visits to collect responses in person, which makes it particularly important that people submit their Census forms as soon as possible.
Cumulative Census self-response rates as of May 4, 2020, displayed by 2020 Census tract. Tracts with large numbers of group-quarters residents have been removed. Data source: https://2020census.gov/en/response-rates.html Image by the author.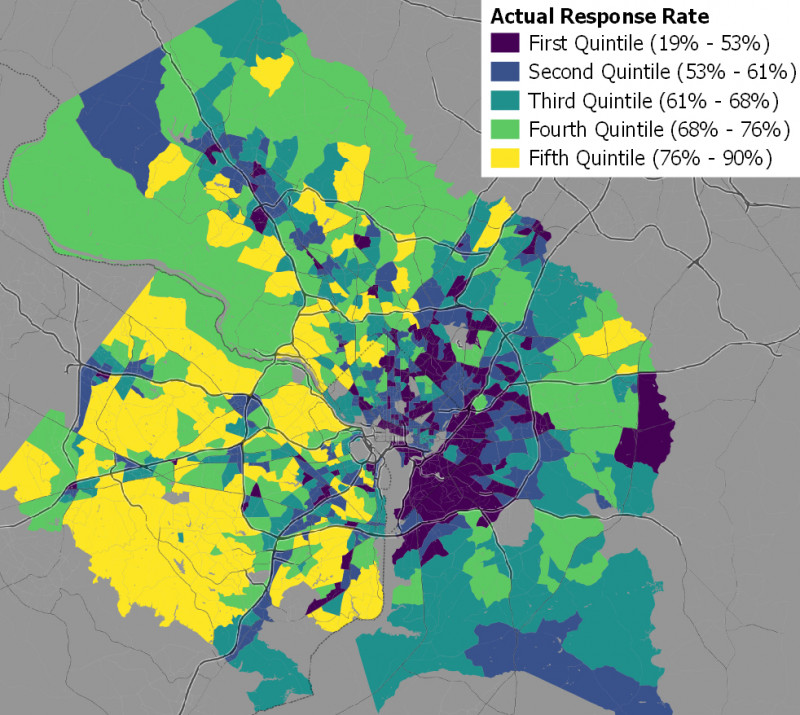
Looking at census self-response rates across the region
To allow communities to keep track of the response rates for self-response Census forms, the Census Bureau currently provides a map of 2020 Census self-response rates by state, county, city, and Census tract on its website. While this map shows that the average response rate for the Washington region is 64%, higher than the national rate of 57%, there are major differences in the rate across different places within the region.
Population density of 2010 Census tracts. Tracts with large numbers of group-quarters residents have been removed. Data source: 2018 American Community Survey 5-year estimates. Image by the author.
Self-response rates in the Washington region are highest — sometimes as high as 80% — in low-density suburban communities in Fairfax County, in Arlington County north of I-66, and in some lower-density portions of Montgomery County. They are lowest — sometimes lower than 50% — in Northeast and Southeast DC; and in low-income and largely minority communities (which I define here as places where the population is less than 50% non-Hispanic white), in Prince George’s County inside the Beltway.
Households that moved into their homes in 2015 or later, by 2010 Cencus tracts. Tracts with large numbers of group-quarters residents have been removed. Data source: 2018 American Community Survey 5-year estimates. Image by the author.
Linear regression comparing self-response rates to 2018 American Community Survey data for the Washington region confirms that there are statistically significant relationships between low self-response rates, population density, median household income, the fraction of residents who are racial and ethnic minorities, the fraction of households that moved into their current home after 2014, and the fraction of households that have low English proficiency.
Median household income, by 2010 Census tracts. Tracts with large numbers of group-quarters residents have been removed. Data source: 2018 American Community Survey 5-year estimates. Image by the author.
The fraction of households that have submitted their Census self-response forms in each Census tract increased by 1 percentage point for every:
- Increase in median household income (by $13,000)
- Decrease in the share of minority residents (by 7 percentage points)
- Decrease in population density (by 1,100 residents per square mile)
- Decrease in the share of recently-moved households (by 3 percentage points)
- Decrease in the share of low-English proficiency households (by 7 percentage points).
Households with limited English proficiency, by 2010 Census tracts. Tracts with large numbers of group-quarters residents have been removed. Data source: 2018 American Community Survey 5-year estimates. Image by the author.
This means that parts of the region with higher population densities and higher concentrations of disadvantaged groups such as racial and ethnic minorities, lower-income households, and people with limited English proficiency are in danger of being undercounted in the 2020 Census, especially if the coronavirus pandemic limits the Census Bureau’s ability to conduct follow-up visits.
Census Bureau predictions of total self-response rates by 2010 Census tracts. Tracts with large numbers of group-quarters residents have been removed. Data source: https: //www.censushardtocountmaps2020.us/ Image by the author.
Self-response rates are worse than predicted in some communities
That disadvantaged neighborhoods were likely to have lower self-response rates and be more difficult for the Census to count did not come as a surprise to the Census Bureau or to local governments. As Mike Maciag wrote for the DC Policy Center last November, neighborhoods in the region with low median incomes and high concentrations of Black and immigrant residents — particularly east of the Anacostia River in DC and in Prince George’s County — were expected to have lower self-response rates.
Ratio of actual to Census Bureau predicted self-response rates by 2010 Census tracts. Tracts with large number of group-quarters residents have been removed. Data sources: https://2020census.gov/en/response-rates.html and https: //www.censushardtocountmaps2020.us/ Image by the author.
However, by comparing the actual self-response rates as of May 4 2020 with the Census Bureau’s predicted self-response rates, I found that many of the neighborhoods that were predicted to have low response rates are doing particularly badly compared to the Census Bureau’s predictions.
Tracts with actual self-response rates that are less than 75% of what was predicted are concentrated in the District — especially east of the Anacostia — and in Prince George’s County inside the Beltway, as well as in the vicinities of several college campuses, including the University of Maryland and American University.
A linear regression found that the ratio of actual to expected self-responses increased by 1 percentage point for every:
- Increase in median household income (by $21,000)
- Decrease in the share of minority residents (by 11 percentage points)
- Decrease in population density (by 10,000 residents per square mile)
- Decrease in the share of recently-moved households (by 4 percentage points)
- Decrease in the share of low-English proficiency households (by 6 percentage points)
These results are consistent with the idea that the COVID-19 pandemic is reducing response rates, as it has been hitting low-income and minority populations particularly hard.
Low response rates in the vicinities of college campuses may also be due to college students returning home when their colleges closed for the pandemic: although the Census Bureau wants these students counted at the addresses where they would be living if there weren’t a pandemic, it seems likely that many college students who would otherwise be living at or near school will not have received their Census questionnaires at those locations.
The low self-response rates for minority and low-income communities are especially concerning because Census under-counts in disadvantaged communities will reduce those communities’ political representation and state and federal funding—much of which is allocated proportionally to Census population numbers—for the next decade. It is particularly important that local governments in these areas make additional efforts to increase their constituents’ self-response rates to ensure an accurate count despite the difficulties the COVID-19 pandemic presents for Census follow-up enumeration operations.
Fraction of non-internet self-responses as of May 4, 2020. Displayed by 2010 Census tract. Tracts with large numbers of group-quarters residents have been removed. Data source: https://2020census.gov/en/response-rates.html Image by the author.
Non-internet census self-responses
In previous Decennial Censuses, households were mailed forms to complete and mail back. However, for the 2020 Census, the Census Bureau is encouraging households to complete their Census forms online. Although most households in the region that have responded have done so online, roughly 7% of them instead responded to the Census by phone or mail. This data provides one possible means of mapping the “digital divide” in the region, as households who responded by means other than the Internet likely have less access to the Internet overall.
Percent of minority resident (other than non-Hispanic whites) in 2010 Census tracts. Tracts with large numbers of group-quarters residents have been removed. Data source: 2018 American Community Survey 5-year estimates. Image by the author.
Mapping out the percentage of Census self-responses made by non-Internet means in the Washington region does seem to support this theory: the highest-income areas tend to have mail-in and phone response rates below 4%, while large pockets of mail-in and phone response rates above 25% are found in D.C. east of the Anacostia River, and in low-income and predominately-Black portions of Prince George’s County inside the Beltway.
Heads of household of age 65 or older, bu 2010 Census tracts. Tracts with large numbers of group-quarter residents have been removed. Data source: 2018 American Community Survey 5-year estimates. Image by the author.
Age may be as relevant as race: the Census tract with the highest rate of non-Internet responses— that is, with 68% of respondents coming in from non-Internet means — is in the age-restricted development of Leisure World in Montgomery County, which requires residents to be at least 50 years old and which is majority-non-Hispanic white. Other areas with very high numbers of non-Internet responses include the Armed Forces Retirement Home and the Lamond-Riggs neighborhood of Northeast DC, which has a very high proportion of senior citizens as residents.
Population of immigrants who moved to the US in 2000 or later, by 2010 Census tracts. Tracts with large numbers of group-quarters residents have been removed. Data source: 2018 American Community Survey 5-year estimates. Image by the author.
In any case, linear regression with 2018 American Community Survey data found statistically significant links between the non-internet response rate and median household income, the share of residents who immigrated to the US since 2000, the share of heads of household age 65 or older, and the share of households with no internet or only cell phone internet. A 1 percentage point increase in the fraction of responses made by non-internet means corresponded to a:
- Increase in the share of households without non-cellular internet at home (by 3 percentage points)
- Increase in the share of heads-of-household age 65 or older (by 3 percentage points)
- Decrease in residents who are recent immigrants (by 11 percentage points)
- Decrease in household median income (by $35,000)
Households with no internet or only celluar internet, by 2010 Census tracts. Tracts with large numbers of group-quarters residents have been removed. Data source: 2018 American Community Survey 5-year estimates. Image by the author.
About the data
2020 Census self-response rates were taken from the CSV file for 4 May 2020 and the online Census response rate map on the same day. This data is tabulated by provisional 2020 Census tracts. Technical data from the Census is available. Data on the Census’s predicted self-response rates were taken from the Center for Urban Research at the City University of New York’s national Hard-to-Count Map. Other demographic data is from the 2018 American Community Survey 5-year estimates, the most recent currently available.
2018 ACS data is tabulated by 2010 Census tracts, and GIS shapefiles are currently only available by 2010 Census tract, so maps were created and data was processed using this tabulation unit. Census tracts with a large number of group quarters residents (>20% in the 2018 ACS data) were removed from the sample by hand, since their demographic data may differ from the demographics of the residents in households and the latter are the subject of the self-response data.
In cases where the 2010 and 2020 Census tracts are not identical, either because a 2010 tract was divided into multiple 2020 tracts or (much more rarely in the Washington region) multiple 2010 tracts were combined into one 2020 tract, self-response rates for the 2010 tracts were estimated based on 2020 tract data from the online map. In the case of multiple 2010 tracts combined into one 2020 tract, the 2020 self-response rate was used for those 2010 tracts. In the case of one 2010 tract being divided into multiple 2020 tracts, the average of those 2020 tracts’ self-response rates was used for the 2010 tract.
Spatial-error linear regression modeling was performed with the R function spatialreg::errorsarlm, with Census tracts weighted by their numbers of households and using a first-order queen contiguity matrix. The R scripts used to process the data and perform this regression are provided.
All three are spatial-error linear models calculated over 949 Census tracts in the Washington region. (This is most of the Census tracts, with ones with low population (less than 100 residents) or high fraction of group quarters residents (more than 20% of total residents) removed.) I did a single, multi-variable regression for each of the three sections. Removing the non-significant variables didn’t change the signs or approximate magnitudes of the correlation coefficients of the significant variables.
The dependent variables are (1) fraction of households that have returned their forms—the self-response rate; (2) ratio of actual to predicted self-response rates, and (3) the fraction of self-response rates made by non-internet means.
The independent variables are all also fractions/ratios, except for population density and median income. I’m not sure if this is a problem, but I’m also not sure how to reasonably convert them to fractions/ratios for this. Any advice would be appreciated.
For simplicity of presentation, I took inverses of regression variables to present the data as the number of percentage points (or amount of population density / median income) that the independent variables would need to change for a one percentage point change in the dependent variable.
Top image: A snapshot of the region's population density of 2010 Census tracts. The lighter the color, the denser the population. Self-response rates were higher in lower-density suburban parts of the region. Tracts with large numbers of group-quarters residents have been removed. Data source: 2018 American Community Survey 5-year estimates. Image by the author.
5 Questions That Will Determine if Joe Biden Can Succeed

Redskins’ season is over, but there’s still plenty for D.C. sports fans to cheer

The Redskins’ season ended Sunday, one week later than most would have predicted in August, or even November. Some fans, including those who scoffed at the idea that anyone would choose to be at Verizon Center on Sunday night for a potential milestone goal instead of attending the Redskins-Packers game, may already be looking ahead to what […]
20 July 2015; Anchorage, Alaska.
Docking in Anchorage is not for the faint hearted. Cook Inlet is not the end of the fjord, it continues past Anchorage, where it turns into Knik Arm. And thus the tidal influence continues unabated as nothing slows it down. The only thing that happens is as soon as the water has passed Homer, the fjord / inlet slowly but steadily becomes narrower and that pushes the water height up. It gives Anchorage a tidal difference of about 20 feet but also a continuous flow along the dock. A water flow which can reach a velocity of 5 to 6 knots. Not unlike what happens on the St; Lawrence River at Quebec.

Lots of current, caused by lots of water being pushed in and out
To alleviate any problems with docking as much as possible, the docks are built along the river bank and in line with the river. That gives the option to dock with the nose in the current and keep the ship in position with the main engines until the mooring lines are safely secured ashore. Pushing against 4 knots of tide or being pushed by 4 knots of tide and then trying to control this sideways movement, even with strong tugboats, is not so easy. Better said it is nearly impossible.

We arrived on the flood tide and thus the ship swung around and docked nose out.
Based on that situation the Statendam arrived this morning around 07.00 hrs. near the dock, swung around and docked with the nose into the current alongside the cargo terminal. Anchorage does not have a cruise terminal as there are simply not enough cruise ships calling here as I explained yesterday. The cargo dock is about 2 miles outside the city and the city laid on a free shuttle for everybody who wanted to get into the city.

The City skyline on the Horizon.
I took the bus in the afternoon and I was really impressed by the organization. Dispatchers at the ship and in the city all nicely in uniform; two gophers at the city stop to help with putting wheelchairs and scooters away; and I could even do it in Dutch as one of the Ladies in the dispatch team was from Flemish Belgium. What more can you ask for?? Anchorage is certainly doing its best to get and to keep the cruise ships. I wish other cities would run such a professionally set up shuttle system.

Simulated a Collision & Fire in the Show lounge
Before I could go ashore we had the largest drill that Holland America has in its repertoire at least as far as complexity is concerned. A general boat drill involves more crew; but a mass casualty drill involves groups of crew members doing more complicated things.
Fire squads, Damage Control teams, Medical, Hotel support teams all have to work in close coordination to get a large number of casualties from a danger area to a safe area. While the casualties are coming out, triage takes place and each casualty is re-directed to a treatment area depending on the type and severity of the injuries sustained. If we would have a larger number of (severely) injured people on board then it would be hard for the medical team to deal with this. Thus we train and drill to save as many lives as we can and put those in a holding pattern until we can get outside help. Either by disembarkation or by getting extra medical support on board. Today we made it even more difficult by having the regular Infirmary area affected by the emergency, forcing us to set up an alternative Hospital. We have equipment for that purpose but it is of course limited.

15 Volunteers were carried out to the alternative hospital
Apart from saving the ship it is really all about coordination using a very large number of Hotel crew whose normal focus is on their regular work, serving guests and not running around with stretchers. But as it could happen, we have to train for it and thus we do.
So I took the shuttle bus to Anchorage, during a glorious day with the pleasant temperature of 59oF / (15oC) without wind and full of sunshine.

Down town Anchorage
Anchorage is compact in its layout and really built for the harsh winter; so it has a nice shopping mall and you can see by the size of the sidewalks that they do get some snow in the winter. I had a look for port postcards with cruise ships on it and found to my utter amazement the same cards as they sell in Ketchikan and Juneau. I missed a few of those in my collection and with 7 for a Dollar; this Dutchman had a very good day. (They are 4 for a dollar in Ketchikan…………. I wonder why) As less and less postcards are sent, people now send selfies, less new ones are printed and as a result you still see cards for sale with ships on them from the 1990’s. I missed a few of those and thus it made my day.
The Statendam will sail tonight at 10 pm. and then arrive around 0900 hrs. off the dock at Homer for an official 10 am. arrival. Weather: little change is expected.

“Family Transport in Anchorage ” as seen from the Shuttle Bus
Brew day with Funky Buddha

We're brewing a small-batch beer on our brewpub 4-bbl system with our pals from Funky Buddha in Oakland Park, Florida.
Today we are brewing a small batch beer on our brewpub 2-bbl system with our pals from Funky Buddha in Oakland Park, Florida. Like us they started super small as a nano brewery; they started out brewing 45-gallon batches and Dogfish started back in 1995 with 15-gallon batches.
