Shared posts

03 Oct 17:50

Now anyone can explore machine learning, no coding required

by Barron WebsterCreative Lab

From helping you find your favorite dog photos, to helping farmers in Japan sort cucumbers, machine learning is changing the way people use code to solve problems. But how does machine learning actually work? We wanted to make it easier for people who are curious about this technology to learn more about it. So we created Teachable Machine, a simple experiment that lets you teach a machine using your camera—live in the browser, no coding required.

Teachable Machine is built with a new library called deeplearn.js, which makes it easier for any web developer to get into machine learning. It trains a neural net right in your browser—locally on your device—without sending any images to a server. We’ve also open sourced the code to help inspire others to make new experiments.

Check it out at g.co/teachablemachine.

02 Oct 14:11

Driving the future of digital subscriptions

by Richard GingrasVP NewsGoogle

Journalism provides accurate and timely information when it matters most, shaping our understanding of important issues and pushing us to learn more in search of the truth. People come to Google looking for high-quality content, and our job is to help them find it. However, sometimes that content is behind a paywall.

While research has shown that people are becoming more accustomed to paying for news, the sometimes painful process of signing up for a subscription can be a turn off. That’s not great for users or for news publishers who see subscriptions as an increasingly important source of revenue.

To address these problems we’ve been talking to news publishers about how to support their subscription businesses with a focus on the following:

  • First, Flexible Sampling will replace First Click Free. Publishers are in the best position to determine what level of free sampling works best for them. So as of this week, we are ending the First Click Free policy, which required publishers to provide a minimum of three free articles per day via Google Search and Google News before people were shown a paywall.
  • Longer term, we are building a suite of products and services to help news publishers reach new audiences, drive subscriptions and grow revenue.
  • We are also looking at how we can simplify the purchase process and make it easy for Google users to get the full value of their subscriptions across Google’s platforms.

Our goal is to make subscriptions work seamlessly everywhere, for everyone.

First Click Free

We will end our First Click Free policy in favor of a Flexible Sampling model where publishers will decide how many, if any, free articles they want to provide to potential subscribers based on their own business strategies. This move is informed by our own research, publisher feedback, and months-long experiments with the New York Times and the Financial Times, both of which operate successful subscription services.  

"Google's decision to let publishers determine how much content readers can sample from search is a positive development,” said Kinsey Wilson, an adviser to New York Times CEO Mark Thompson. "We're encouraged as well by Google's willingness to consider other ways of supporting subscription business models and we are looking forward to continuing to work with them to craft smart solutions."

Publishers generally recognize that giving people access to some free content is the way to persuade people to buy their product. The typical approach to sampling is a model called metering, which lets people see a pre-determined number of free stories before a paywall kicks in. We recommend the following approach:

  • Monthly, rather than daily, metering allows publishers more flexibility to experiment with the number of free stories to offer people and to target those more likely to subscribe.
  • For most publishers, 10 articles per month is a good starting point.
  • Please see our Webmaster blog and our guide on Flexible Sampling for more detail on these approaches.

“Try before you buy” underlines what many publishers already know—they need to provide some form of free sampling to be successful on the internet. If it’s too little, then fewer users will click on links to that content or share it, which could have an effect on brand discovery and subsequently may affect traffic over time.

Subscription support

Subscribing to great content should not be as hard as it is today. Registering on a site, creating and remembering multiple passwords, and entering credit card information—these are all hassles we hope to solve.

As a first step we’re taking advantage of our existing identity and payment technologies to help people subscribe on a publication’s website with a single click, and then seamlessly access that content anywhere— whether it’s on that publisher site or mobile app, or on Google Newsstand, Google Search or Google News.

And since news products and subscription models vary widely, we’re collaborating with publishers around the world on how to build a subscription mechanism that can meet the needs of a diverse array of approaches—to the benefit of the news industry and consumers alike.  

We’re also exploring how Google’s machine learning capabilities can help publishers recognize potential subscribers and present the right offer to the right audience at the right time.

“It's extremely clear that advertising alone can no longer pay for the production and distribution of high quality journalism—and at the same time the societal need for sustainable independent journalism has never been greater.  Reader-based revenue, aka paid-content, or subscription services, are therefore not just a nice-to-have, but an essential component of a publisher's revenue composition,” said Jon Slade, FT Chief Commercial Officer.

“The Financial Times is welcoming of Google's input and actions to help this critical sector of the media industry, and we've worked very closely with Google to aid understanding of the needs that publishers have and how Google can help. That mutual understanding includes the ability to set controls over the amount of free content given to readers, a level playing field for content discovery, optimised promotion and payment processes. It is important that we now build and accelerate on the discussions and actions to date.”  

We are just getting started and want to get as much input from publishers—large, small, national, local, international—to make sure we build solutions together that work for everyone.  

05 Sep 14:40

AIY Voice Kit: Inspiring the maker community

by Billy RutledgeAIY Projects

Recently, we launched AIY Voice Kit, a do-it-yourself voice recognition kit for Raspberry Pi-based maker projects. Our initial offering sold out globally in just a few hours, so today, we’re happy to announce that more AIY Voice Kits will be available for purchase in stores and online in the coming weeks. You can pre-order your kit today with Micro Center.

The Voice Kit includes the same VoiceHAT (Hardware Accessory on Top), mic board, speaker, components, connectors and cardboard form for easy assembly that we first made available in the initial offering of Voice Kit with MagPi #57 in May. (Creative makers have since responded with their own recipes while waiting for more inventory.)  

The Google Assistant SDK is configured by default to bring hotword detection, voice control, natural language understanding, Google’s smarts and more to your Voice Kit. You can extend the project further with local vocabularies using TensorFlow, Google’s open source machine learning framework for custom voice user interfaces.  

Our goal with AIY Projects has always been to make artificial intelligence open and accessible for makers of all ages. Makers often strive to solve real world problems in creative ways, and we're already seeing makers do some cool things with their Voice Kits. Here are a few examples:

Cool things makers are doing with Voice Kit 

Martin Mander created a retro-inspired intercom that he calls 1986 Google Pi Intercom. He describes it as “a wall-mounted Google voice assistant using a Raspberry Pi 3 and the AIY Voice Kit.” He used a mid-80s intercom that he bought on sale for £4. It cleaned up well!

aiy-projects-2
aiy-projects-6

Get the full story from Martin and see what Slashgear had to say about the project.

(This one’s for Dr. Who fans) Tom Minnich created a Dalek-voiced assistant.

Maker using AiY Voice Kit

He offers a tutorial on how you can modify the Voice Kit to do something similar — perhaps create a Drogon-voiced assistant?

Victor Van Hee used the Voice Kit to create a voice-activated internet streaming radio that can play other types of audio files as well. He provides instructions, so you can do the same.
aiy-projects-4

The Voice Kit is currently available in the U.S. We’ll be expanding globally by the end of this year. Stay tuned here, where we’ll share the latest updates.

The positive reception to Voice Kit has encouraged us to keep the momentum going with more AIY Projects. We’ll soon bring makers the “eyes,” “ears,” “voice” and sense of “balance” to allow simple, powerful device interfaces.

Your input is critical to helping us plan our next releases, so let us know how AI can improve your projects, and solve real problems. Join the conversation at hackster.io, and share what you’re working on using the #AIYprojects hashtag. We can’t wait to see what you make.

14 Jul 13:14

Game of Thrones: The old Views and the new

by Lady Ursula of House Redón

Warning: This post is dark and full of spoilers.

Ned Stark always warned, “winter is coming.” The white raven confirmed that it’s finally here, and so is the season seven premiere of “Game of Thrones.” Fans have been waiting a year for the new season, but our watch hasn’t ended—the Street View team has been assembling a collection of “Game of Thrones” filming locations longer than Arya Stark’s kill list. As you prepare for the episodes to come, you can go back to the iconic places and scenes with the most famous families in the Seven Kingdoms: the Starks, Lannisters and Targaryens.

We promised the Views, and a Googler always pays her debts:

The Starks and friends

  • Winterfell, home of the Stark family, is shot at Doune Castle in the Stirling district of central Scotland and at Castle Ward in Northern Ireland. Perhaps the dual Irish/Scottish influence is the reason for the Starks’ confusing accent?

  • One man’s best friend is another man’s House sigil. In the forest near Winterfell—shot in Tollymore Forest Park in Northern Ireland’s Mourne Mountains—Ned Stark discovers a pack of six direwolves, each gifted to a Stark child. And as the saying goes, all dogs—or at least four of the Stark direwolves—go to heaven.

  • In the Frostfang Mountains—filmed in Höfðabrekka, Iceland—Qhorin Halfhand, Jon Snow and the Night’s Watch expedition take Ygritte as their prisoner. And then we’ll wonder “will-they-won’t-they” about Jon and Ygritte for the next eight episodes.

  • ... Until the cave, shot at the Grjótagjá cave in Iceland. Here Jon breaks his Night's Watch vows and Ygritte wants to stay in the cave forever.

  • Braavos is home to the Iron Bank—which is filmed at St. Jacob Cathedral in Sibenik, Croatia—as well as the House of Black and White, the temple dedicated to the Many-Faced God where Arya trains with Jaqen H'ghar. Hard to say how his team of face-shifters would cope in Street View's world of Blurry Men.

  • Where the tall people come to fight. When Brienne and Podrick miraculously find Arya, Brienne can finally fulfill her promise to Catelyn Stark and bring Arya to safety—if she’s not out-foxed by the Hound. Three minutes of bloody battle were filmed over three days in Thingvellir National Park in Iceland.

  • In one of Bran Stark’s visions, Ned goes to the Tower of Joy in the Red Mountains—filmed at The Castle of Zafra in Guadalajara, Spain—to rescue his sister Lyanna. Here we learn the truth about Jon Snow’s parentage (and that Ned has been rocking the same hairdo for 17 years).

  • Watch out, Westeros. Samwell Tarly—killer of White Walkers and best friend of the King in the North—is carrying a sword made of Valyrian steel and he’s training to become a maester at the Citadel Grand Library (filmed at the Monastery of Sant Pere de Galligants in Girona, Spain).

Winterfell.png
Winterfell, filmed at Doune Castle in Scotland.
Winterfell, Ireland

Winterfell, filmed at Castle Ward Ireland.


Forest near Winterfell.png

Forest near Winterfell, shot in Tollymore Forest Park, in the Mourne Mountains in Northern Ireland.

Frostfang Mountains.png
Frostfang Mountains are actually in Höfðabrekka, Iceland.
Secret Cave.png

Jon and Ygritte’s secret cave, shot Grjótagjá cave in Iceland.

Iron Bank.png

The Iron Bank of Braavos, filmed at St. Jacob Cathedral in Sibenik, Croatia.

Brienne

Scene of Brienne’s fight with The Hound, Thingvellir National Park in Iceland.

Tower of Joy.png

Tower of Joy in the Red Mountains, is actually the Castle of Zafra in Guadalajara, Spain.

Citadel Grand Library

Citadel Grand Library, filmed at Monastery of Sant Pere de Galligants in Girona, Spain.

The Lannisters and their enemies

  • King's Landing is the capital city of Westeros, home of the Iron Throne. The Targaryens had it, Jamie Lannister stabbed King Aerys in the back for it, and now everyone in the Seven Kingdoms is fighting for it. King’s Landing is filmed in Dubrovnik, a medieval walled city in Croatia.

  • The Kingsroad stretches from the Wall down south to King's Landing. We first heard of the Kingsroad when King Robert Baratheon traveled to Winterfell to ask Ned to be his Hand (before Cersei took Ned’s head). In one stretch of the Kingsroad—filmed at the “Dark Hedges” in Northern Ireland—Arya, disguised as a boy bound for the Night’s Watch, escapes from King's Landing.

  • If the Green Gardens of King’s Landing had ears, they’d know more about the goings-on in the Seven Kingdoms than Lord Varys and his little birds. Many secretive strolls and sinister conversations happen in this garden, filmed in a small village about 20 minutes away from Dubrovnik’s Old Town.

  • Dragonstone Beach is lit. This is where Melisandre—the Lord-of-Light worshipping, Jon-Snow-reviving Red Woman—burns the Seven Idols of Westeros and Stannis Baratheon pulls a sword, Lightbringer, out of the flames (he’s ready for battle!). The scene is filmed at Downhill Strand, a beach in Northern Ireland.

  • While Cersei frets about the wellbeing of her daughter—shipped off to Dorne by her Uncle Tyrion—Myrcella is actually frolicking through the gorgeous Water Gardens of Dorne with her one true love Prince Trystane Martell. The Water Gardens are filmed at the Real Alcázar in Seville, Spain.

  • Shame, shame, shame. Just when you thought you’d never feel empathy for Cersei, she’s forced to serve her penance and walk naked through the street as people harass her, spit on her, and throw things at her. This iconic scene takes place on St. Dominic Street in Dubrovnik, Croatia.

Kings Landing.png

King's Landing is filmed in Dubrovnik, a medieval walled city in Croatia.

Kingsroad.png

This stretch of the Kingsroad is called the “Dark Hedges” in Northern Ireland.

Green Gardens of Kings Landing.png
The Green Gardens of King’s Landing are filmed in a small village about 20 minutes away from Dubrovnik’s Old Town.
Dragonstone Beach.png
Dragonstone Beach is actually Downhill Strand, a beach in Northern Ireland.
Water Gardens of Dome.png
The Water Gardens of Dorne are filmed at the Real Alcázar in Seville, Spain.
St Dominic Street.png

Cersei’s walk of shame takes place on St. Dominic Street in Dubrovnik, Croatia.

Daenerys Targaryen, Breaker of Chains and Mother of Dragons

  • Daenerys goes to the House of the Undying—filmed at Minčeta Tower in Dubrovnik, Croatia—to take back her dragons who were stolen by Pyat Pree. When he attempts to bind her in chains, Daenerys orders her dragons to breathe fire, killing Pyat Pree and setting them free.

  • Varys and Tyrion explore The Long Bridge of Volantis on their way to Meereen. While in Volantis, Tyrion is captured by Jorah Mormont and taken to Daenerys, as Jorah’s last ditch effort to win her back. A bridge in Córdoba in Spain was used as a stand-in for the Long Bridge, but CGI was used to make the bridge look larger and to add buildings and markets atop it.

  • Boy declares love for girl by killing for sport in front of thousands of people. Boy saves girl from assailant by throwing a spear into his heart. Girl flies away on dragon. Poor Jorah (so much for that last ditch effort). All this action at the Arena of Meereen was filmed at the Bullring of Osuna in Seville, Spain.

  • At the beginning of the sixth season, Daenerys crosses the Dothraki Sea—filmed in Bardenas Reales, a desert in Northern Spain—after she’s captured by the Dothraki. They’re pretty fired up to take the Queen of Dragons back to their camp … maybe a little too fired up.

House of the Undying.png

The House of the Undying was filmed at Minčeta Tower in Dubrovnik, Croatia.

Long Bridge of Volantis.png
The Long Bridge of Volantis is a bridge in Córdoba in Spain.
Arena of Mereen.png

Arena of Meereen was filmed at the Bullring of Osuna in Seville, Spain.

Dothraki Sea (1).png
The Dothraki Sea was filmed in Bardenas Reales, a desert in Northern Spain.
13 Jul 12:46

I Am Amazon: Discover your connection to the rainforest with Google Earth

by Rebecca MooreGoogle Earth

For many people around the world, the Amazon is a mysterious faraway land of impenetrable jungles, majestic rivers and indigenous peoples. But what many of us may not realize is that we all have a connection to the Amazon—through the air we breathe, the water that irrigates the food we eat, the natural ingredients in the medicines we use, or the shifting weather patterns that we experience around the globe.

Today we invite you to venture into the heart of the Amazon and discover your connection to the world's largest rainforest through Voyager, Google Earth's storytelling platform. You’ll find 11 new interactive stories about different parts of the vast Brazilian Amazon region, which is home to about 27 million people and a wide array of cultures.

All of these stories are told by the diverse peoples who call the forest home, and some were produced by one of Brazil's greatest storytellers, the acclaimed film director Fernando Meirelles. Combined, they create an immersive web and mobile experience told through video, mapping, audio and 360° virtual reality, covering a broad range of issues facing the future of the rainforest—and, consequently, the planet.
View "I Am Amazon" in Google Earth

These stories reflect the complexity of the Amazon, which produces 20 percent of the Earth's oxygen and is home to one in 10 of the world's animal species. Learn about the supply chain behind the vast array of forest delicacies, like Brazil nuts and açaí, that end up on supermarket shelves worldwide; or about local economies once dependent on illegal logging that are now reorganized around sustainability efforts; or about Quilombolas, communities of descendants of enslaved peoples, and their struggle to obtain titles for their lands.

Image
View "I Am Amazon" in Google Earth

Thanks to our partnership with the Instituto Socioambiental, we're also publishing in Google Earth Voyager for the first time a comprehensive atlas of indigenous lands in Brazil and the people who live there. And we're filling in those maps with in-depth interactive stories told by the Amazon communities themselves.

You can learn about indigenous peoples like the Tembé and the Paiter Suruí, who are using monitoring technologies to protect their territories from illegal incursions by outsiders and deforestation; or the Yawanawá, a tribe that under the leadership of women has revived its cultural heritage and carved out a place in the global cosmetics industry by sustainably harvesting urucum, a reddish seed used in lipstick and other products.
I Am Food

These stories are the culmination of 10 years of work with the peoples of the Amazon. Back in 2007, Paiter Suruí leader Chief Almir came across Google Earth and quickly saw its potential to help safeguard the heritage and traditions of his people. So he proposed a partnership with Google that resulted in an online map of Suruí cultural heritage, the first ever indigenous community-led deforestation and forest carbon mapping project. Through this project, the Suruí calculated the value of their forest on the voluntary carbon marketplace, and became the first indigenous community to receive funds for preserving their lands.

Technology is an important tool that is helping us to protect the forest and keep our traditions alive. Ubiratan Suruí
Suruí Indigenous People's Association

Over the years, we've built on this work with the Suruí and expanded it to an additional 30 communities in the Amazon, with more to come. We also recently integrated certified Brazilian indigenous territories into Google Maps, all 472 of them.

Since its creation more than a decade ago, Google Earth has always aimed to bring the magic of our planet to everyone in a beautiful, accessible and enriching way. We hope these fascinating stories from the Amazon do all of that and more, inspiring curious minds to explore, learn and care about our vast, fragile planet.

10 Jul 12:25

Connecting more Americans with jobs

by Nick Zakrasek

Whether you’re a student looking for a part-time job, an electrician seeking work closer to home, or a teacher moving to another state to be close to family, finding a job can be difficult. With job postings scattered across the web, newspapers and help wanted signs, it’s not always easy to find ones that are a good fit based on your unique needs and skills. As a result, many job seekers feel like they can’t find the job they’re looking for or apply to roles that aren’t the right fit. At the same time, 46 percent of U.S. employers face talent shortages and have issues filling open positions with the right candidate.

We have a long history of using our technology to connect people with crucial information. At I/O, we announced Google for Jobs, a company-wide initiative focused on helping both job seekers and employers, through deep collaboration with the job matching industry. This effort includes the Cloud Jobs API, announced last year, which provides access to Google’s machine learning capabilities to power smarter job search and recommendations within career sites, jobs boards, and other job matching sites and apps. Today, we’re taking the next step in the Google for Jobs initiative by putting the convenience and power of Search into the hands of job seekers. With this new experience, we aim to connect Americans to job opportunities across the U.S., so no matter who you are or what kind of job you’re looking for, you can find job postings that match your needs.

Find your next job, with Google

Starting today in English on desktop and mobile, when you search for “jobs near me,” “teaching jobs,” or similar job-seeking queries, you’ll see in-depth results that allow you to explore jobs from across the web. For many people, a job needs to satisfy some key criteria, like commute time, job specialties they've honed or the hours they have available to work. For many jobs, you’ll also see reviews and ratings of the employer from trusted sites, right alongside the job description, and if you’re signed in, for some jobs you’ll even see how long it would take to commute to the job from home. We’ll continue to add additional filters and information in the future. Looking for jobs is a personal and complex journey, and one that we’re trying to support in this new search experience.

jobs3

Searching for a job can take time. And keeping up with new jobs that are posted throughout the day can be impossible. Now, if you step away from your job search, you can pick up right where you left off and stay in the loop on opportunities that interest you. Just turn on alerts for your search to receive an email notification whenever new jobs arrive, keeping you up-to-date and on top of your job hunt.

We’re working with a number of organizations from across the industry to bring you the most comprehensive listing of jobs—including LinkedIn, Monster, WayUp, DirectEmployers, CareerBuilder, Glassdoor and Facebook. This means you’ll see job postings from these sites and many others from across the web as soon as they’re posted. To ensure even more jobs are listed over time, we’re publishing open documentation for all jobs providers, from third-party platforms or direct employers, big or small, detailing how to make their job openings discoverable in this new feature.

People from all walks of life, experiences and backgrounds have undergone a job hunt at some point in their lives. Whether you’re a young adult looking for your first job, a veteran hoping to leverage your leadership experience in civilian life, or a parent looking for a job with better pay to support a growing family, we hope this new experience on Google will help make the job search simpler and more effective.

10 Jul 11:55

Google Earth Quiz Maker

by Timothy Whitehead

Thank you to GEB reader Dieter van Werkum for letting us know about a Google Earth quiz maker he has created. See here for a sample of what it can produce, and the source code is on Github. He has adapted it to work with the new web based Google Earth as well as Google Earth classic.


Flyto Quiz in Google Earth classic.

The project consists of a KML file which you can modify to create your own multiple choice quiz. When the user gets the answer right, Google Earth flies you to the next placemark. The KML file contains all the instructions you need to customise it for your own quiz, although it would be helpful to know some HTML and CSS for the best results.


Flyto Quiz in Google Earth for Chrome.

It would actually serve as a useful template to start with if you are creating an ordinary tour of any kind. It can easily be adapted to have ‘previous’ and ‘next’ buttons instead of quiz answers and any content you like in the popups.

The post Google Earth Quiz Maker appeared first on Google Earth Blog.

09 Jul 15:31

Building a map for everyone

by Shiva Thiagarajan

Many of us take for granted simple things like walking through a doorway, taking the stairs to the next floor, or always having a comfortable seat at a restaurant table. But for tens of millions of people worldwide, those very things aren’t possible unless a place has a wheelchair accessible entrance, elevator or accessible seating. Today we’re introducing a new way to add accessibility details about places to Google Maps and Search.

For those like Luis Duran, who are passionate about helping people better navigate and explore his city––this tool is for you. When you want to share accessibility information about a place or add details about many places quickly, just open Google Maps on Android, open the main menu, and then tap “Your contributions.” Tap “Uncover missing info” and sort by “Accessibility” to find places around you that are missing this kind of information so you can start filling it in. You can also sort by different categories in case you have other information to add as well.

MobileAccessibility

When you need to find out whether a place you’re planning to visit has any of these accessibility features, just find the place on Google Maps (desktop, mobile) or Search (mobile), open the business listing, tap the two-line description, and then scroll down to the accessibility section. If we know the place lacks a feature, you'll see a no symbol next to it. From here, you can also add your accessibility and other local knowledge by tapping “Know what features this place has?”

AccessibilityMaps_Screenshot.png

The accessibility attributes you can choose from include: wheelchair-accessible entrances, wheelchair-accessible elevators, wheelchair-accessible seating, and wheelchair-accessible parking. Unsure of how to answer these questions? Here’s a handy guide. If you want to find other Google Maps users who are equally passionate about sharing their knowledge of the world, join the Local Guides program.

With the help of users, we’ve been able to add accessibility information to nearly 7 million places around the world. By sharing your local knowledge, you’re helping us get even closer to enabling everyone, everywhere to easily discover and explore the places that best suit their individual needs.

04 May 04:09

The Ghent Altarpiece: how we digitized one of the most influential artworks of all time

by Pierre CaessaGoogle Arts & Culture

Some 600 years ago, the Van Eyck brothers created one of the first large-scale oil paintings: “Adoration of the Mystic Lamb.” Due to its pioneering attention to detail and realistic portrayal of people, the “Ghent Altarpiece” is renowned as one of the most influential paintings ever made and a defining artwork that represents the start of the Northern Renaissance.

ghent altarpiece (inside).gif

As such an important symbol in art history, the altarpiece has long been highly sought after and widely coveted. Since 1432, when it was first installed at Saint Bavo Cathedral in what’s now Belgium, the Altarpiece has survived 13 crimes. Looted, burned and torn apart, it’s been through the hands of multiple armies, including those of Napoleon and the Nazis.

After World War II, the Monuments Men—a group set up by the Allied armies to protect cultural heritage from the Nazis—brought it back to its original home in Ghent, Belgium. One of the panels—“The Just Judges”—is still missing following its theft in 1934. Its absence remains one of the most intriguing riddles in art history.
output_sM4QuS (1).gif

Archives documenting the Altarpiece’s rescue at the end of WWII from the collection of Lukas - Art in Flanders.

Now, the freshly renovated exterior panels of the Altarpiece can be explored in ultra-high resolution on Google Arts & Culture. Thanks to a partnership with the online image library of Flemish art heritage Lukas - Art in Flanders and the Cathedral of Saint-Bavo, we’ve digitized this masterpiece for future generations to explore in unprecedented detail.

Mystic Lamb Altarpiece

Our robotic Art Camera took about 4,000 high-resolution close-ups of the artwork and used those to create the highest ever resolution image ever made of the panels. You can zoom as much as you’d like into more than 8 billion pixels.

20160926_google_078.JPG
Art Camera digitizing one of the 10 exterior panels of the Altarpiece

Discover amazing details, revealed by the panels’ recent renovation: for example, a charming view of medieval Ghent which used to be barely visible. Now you can even make out the lines of the book Mary is reading.

Altarpiece_detail.png

This is one of the latest efforts by Google Arts & Culture to provide institutions with the tools to digitally preserve their collections and make cultural heritage more accessible to everyone.

Explore the adventurous past and rescue of the Altarpiece today—and download Google Art & Culture app on iOS or Android for a daily dose of culture.
03 May 01:56

A Tour Maker for the new Google Earth

by Timothy Whitehead

Last week we had a look at the new Voyager tours in the new Google Earth and suggested that Google create a tour maker or at least release instructions on how to create them. It turns out that, Josh of GE Teach, has managed to figure out how it is done and has released a simple tour maker for the new Google Earth. GE Teach is an excellent site we have covered a number of times in the past.

To use the tour maker simply go here and follow the instructions in the video below.

The tour maker is fairly rudimentary at present, allowing you to create placemarks with photos that open in the new side bar. But it is easy to use and produces great results and we expect he will add more features in the future. In addition, if you are looking to create more complex tours, the above tour maker is a good place to start to see how the new Google Earth’s tour system works.

One important thing to note is that although the tours are KML they do not run well in Google Earth Classic. Hopefully, Google will update the classic version to handle some of the new features.

Looking into the created KML files it seems Google has added some new custom tags to KML such as <gx:displayMode&gth; which can be set to ‘fullscreen’ or ‘panel’. We hope they update the KML documentation to include these extensions and how to use them.

Note that the GE Teach Tour Maker does not use the Tour features of KML, but instead creates a series of placemarks with links between them.

The post A Tour Maker for the new Google Earth appeared first on Google Earth Blog.

03 May 00:22

Using shadows to tell the time in Google Earth imagery

by Timothy Whitehead

Have you ever wondered what time a particular image was captured? Google Earth does not show times, only dates. We noticed in the Google Earth Enterprise documentation that ‘Acquisition date’ only accepts a date and not a time. We assume that Google’s equivalent software for Google Earth has the same limitation.

So, we wondered how easy it would be to tell the time based on shadows in the imagery. Google Earth has the option to show the sun, and if you are lucky, you can adjust the time until the sun lines up with a shadow. However, Google Earth does not allow you to look upwards except in the Flight Simulator, so if the sun is too high in the sky you cannot get it in the view.

[ Update: Frank pointed out to me that you can look up using the ‘eye’ tool in the centre of the compass. I am so used to my 3D connexion mouse that I forget there is any other way to navigate.]

Also, accurately lining it up is tricky.

Note that the time on the ‘time’ toolbar appears to be shown in the computer’s ‘local time’. So the above image was captured at about 1:15 am CAT (UTC +2) which is 11:15 pm UTC or 4:15 pm in California (where the image was captured). (We didn’t check that for daylight savings time complications).

We thought it would be fun to write a tool to calculate time based on shadow angle. As a bonus, the shadow length can tell you the height of the object. We found some open source code here that was created for the ‘Suncalc.net’ website. The code isn’t ideal as it converts time to the sun’s angle above the horizon and azimuth whereas we need the reverse, so we run it for each minute of the day and find the closest match. To use it, first switch to ‘historical imagery’ and find an appropriate image and some shadows. Draw a path in Google Earth from the base of an object to the end of its shadow. Use only two points in the path as only the first two points are used by the code. Next, right-click on the path and select ‘Snapshot View’. This stores the date from the historical imagery time bar in the path. Make sure you selected the appropriate date on the time bar first. Now save the path, or a collection of such paths, as a KML file. Upload the file below, and it should show a table listing the approximate time the image was taken in UTC and the estimated height of the object. Unfortunately, we do not know of an easy way to convert time to the correct time zone based on latitude and longitude. Using the tool below for the location in California shown above, we got 11:06 pm UTC, and a height of 14 m for the street light.

 
Ideally, do a number of shadows in the same image for greater accuracy. We found variations of over 10 minutes due to the difficulty of accurately marking the shadow angle.


St George Wharf, London, UK.
Image captured on 2015-10-08 at approximately 11:01 am UTC. The tallest building measured 182 m based on its shadow. Using Google Earth Pro’s 3D measuring tool and 3D imagery we got 179 m. According to Wikipedia it is 181 m.

As usual, let us know in the comments if you find any bugs or have ideas for improvements.

The post Using shadows to tell the time in Google Earth imagery appeared first on Google Earth Blog.

01 Apr 03:13

All the best mobile accessories, now for your Chromebook

by The Chrome OS Team

Chromebooks are blurring the line between desktop and mobile with the launch of Google Play store on Chromebooks. Our latest Chromebooks were built from the ground up with this technology. But until now, it wasn’t possible to appreciate the full range of experiences Android Apps can offer.

After extensive user research and market analysis, we’re excited to introduce a line of mobile accessories for Chromebooks. We’ve thoughtfully adapted your favorites to capitalize on larger screens and convertible form factors. Here’s a sneak peek at a few highlights:

1. Chromebook Groupie Stick

selfiestick.jpg

For mobile photography lovers, nothing beats a selfie stick for the perfect shot. But on a tiny phone display, it’s sometimes hard to fit the whole group. To take advantage of beautiful, high-resolution displays, as well as great photo editing apps, we’ve carefully engineered the first Chromebook-sized selfie stick. Never again will you miss the perfect groupie.

2. Chromebook Cardboard

cardboard.jpg

In collaboration with the Cardboard team, we’re bringing you a new, immersive VR accessory—Cardboard for Chromebooks. Just as affordable and just as mobile, this new version of Cardboard is your gateway to larger-than-life experiences wherever you go. Stay tuned for all the specs so you can turn any large appliance or pizza box into your own Cardboard device.

3. Chromebook Workout Armband

armband.jpg

For the dedicated athlete, we’re introducing the Chromebook Workout Armband for all your fitness needs. Giant media buttons make it easier than ever to skip songs without taking a pause, and music apps let you take your music offline wherever you go. Whether you’re out for a run or in the gym, this armband allows you to really go big with your workout.

Keep an eye on the Google Store for these products and more. The next generation of Chromebooks is here, and we can’t wait to bring you all the accessories to make them the ultimate mobile devices.

Update: April Fools! These accessories aren't real, although we're always working on new ways to make Chromebooks more useful on the go. 😉

01 Apr 03:11

The smart yard is finally here. Meet Google Gnome

by Kyle ConertyGoogle Gnome Team

It all started with smart thermostats, refrigerators, and light bulbs. Then Google Home came along and made your entire house smarter. But what about the backyard, the final frontier in smart homes? Two words: “Ok Gnome.”

Google Gnome

Google Gnome is a voice-activated, hands-free tool designed to make backyard living effortless. Need to know what animal is squeaking in your bushes? Stay still and ask Gnome what sound an opossum makes. Running low on birdseed? That’s where Gnome comes in. You can even use Gnome’s proprietary high-intensity lasers to trim your hedges into whatever shape your heart desires. The only thing that can fence in Google Gnome is the literal fence surrounding your yard.

GG0235_2000.jpg
GG0878_2000.jpg
GG001_2000.jpg
GG0505_2000.jpg
GG0735_2000.jpg

The future is here, and it’s a real breath of fresh air. Discover it for yourself at g.co/GoogleGnome.

21 Feb 14:13

Play a duet with a computer, through machine learning

by Alexander ChenCreative Lab

Technology can inspire people to be creative in new ways. Magenta, an open-source project we launched last year, aims to do that by giving developers tools to explore music using neural networks.

To help show what’s possible with Magenta, we’ve created an interactive experiment called A.I. Duet, which lets you play a duet with the computer. Just play some notes, and the computer will respond to your melody. You don’t even have to know how to play piano—it’s fun to just press some keys and listen to what comes back. We hope it inspires you—whether you’re a developer or musician, or just curious—to imagine how technology can help creative ideas come to life. Watch our video above to learn more, or just start playing with it.
12 Dec 01:12

Let your loved ones know you’re safe with our new personal safety app

by Minh T. Nguyen

Whether it’s hiking alone or walking down a street after dark — sometimes you want to know someone's got your back. To help you feel safe and give your friends and family peace of mind, today we're launching Trusted Contacts. This new personal safety app lets you share your location with loved ones in everyday situations and when emergencies arise — even if your phone is offline or you can’t get to it. 

Here’s how it works: Once you install the Android app, you can assign “trusted” status to your closest friends and family. Your trusted contacts will be able to see your activity status — whether you’ve moved around recently and are online — to quickly know if you're OK. If you find yourself in a situation where you feel unsafe, you can share your actual location with your trusted contacts. And if your trusted contacts are really worried about you, they can request to see your location. If everything’s fine, you can deny the request. But if you’re unable to respond within a reasonable timeframe, your location is shared automatically and your loved ones can determine the best way to help you out. Of course, you can stop sharing your location or change your trusted contacts whenever you want.

TrustedContactsGIF

Here’s a little more detail on how Trusted Contacts might work, starring Elliot and Thelma:

personalsafety app_contacts.png

Get help even if your phone’s offline

Elliot heads out for a hike on his own, telling Thelma he’ll meet her for coffee later. About an hour in, Elliot realizes he’s strayed off the path and lost service. When Elliot doesn’t show up at the coffee shop, Thelma starts to worry. Because Trusted Contacts works even if a phone is offline, Thelma requests Elliot’s location and in five minutes can see that his last known location was in the middle of the canyon. Thelma calls the nearest ranger station, they send out a rescue party, and find Elliot in a few hours.

personalsafety app_2.png

Invite a trusted friend to virtually walk you home if you feel unsafe

Elliot stayed at the office later than normal and notices it’s awfully dark out. He opens Trusted Contacts and shares his location with Thelma. Now Thelma can walk him home — virtually. When Elliot gets home, he simply taps the banner at the top of the screen or from the lockscreen and stops sharing his location.


screen_sharing_notif.height_800.png

Whether you just need a little reassurance or you’re actually in an emergency, Trusted Contacts helps connect you with the people you care about most — at the times you need them most. Download Trusted Contacts today from the Play Store and visit the help center for more info. If you're an iOS user, click here to get notified when the iOS app is available

24 Nov 13:50

Experimenting at the crossroads of Machine Learning and arts

by Damien HenryGoogle Cultural Institute

This 233,000 year old female figurine is said to be the oldest piece of artwork ever found. Based on microscopic analyses archeologists suggest that it was shaped by human hands — possibly one of the first artists in the world. Critically, those human hands used a flint to shape the head and arms.

GAC MachineLearning_Artifact.png
Made of volcanic material, this 233,000-year-old and 3.5 cm tall female figure is the oldest artwork discovered.

Ever since its ancient beginnings, art has been influenced by the tools and technology available to create and share works. Breakthroughs in painting, printing, or the invention of photography all provided tools for creative expression, and left their mark on our culture. In turn, art has inspired innovation and pushed the boundaries of technology. This remains true today.

Our team at Google Arts & Culture has been curious what Machine Learning can do in the hands of artists, museums or curators to create new experiences and help unlock art for everyone. This is why we invited creative coders - think of someone who is both a software engineer and an artist - to collaborate and experiment at our Lab in Paris. And today, we’re excited to share what we’ve been up to: check out the Google Arts & Culture Experiments, a new online space where you can see and play with the experimental projects that we have built.

Google Arts & Culture Experiments

With these experiments, you can explore hundreds of thousands of artworks and let Machine Learning aid your discovery.

  • X Degrees of separation: They say any two people in the world can be connected through just a few layers of friends of friends. Much like Kevin Bacon is connected to anyone in Hollywood. How about artworks? Created in collaboration with code artist Mario Klingemann, our ‘X Degrees of Separation’ lets you choose any two artworks and the computer using Machine Learning will find a visual pathway connecting them through a chain of similar artworks.
  • t-SNE Map: we’re all familiar with landscapes paintings, but how about a landscape of the history of art itself? You can now travel through hundreds of thousands of artworks from across centuries organized into one vast 3D landscape in this experiment. The more similar two works are seen by the computer the closer they are on the map. This was built in collaboration with digital interaction artist, Cyril Diagne.
  • Tags: A picture is worth a thousand words. In our Tags experiment the computer looked at the artworks and tagged them with all it saw in the picture. In turn this allows you to explore anything from “hairstyles” to more abstract concepts like “calm” or “happy”  in works from across the world of art.

GAC MachineLearning_Xdegrees4.gif
‘X Degrees of Separation’ lets you choose any two artworks and the Machine Learning algorithm will find a visual pathway connecting them through a chain of similar artworks.

We’re delighted to see the amount of excitement around Machine Learning in the cultural sector, especially among creative coders. If you are a creative coder yourself, or just getting started, check out the new AI Experiments website created by our friends in the Creative Lab where you can find further inspiration and resources.

11 Nov 05:51

Could machine learning save this sea cow?

by Josh Gordon
Dugong - Peter Shanks.jpg
Source: Peter Shanks (adjusted for clarity)

It’s hard to imagine this adorable sea cow getting caught in a fishing net, or losing its home to coastal development. Unfortunately that’s what’s happening to many populations of large marine mammals around the world. It’s urgent—sea cows are under threat of extinction.

Sea cows might be cute, but it turns out they’re also really hard to keep track of. And keeping accurate data on populations is critical for conservation efforts.

For decades, scientists had to spend days peering out of small planes to count populations, which was expensive and sometimes hazardous. Dr. Amanda Hodgson of Murdoch University has helped to change that, using drones to take aerial photography of the ocean. But now that they can collect aerial photos remotely, there’s a new challenge: how can they find the sea cows in 45,000 photos?

Try it yourself—look for the sea cow in this image, which you can click to get in full resolution:

Dugong - 30FWDF2F2_DSC2458.JPG
Source: Dr. Amanda Hodgson

Can’t find it? Hint: it’s in the middle of the lower-left quarter. Yes, that little gray smaller-than-fingernail-sized sliver. To see where it is, check out the image with the sea cow circled

Now, what if you had to do this manually on tens of thousands of images? It would really slow down research, and it wouldn’t scale to other regions and other species of sea mammals.

So Dr. Hodgson and team decided to apply a little magic: machine learning. She teamed up with Dr. Frederic Maire, a computer scientist at Queensland University of Technology. Using TensorFlow, the free open source machine learning platform that’s now been out for exactly one year, they built a detector that could learn to find sea cows in these photos automatically. (It’s a little like the image recognition that lets you search Google Photos for shots of particular dog species, or sunsets, or whatnot—but much more specialized for this scientific task.)

The results are encouraging: an early version of their detector could find 80% of the sea cows they’d found manually in images, and they expect to improve performance over time. This suggests the approach may scale well—not only for sea cows, but for other sea mammals such as humpback whales and certain dolphins as well. Eventually if they’re able to track these threatened populations on a large scale, conservationists have a much better shot at knowing how they’re impacted by human activities, and where it’s most urgent we protect their habitats. In a small way, machine learning might help save the humble sea cow.

11 Nov 01:31

Experiments and YouTube creators from the International Space Station

by Yuko AkiyamaGoogle Japan

Last night in Japan, the Japan Aerospace Exploration Agency (JAXA) live-streamed a program called “KIBO SCIENCE 360 - A SPACE EXPERIMENT with Google” on its YouTube Channel. Astronaut Takuya Onishi broadcasted live  from the Kibo Experimental Module inside the International Space Station (ISS) and talked to popular YouTube creator Hajime Shacho and astronaut Akihiko Hoshide on the ground. He also performed some fun experiments. If you’ve ever wondered what it’s like mixing liquids in outer space, check out how Takuya prepares coffee with milk. 


KIBO SCIENCE 360 - A Space Experiment with Google : 大西宇宙飛行士交信特別番組

KIBO SCIENCE 360 - A Space Experiment with Google : 大西宇宙飛行士交信特別番組

If you have a Google Cardboard, you can experience — in virtual reality — what it’s like being in space, and have a go at completing missions in low gravity.  Just download the Kibo Science 360 app, available on Google Play.

Kibo Science 360

To really get into the spirit of things, download the super cool design for your own special Cardboard viewer that you can make yourself (instructions unfortunately only in Japanese.)


09 Nov 14:21

Animating in Google Earth Part 2 – Importing Models

by Timothy Whitehead

This is the second in a series of posts discussing animating in Google Earth that we started last week. Today we are not looking at animation itself, but how to get a model into Google Earth that you can animate.

3D models can be obtained from a variety of sources. One resource is the SketchUp 3D Warehouse, which has a large number of models, including most of the old style 3D buildings found in the Google Earth 3D buildings layer. When downloading them, they are offered in a variety of formats, sometimes including KMZ ready for Google Earth. If that is not available try ‘Collada file’ if is available. If the only option is SketchUp file format then you will need to the free version of SketchUp to convert it to a Collada file.

There are many other sites with 3D models available such as this one. Where possible you should look for files in Collada format ( .dae file extension). Other formats can be converted but you will need to find the appropriate software first.

We found this 3D model, created by NASA, of the Mars rover Curiosity.

It is in a format used by the open source 3D modelling program Blender. So we installed Blender, opened the model then exported it to Collada format. Unfortunately, it would not immediately open correctly in Google Earth, as Google Earth’s Collada support is somewhat limited. From the KML documentation:

Google Earth supports the COLLADA common profile, with the following exceptions:
* Google Earth supports only triangles and lines as primitive types. The maximum number of triangles allowed is 21845.
* Google Earth does not support animation or skinning.
* Google Earth does not support external geometry references.

The key here is the lack of support of a feature in the Collada format called a polylist. Luckily, in many cases it is simply a matter of editing the Collada file in a text editor and replacing all instances of the word ‘polylist’ with ‘triangles’ (it is also necessary to make sure ‘triangulate’ is ticked in the export options in Blender).

We were then able to simply drag and drop it into Google Earth.

As you can see below, however, it has some purple cubes labelled ‘Don’t render’ from Blender that we don’t want.

We will have to analyse the Collada file and see if we can remove them.

Another problem we encountered is that Google Earth does not automatically zoom in on the model, and if it is very small relative to your view, when you drag the model into Google Earth it can be difficult to find the model.

The post Animating in Google Earth Part 2 – Importing Models appeared first on Google Earth Blog.

09 Nov 14:20

Animating in Google Earth

by Timothy Whitehead

This is the first in a series of posts on animating in Google Earth. It is generally well known that Google Earth can display 3D models provided in KML files. Less well known is that it is possible to do basic animation in Google Earth. We have looked at a number of amazing Google Earth animations over the years, but relative to the other content for Google Earth, animations are extremely rare. There are a number of reasons for this, including a lack of good information regarding how to create these animations and easy to use tooling.

Today we are exploring the three main types of animation and their pros and cons.

In general, none of the animation methods are trivial, and almost all require some programming knowledge or custom tools to achieve a reasonable animation. Google does not provide any tools for creating animations but they do provide basic documentation for each mechanism.

Tours

Google Earth tours provide a mechanism for animating models. The animations are defined within the KML as documented here. Although KML can be typed out by hand this is completely impractical and it is necessary to have a tool that generates the KML as required.

Pros
– The person creating the tour has near complete control over what the user sees. This can be useful as it is quite easy to loose track of a moving model in Google Earth.
– Smooth animations along a line or constant rotation are handled automatically and need a lot less lines of KML than the time-based method.

Cons
– The complete control by the tour creator comes at the cost of practically no control by the user. The tour can be paused so the user can look around, but the user cannot change the view much while the tour is playing so live animations cannot be fully explored.

When to use
This is best used for models that move over a long distance that the viewer would easily lose track of. It is also ideal when you want to include other information that is best suited to being presented in a tour.

Examples
Steven Ho’s Maokong Gondola of Taipei

To see it in Google Earth, download the KML from Steven’s blog.

Captain James Cook’s exploration of Australia by Colin Hazlehurst. (not working, but you can see them on YouTube).

Time-based animations

This uses the Google Earth time toolbar in conjunction with time stamps in a KML file. The relevant KML documentation can be found here.

Pros
– This technique does not take control of the user’s view point so they are free to move around and look at the animation from different angles.

Cons
– It does not have a smooth animation feature, so smooth animations require a lot of frames, which results in very large KML files for long animations.
– The time toolbar can be confusing and users may not even realise that they must use it to view the animation. In addition, the speed of the animation is set by the user, and achieving a specific speed is difficult.

When to use
This is best suited to short, repeating animations.

Examples
The London Eye animation by Barnabu. London Eye Animation with Shadows in Google Earth
Turn off the Google Earth 3D buildings layer for best results.

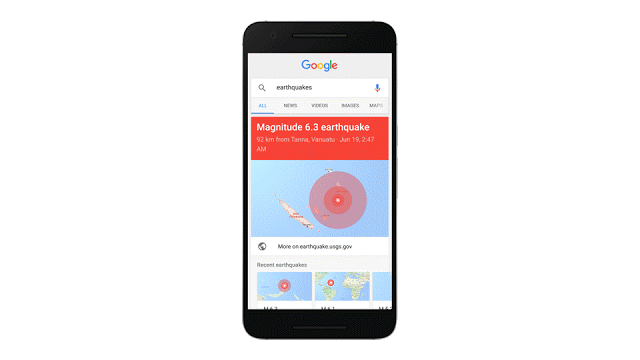
This technique is also used for animations that do not involve models, such as the USGS animated KMLs showing earthquakes over time.

Google Earth API

This uses the Google Earth plugin. Animations can be directly controlled via JavaScript in real time.

Pros
This provides the greatest level of control and allows very complex animations.

Cons
The Google Earth API has been deprecated and could be shut down at any time. In addition, it is only supported in a few browsers (Firefox for example).

Examples
The Monster Milktruck consists of a driving simulator in Google Earth.

The post Animating in Google Earth appeared first on Google Earth Blog.

09 Nov 14:11

Project Sunroof New Data Explorer Tool

by Carl Elkin

Google has always been a proponent of  clean energy, and solar power has been a central part of our vision. Over the past year, Project Sunroof has been helping homeowners explore whether they should go solar - offering solar estimates for over 43 million houses across 42 states. Solar installations today are growing rapidly, but there remains tremendous untapped potential as only a half a percent of US electricity comes from solar power.

Today we’re excited to be taking Project Sunroof a step further by launching a new data explorer tool to enable solar estimates for entire communities, in addition to individual homes, by leveraging 3D rooftop geometry from Google Earth to estimate the solar potential for millions of rooftops in America.  The tool helps communities, cities and municipalities easily visualize how many rooftops are suitable to install solar, how much power they could collectively generate, as well as how much carbon could be displaced by deploying rooftop solar at scale. Sunroof’s solar potential reports can also be easily shared amongst community members, researchers and policymakers directly from the the tool itself. Anyone can use this tool for free, by simply entering in a state, county, city, or zip code to receive a custom analysis.
Sunroof Image 1
Sunroof Image 2

Rooftop solar is a viable option for many cities today. Sunroof’s data explorer found that in more than 90% of communities that the tool covers within 42 states nationwide, well over half the rooftops are viable for solar. Today, cities like Denver and organizations like League of Cities see great value in using the data explorer tool to evaluate whether solar can drive economic savings and growth, as well as help transition energy consumption to lower carbon sources for their communities. Here’s what they have to say;

Cooper Martin, Program Director of the Sustainable Cities Institute,  League of Cities

“Our Sustainable Cities Institute program aims to provide guidance and information for governments that want to pursue sustainability and ensuring that solar is easy, fast and cheap to install. Sunroof's Data Explorer tool can help inform city stakeholders about the opportunity of solar energy, and the work that is needed to support solar-friendly policies. ”
Sunroof Image 4

Thomas J. Herrod, Climate and Policy analyst, City of Denver

“As a City with a bold and ambitious goal of reducing 80% of Greenhouse Gas emissions by the year 2050,  Project Sunroof data is a key tool in our arsenal of potential strategies.  Rooftop solar is already a viable option within Denver, but this tool helps us refine our efforts to ensure equity in our outreach, efficiency in our efforts, and measurement in our management resources.  Of equal importance is the ability to identify where rooftop solar may not be an option – helping us identify areas where other renewable energy programs offered by our Utility can fill the gap.  We are thrilled to be able to utilize Project Sunroof in our Climate mitigation efforts and help inform our community about the bountiful resource that renewable energy can provide.”

Mark Trout, CIO, Vivint

“In previous analysis we've done, comparing Project Sunroof data estimates to actual systems performing in the field, we've found Google's information to be a highly accurate source for predicting the solar performance of a rooftop system. At Vivint Solar we are constantly focusing on how to better delight our customers and advance the solar industry through leading innovation. Project Sunroof is a prime example how technology can improve the consumer experience and accelerate solar deployment here in the US.”

The release of the data explorer tool marks another milestone across the Project Sunroof initiative where the use of Google’s high quality information has the potential to accelerate the growth of solar by capturing the public imagination, and helping communities make smarter decisions in their transition to cleaner power sources.
09 Nov 14:02

Saving Magic Cat Academy from catastrophe!

by Momo

Hi, I’m Momo, a student at the illustrious Magic Cat Academy. Heading to class this morning, I thought it would be just like any other day: learn a few new spells, drink some milk, and hang out with my awesome animal and vegetable pals. To my Halloween horror, hundreds of angry ghosts have invaded the halls of my beloved school — fur real! And now, I ask you to join me to try your hand (or paw!) at fending off these ghastly ghosts with today’s Halloween Google Doodle.

halloweengif

With a swipe of your paw (or should I say wave of your wand), you can help turn these Halloween tricks into a real treat. But be warned, your spell casting must be quick and precise. To send these ghouls into a tailspin, you must draw the symbols that appear above the ghosts’ heads on your screen. Wow! Meow!

game demo

That’s not all: show your friends who’s the real expurrrrrt at casting spells by sharing your score after your sorcery is complete. After all, Halloween festivities are always more fun with your full litter!

goodwork
24 Oct 20:10

Antipode Earth – turning Google Earth inside out

by Timothy Whitehead

We were recently thinking about antipodes (pairs of points on opposite sides of the earth). We have previously seen side by side maps that sync so that you can find what is on the other side of any given point. But we thought it might be interesting to see what the world map looks like when every point is translated to the other side of the world.

We tried two versions. For the first, we used a KML map of country outlines that we have used before, that we got from thematicmapping.org and converted all the coordinates to their antipodes.


Australia is opposite the Atlantic Ocean.

The second version uses one of NASA’s Blue Marble images as an image overlay.


North America is opposite the southern Indian Ocean.

Almost all land has water opposite it with the main exception being South America and East Asia which are opposite each other, but even in that case, a lot of water is involved.

To see the above in Google Earth download this KML file. We suggest editing the properties of the image overlay and try adjusting the transparency.

And finally, for a different way to look at the world, try switching to ‘Sky’ mode. The image overlay does not appear to work in sky mode, but if you turn off all the Sky layers (including ‘imagery’) then the world map KML works and you get a sort of inside out view of the earth.

The post Antipode Earth – turning Google Earth inside out appeared first on Google Earth Blog.

24 Oct 20:04

AI facial recognition is too good, in two different ways!

by Timothy Whitehead

Artificial intelligence based facial recognition is improving over time. However, it is a bit too good at recognising faces as two recent stories illustrate. The first problem is Google’s automatic facial recognition as used to blur faces in Street View imagery, tends to err on the over eager side and ends up blurring faces of statues, people in paintings, and now even a cow. Read more about it here (expect a lot of bovine puns).


A cow in Cambridge, England, has its face blurred for privacy reasons. See in Street View

The second story found here and here says that artificial intelligence based facial recognition can still identify faces fairly accurately even with face blurring. This would suggest that Google’s efforts to blur people’s faces in Street View may soon be thwarted and they will need to redo it all with a more secure method. The easiest reliable method is to completely cover faces with a square of solid colour. Another sightlier alternative would be to subtly warp faces in addition to blurring them so as to fool facial recognition algorithms. This should work until reliable body recognition becomes common place (yes that’s a real thing and probably works even better on cows than facial recognition does).

The post AI facial recognition is too good, in two different ways! appeared first on Google Earth Blog.

24 Oct 19:19

Get polling place and ballot information quickly and easily

by Jacob Schonberg

Voting matters — and history proves it. In 1839, the Massachusetts gubernatorial election was decided by just two votes out of 102,066. The same was the case in a 1974 New Hampshire Senate race — out of 233,363 votes, only two made the difference. And in 2008, an Alaskan State House race was decided by a single vote.

With Election Day just 25 days away, it’s time to make your vote count. Throughout the summer, we’ve helped voters find information about how to register and how to vote, in both English and Spanish. Now, as you prepare to head to the polls, we want to make sure you know where to vote and who’s on your ballot when you get there.
Google, for the election

From President and Vice President, to Congressperson and County Commissioner, a simple search for “who’s on my ballot” will help you find info on the candidates, as well as detailed information on your state’s referenda. You can tap on a candidate’s name from your ballot to find information about them, including their party and website.

ballot_new.width-551.png

The final step: showing up! With various polling places popping up across your hometown, we want to make sure you find the info you need from state to state. Starting today and as we continue to add data from each state over the next couple of weeks, whether you’re planning to vote early or in person on November 8, just search “where to vote” and Google will display a polling place location finder as well as voting ID requirements.

pollingplace_new.width-551.png

While people can find this crucial information right in Google Search, we’re also opening this data up to other organizations for free. From technology companies like Uber, Twitter, Expedia and Hotels.com to nonprofits like Pew Charitable TrustsThe Voting Information Project, and Democracy Works’ TurboVote Challenge, organizations of all shapes and sizes can use our products and the Google Civic Information API to create tools that get this information into the hands of as many voters possible.

We hope these features will help you get the information you need, when you need it. Your vote matters, so make it count.
24 Oct 19:04

Turning graphs into music with Science Journal

by Katie DektarMaking & Science team

We try to make products that work for users of all abilities and backgrounds. Making tools accessible does more than just make them better for users with disabilities; it makes them better for everyone. Our Science Journal app — designed for kids (and adults!) to observe and experiment the world around them through their Android devices — is an example of this.


Together with the Exploratorium, we just released a new activity in Science Journal called Light Instruments: an activity that enables you to design and build a musical instrument played by changing the light that reaches it. The ability to turn graphs into sound was actually originally a feature we designed for accessibility.


Science Journal enables people to observe, record, experiment and make predictions with real-world data. The app makes use of the many built-in sensors our phones contain, as well as other external sensors connected over Bluetooth. It graphs that data over time to help analyze, compare and reflect trends in a way that exploring individual sensor values would never allow us to do. The issue here though, is that not all users are able to see these graphs. And we wanted to do something about that.


Consulting with Google’s Accessibility Engineering team, we started to brainstorm ways to communicate data trends in real-time for users with visual impairments. We decided to try to graph sonification, and use non-speech audio to convey data trends. By implementing a simple sonification that generated tones with frequencies that changed depending on the value of the current data point within the graph’s minimum and maximum, we allowed users to listen to live data and then “play back” graph sonifications of already-recorded data (source code). In short, we translated points on the graph to musical notes!
sonification in action

When we shared this feature with our partners at the Exploratorium, they saw more than an accessibility tool for users with low vision. As believers in “low floor / high ceiling” learning experiences (where users can enter at any background level and continue to learn and grow within the experience), they saw graph sonification as a way for kids with little-to-no experience analyzing graphs to start developing graph literacy and understanding data trends, lowering the “floor” for kids to do scientific exploration.


So together, we created the playful Light Instruments activity where musical “instruments” play based on changes in light levels. These instruments are made from light sensors connected to external Bluetooth devices which, when connected to the Science Journal app, will show the sensor’s value and change as the levels of light do, and produce different “notes” through the graph sonification.


As an example, here’s a “flute” that uses light and a photoresistor connected to the Science Journal app:
 a “flute” that uses light and a photoresistor connected to the Science Journal app

Visualizing data is cool, but listening to it adds a whole new way to help us understand trends and outliers in new ways. We can’t wait to see what sounds you’ll generate!

24 Oct 18:48

An extinct world brought back to life with Google Arts & Culture

by Google Blogs
Many millions of years ago, dinosaurs ruled the Earth and sea dragons were not just Hollywood creations, but fearsome predators that stalked the oceans. It’s a world that vanished long ago, but one that continues to fascinate those seeking to understand the origins of life on our planet.

Starting today, anyone, anywhere can explore this world on Google Arts & Culture. We’ve partnered with 50+ of the world’s leading natural history institutions to bring this lost world to life again online. More than 150 interactive stories from experts, 300,000 new photos and videos, and more than 30 virtual tours await you...


With just a few clicks, you can come face to face with a 180 million year old giant, as virtual reality raises the colossal sea dragon from extinction. Discovered in Dorset in the U.K. and residing at London’s Natural History Museum. The Rhomaleosaurus — to give it its formal name — can now be explored in 360 degrees.


We also used VR to bring the Giraffatitan back to life in Berlin’s natural history museum. Standing at 13 meters (42 feet), it’s one of the tallest dinosaurs that ever lived. It was twice as tall as today’s giraffes, and could easily put its head through a fourth floor window.


We wanted to give you a glimpse of how these colossal creatures actually looked. So we worked with ecologists, paleontologists and biologists to put virtual skin and flesh on the preserved skeletons. From the size of the eye to the position of the snout and the bend of the neck, the texture and creases of the skin were all painstakingly recreated, and verified by a team of scientists. For the best experience, use a viewer like Google Cardboard to look the beast in the eye.

In addition to the VR experiences, this global exhibition of natural history has plenty more for experts and armchair explorers alike:

  • Turn back time by 4.6 billion years with the help of the Natural History Museum by scrolling through the history of life from the origins of the solar system, through the rise and the fall of prehistoric worlds.
  • See the giant sloth jaw that led Darwin to his groundbreaking theory of natural selection.
  • Explore the diversity of nature from the Lion fish to the Paradise Birdwing and learn from birds about the art of flirting.
  • View 3,000 species on display in one giant cabinet or find out how our own predecessors may have looked.
  • With Street View, walk around dinosaurs in New York, explore 30+ natural history museums from to Australia to Russia and even go underwater with turtles in Brazil.
  • Join YouTube’s Vsauce2 to discover the story of Martha, the last passenger pigeon.
The free collection opens today at g.co/naturalhistory and through the Google Arts & Culture mobile app on iOS and Android. And if you’re a teacher, there are more than 20 new Google Expeditions waiting for you and your classroom to discover. We hope you enjoy this journey through the history of nature as much as we do.


Posted by Amit Sood, Director of the Google Cultural Institute https://3.bp.blogspot.com/-yQoDsqVHEUY/V9cc-KEwxyI/AAAAAAAAS74/z5cylfCXQcYt6jm54mssXq03UVBB7yhjQCLcB/s1600/Screen%2BShot%2B2016-09-12%2Bat%2B2.23.37%2BPM.png Amit Sood Director of the Google Cultural Institute Google -->
24 Oct 18:27

The art of collaboration: from Sheets to the streets

by Michael Bolognino
Warhol & Basquiat. Buñuel & Dalí. Rauschenberg & Johns. There are countless examples of artists collaborating to bring a shared creative vision to life. So we wondered: Could technology help bring together two artists who might not otherwise meet? What would they create…if their canvas were a spreadsheet? And how could we celebrate and share their work of art with the world?

In partnership with Refinery29, a lifestyle digital media company, we linked up with renowned illustrators Marina Esmeraldo in Barcelona, and Mallory Heyer in NYC. We gave them a simple creative assignment—to “break the grid”—which literally can mean pushing the “grid” of Google Sheets to its limits, but also taps into the idea of supporting and celebrating women globally who break free of confined roles and ways of thinking, which is core to Refinery29's mission.

The Art of Collaboration: From Sheets to the Streets
Marina and Mallory connected a handful of times on Google Hangouts to plan and sketch out ideas, and creatively “hack” Sheets in order to make art: resizing cells into thousands of pixel-like squares, merging cells to create color blocks, creating vibrant color gradients with conditional formatting and cell values, and other cool things we had no idea you could do with Sheets.

The result was a bright, beautiful design that celebrates the diversity and strength of women, and we wanted to share their finished project in a BIG way.

final_art (1).png

The final step was to convert Marina and Mallory’s final piece from the cells of a spreadsheet to the bricks of a giant wall—to go from Sheets to the streets. So, we turned to Colossal Media, a Brooklyn-based company that hand-paints murals all over the world.

Time-lapse: The Art of Collaboration

After hand-mixing each of the colors and prepping the artwork for large-scale painting, Colossal spent five days painting each cell, letter, and gradient by hand, to create a 13’ x 34’ mural of the spreadsheet

And that’s how art was #madewithGoogleSheets.

To see it for yourself, check out Marina & Mallory’s spreadsheet or head to Bogart & Thames in Brooklyn to visit the wall in person (until August 14). We're delighted by the creativity and imagination brought about by artistic collaboration, and proud to be associated with the work’s inspirational message supporting strong women everywhere.
24 Oct 18:09

Experience virtual reality art in your browser

by Jeff Nusz
Two weeks ago, we introduced Tilt Brush, a new app that enables artists to use virtual reality to paint the 3D space around them. Part virtual reality, part physical reality, it can be difficult to describe how it feels without trying it firsthand. Today, we bring you a little closer to the experience of painting with Tilt Brush using the powers of the web in a new Chrome Experiment titled Virtual Art Sessions.
VR Art COMPILATION.gif
Virtual Art Sessions lets you observe six world-renowned artists as they develop blank canvases into beautiful works of art using Tilt Brush. Each session can be explored from start to finish from any angle, including the artist’s perspective – all viewable right from the browser.

Participating artists include illustrator Christoph Niemann, fashion illustrator Katie Rodgers, sculptor Andrea Blasich, installation artist Seung Yul Oh, automotive concept designer Harald Belker, and street artist duo Sheryo & Yok. The artists’ unique approaches to this new medium become apparent when seeing them work inside their Tilt Brush creations. Watch this behind-the-scenes video to hear what the artists had to say about their experience:
Virtual Art Sessions makes use of Google Chrome’s V8 Javascript engine for high-performance processing power to render large volumes of data in real time. This includes point cloud data of the artist’s physical form, 3D geometry data of the artwork, and position data of the VR controllers. It also relies on Chrome’s support of WebM video and WebGL to produce the 360° representations of the artists and artwork – the artist portrayals alone require the browser to draw over 200,000 points at 30 times a second. For a deeper look, read the technical case study or browse the project code that is available open source from the site’s tech page.

We hope this experiment provides a window into the world of painting in virtual reality using Tilt Brush. We are excited by this new medium and hope the experience leaves you feeling the same. Visit g.co/VirtualArtSessions to start exploring.

23 Oct 17:03

Stay safe and informed in case of an earthquake

by Chris Keitel

The U.S. Geological Survey estimates that approximately 500,000 earthquakes occur around the globe each year, 100,000 of which can be felt. Now people who feel the effects of an earthquake can ask Google directly about the disaster and get timely information to help them stay safe.

In the event of an earthquake, searches for “earthquake,” “earthquakes near me” or similar queries will give you an at-a-glance summary about the quake, right at the top of the search page.
EarthquakesFlow_cutout_transparent.gif
Information will include a summary of the size of the quake, a map of the affected areas, and tips to safely navigate the aftermath. Oftentimes, you really want to know whether you just felt a small earthquake nearby, or a larger earthquake farther away. The map will show areas that shook with various intensities (known as a shakemap), so you’ll be able to quickly assess the reach of the earthquake as well as its epicenter.

You’ll also find clearly displayed tips on what to do next to stay safe from damaged buildings and during potential earthquake aftershocks. To give you the ability to confirm aftershocks in the hours and days after the event, we’ll also show information about other recent earthquakes to put the tremors into context.

We hope that by displaying this result directly in Search, people will have fast and easy access to the information they need to stay safe in the face of an earthquake.