Shared posts

02 Dec 22:44

Reactive Streams in Java: Concurrency with RxJava, Reactor, and Akka Streams

by foxebook

Editorial Reviews

Get an easy introduction to reactive streams in Java to handle concurrency, data streams, and the propagation of change in today's applications. This compact book includes in-depth introductions to RxJava, Akka Streams, and Reactor, and integrates the latest related features from Java 9 and 11, as well as reactive streams programming with the Android SDK.

Reactive Streams in Java explains how to manage the exchange of stream data across an asynchronous boundary―passing elements on to another thread or thread-pool―while ensuring that the receiving side is not forced to buffer arbitrary amounts of data which can reduce application efficiency.  After reading and using this book, you'll be proficient in programming reactive streams for Java in order to optimize application performance, and improve memory management and data exchanges.

What You Will Learn

  • Discover reactive streams and how to use them
  • Work with the latest features in Java 9 and Java 11
  • Apply reactive streams using RxJava
  • Program using Akka Streams
  • Carry out reactive streams programming in Android

Who This Book Is For

Experienced Java programmers.

Table of Contents

Chapter 1: Introduction to Reactive Streams
Chapter 2: Existing Models of Concurrency in Java
Chapter 3: Common Concepts
Chapter 4: RxJava
Chapter 5: Reactor
Chapter 6: Akka Streams
Chapter 7: Android and RxJava
Chapter 8: Spring Boot and Reactor
Chapter 9: Akka HTTP and Akka Streams
Chapter 10: Conclusions
Appendix A: Java 10 and 11

Book Details

  • Author: Adam L. Davis
  • Pages: 139 pages
  • Edition: 1st ed.
  • Publication Date: 2019-01-08
  • Publisher: Apress
  • Language: English
  • ISBN-10: 1484241754
  • ISBN-13: 9781484241752

Book Preview

Click to Look Inside This eBook: Browse Sample Pages

PDF eBook Free Download

Note: There is a file embedded within this post, please visit this post to download the file.

The post Reactive Streams in Java: Concurrency with RxJava, Reactor, and Akka Streams appeared first on Fox eBook.

02 Dec 22:37

Beginning Ethical Hacking with Kali Linux: Computational Techniques for Resolving Security Issues

by foxebook

Editorial Reviews

Get started in white-hat ethical hacking using Kali Linux. This book starts off by giving you an overview of security trends, where you will learn the OSI security architecture. This will form the foundation for the rest of Beginning Ethical Hacking with Kali Linux. With the theory out of the way, you’ll move on to an introduction to VirtualBox, networking, and common Linux commands, followed by the step-by-step procedure to build your own web server and acquire the skill to be anonymous . When you have finished the examples in the first part of your book, you will have all you need to carry out safe and ethical hacking experiments.

After an introduction to Kali Linux, you will carry out  your first penetration tests with Python and code raw binary packets for use in those tests. You will learn how to find secret directories on a target system, use a TCP client in Python, and scan ports using NMAP. Along the way you will discover effective ways to collect important information, track email, and use important tools such as DMITRY and Maltego, as well as take a look at the five phases of penetration testing.

The coverage of vulnerability analysis includes sniffing and spoofing, why ARP poisoning is a threat, how SniffJoke prevents poisoning, how to analyze protocols with Wireshark, and using sniffing packets with Scapy. The next part of the book shows you detecting SQL injection vulnerabilities, using sqlmap, and applying brute force or password attacks. Besides learning these tools, you will see how to use OpenVas, Nikto, Vega, and Burp Suite.

The book will explain the information assurance model and the hacking framework Metasploit, taking you through important commands, exploit and payload basics. Moving on to hashes and passwords you will learn password testing and hacking techniques with John the Ripper and Rainbow. You will then dive into classic and modern encryption techniques where you will learn   the conventional cryptosystem.

In the final chapter you will acquire the skill of exploiting remote Windows and Linux systems and you will learn how to own a target completely.

What You Will Learn

  • Master common Linux commands and networking techniques
  • Build your own Kali web server and learn to be anonymous
  • Carry out penetration testing using Python
  • Detect sniffing attacks and SQL injection vulnerabilities
  • Learn tools such as SniffJoke, Wireshark, Scapy, sqlmap, OpenVas, Nikto, and Burp Suite
  • Use Metasploit with Kali Linux
  • Exploit remote Windows and Linux systems

Who This Book Is For

Developers new to ethical hacking with a basic understanding of Linux programming.

Table of Contents

Chapter 1: Security Trends
Chapter 2: Setting Up a Penetration Testing and Network Security Lab
Chapter 3: Elementary Linux Commands
Chapter 4: Know Your Network
Chapter 5: How to Build a Kali Web Server
Chapter 6: Kali Linux from the Inside Out
Chapter 7: Kali Linux and Python
Chapter 8: Information Gathering
Chapter 9: SQL Mapping
Chapter 10: Vulnerability Analysis
Chapter 11: Information Assurance Model
Chapter 12: Introducing Metasploit in Kali Linux
Chapter 13: Hashes and Passwords
Chapter 14: Classic and Modern Encryption
Chapter 15: Exploiting Targets

Book Details

  • Author: Sanjib Sinha
  • Pages: 417 pages
  • Edition: 1st ed.
  • Publication Date: 2018-12-27
  • Publisher: Apress
  • Language: English
  • ISBN-10: 1484238907
  • ISBN-13: 9781484238905

Book Preview

Click to Look Inside This eBook: Browse Sample Pages

PDF eBook Free Download

Note: There is a file embedded within this post, please visit this post to download the file.

The post Beginning Ethical Hacking with Kali Linux: Computational Techniques for Resolving Security Issues appeared first on Fox eBook.

02 Dec 22:33

Beginning PHP and MySQL: From Novice to Professional, 5th Edition

by foxebook

Editorial Reviews

Get started with PHP and MySQL programming: no experience necessary. This fifth edition of a classic best-seller includes detailed instructions for configuring the ultimate PHP 7 and MySQL development environment on all major platforms, complete coverage of the latest additions and improvements to the PHP language, and thorough introductions to MySQL’s most relied-upon features.

You'll not only receive extensive introductions to the core features of PHP, MySQL, and related tools, but you'll also learn how to effectively integrate them in order to build robust data-driven applications. Author Frank M. Kromann draws upon more than 20 years of experience working with these technologies to pack this book with practical examples and insight into the real-world challenges faced by developers. Accordingly, you will repeatedly return to this book as both a valuable instructional tool and reference guide.

What You Will Learn

  • Install PHP, MySQL, and several popular web servers
  • Get started with PHP, including using its string-handling, networking, forms-processing, and object-oriented features
  • Gain skills in MySQL’s fundamental features, including supported data types, database management syntax, triggers, views, stored routine syntax, and import/export capabilities
  • Work with hundreds of examples demonstrating countless facets of PHP and MySQL integration

Who This Book Is For

Anyone who wants to get started using PHP to write dynamic web applications.

Table of Contents

Chapter 1: Introducing PHP
Chapter 2: Configuring Your Environment
Chapter 3: PHP Basics
Chapter 4: Functions
Chapter 5: Arrays
Chapter 6: Object-Oriented PHP
Chapter 7: Advanced OOP Features
Chapter 8: Error and Exception Handling
Chapter 9: Strings and Regular Expressions
Chapter 10: Working with the File and Operating System
Chapter 11: Third-Party Libraries
Chapter 12: Date and Time
Chapter 13: Forms
Chapter 14: Authenticating Your Users
Chapter 15: Handling File Uploads
Chapter 16: Networking
Chapter 17: Session Handlers
Chapter 18: Web Services
Chapter 19: Secure PHP Programming
Chapter 20: Integrating jQuery and PHP
Chapter 21: MVC and Frameworks
Chapter 22: Introducing MySQL
Chapter 23: Installing and Configuring MySQL
Chapter 24: The Many MySQL Clients
Chapter 25: MySQL Storage Engines and Data Types
Chapter 26: Securing MySQL
Chapter 27: Using PHP with MySQL
Chapter 28: Introducing PDO
Chapter 29: Stored Routines
Chapter 30: MySQL Triggers
Chapter 31: MySQL Views
Chapter 32: Practical Database Queries
Chapter 33: Indexes and Searching
Chapter 34: Transactions
Chapter 35: Importing and Exporting Data

Book Details

  • Author: Frank M. Kromann
  • Pages: 875 pages
  • Edition: 5th ed.
  • Publication Date: 2018-12-29
  • Publisher: Apress
  • Language: English
  • ISBN-10: 1430260432
  • ISBN-13: 9781430260431

Book Preview

Click to Look Inside This eBook: Browse Sample Pages

PDF eBook Free Download

Note: There is a file embedded within this post, please visit this post to download the file.

The post Beginning PHP and MySQL: From Novice to Professional, 5th Edition appeared first on Fox eBook.

02 Dec 22:31

AI for Data Science

by foxebook

Editorial Reviews

AI for Data Science: Artificial Intelligence Frameworks and Functionality for Deep Learning, Optimization, and Beyond

Master the approaches and principles of Artificial Intelligence (AI) algorithms, and apply them to Data Science projects with Python and Julia code.

Aspiring and practicing Data Science and AI professionals, along with Python and Julia programmers, will practice numerous AI algorithms and develop a more holistic understanding of the field of AI, and will learn when to use each framework to tackle projects in our increasingly complex world.

The first two chapters introduce the field, with Chapter 1 surveying Deep Learning models and Chapter 2 providing an overview of algorithms beyond Deep Learning, including Optimization, Fuzzy Logic, and Artificial Creativity.

The next chapters focus on AI frameworks; they contain data and Python and Julia code in a provided Docker, so you can practice. Chapter 3 covers Apache's MXNet, Chapter 4 covers TensorFlow, and Chapter 5 investigates Keras. After covering these Deep Learning frameworks, we explore a series of optimization frameworks, with Chapter 6 covering Particle Swarm Optimization (PSO), Chapter 7 on Genetic Algorithms (GAs), and Chapter 8 discussing Simulated Annealing (SA).

Chapter 9 begins our exploration of advanced AI methods, by covering Convolutional Neural Networks (CNNs) and Recurrent Neural Networks (RNNs). Chapter 10 discusses optimization ensembles and how they can add value to the Data Science pipeline.

Chapter 11 contains several alternative AI frameworks including Extreme Learning Machines (ELMs), Capsule Networks (CapsNets), and Fuzzy Inference Systems (FIS).

Chapter 12 covers other considerations complementary to the AI topics covered, including Big Data concepts, Data Science specialization areas, and useful data resources to experiment on.

A comprehensive glossary is included, as well as a series of appendices covering Transfer Learning, Reinforcement Learning, Autoencoder Systems, and Generative Adversarial Networks. There is also an appendix on the business aspects of AI in data science projects, and an appendix on how to use the Docker image to access the book's data and code.

The field of AI is vast, and can be overwhelming for the newcomer to approach. This book will arm you with a solid understanding of the field, plus inspire you to explore further.

Table of Contents

Chapter 1: Deep Learning Frameworks
Chapter 2: AI Methodologies Beyond Deep Learning
Chapter 3: Building a DL Network Using MXNet
Chapter 4: Building a DL Network Using TensorFlow
Chapter 5: Building a DL Network Using Keras
Chapter 6: Building an Optimizer Based on the Particle Swarm Optimization Algorithm
Chapter 7: Building an Optimizer Based on Genetic Algorithms
Chapter 8: Building an Optimizer Based on Simulated Annealing
Chapter 9: Building an Advanced Deep Learning System
Chapter 10: Building an Optimization Ensemble
Chapter 11: Alternative AI Frameworks in Data Science
Chapter 12: Next Steps

Book Details

Book Preview

Click to Look Inside This eBook: Browse Sample Pages

PDF eBook Free Download

Note: There is a file embedded within this post, please visit this post to download the file.

The post AI for Data Science appeared first on Fox eBook.

29 Nov 22:34

Enterprise Java Microservices

by foxebook

Editorial Reviews

Summary

Enterprise Java Microservices is an example-rich tutorial that shows how to design and manage large-scale Java applications as a collection of microservices.

Purchase of the print book includes a free eBook in PDF, Kindle, and ePub formats from Manning Publications.

About the Technology

Large applications are easier to develop and maintain when you build them from small, simple components. Java developers now enjoy a wide range of tools that support microservices application development, including right-sized app servers, open source frameworks, and well-defined patterns. Best of all, you can build microservices applications using your existing Java skills.

About the Book

Enterprise Java Microservices teaches you to design and build JVM-based microservices applications. You'll start by learning how microservices designs compare to traditional Java EE applications. Always practical, author Ken Finnigan introduces big-picture concepts along with the tools and techniques you'll need to implement them. You'll discover ecosystem components like Netflix Hystrix for fault tolerance and master the Just enough Application Server (JeAS) approach. To ensure smooth operations, you'll also examine monitoring, security, testing, and deploying to the cloud.

What's inside

  • The microservices mental model
  • Cloud-native development
  • Strategies for fault tolerance and monitoring
  • Securing your finished applications

About the Reader

This book is for Java developers familiar with Java EE.

About the Author

Ken Finnigan leads the Thorntail project at Red Hat, which seeks to make developing microservices for the cloud with Java and Java EE as easy as possible.

Table of Contents

Part 1. Microservices basics
Chapter 1. Enterprise Java microservices
Chapter 2. Developing a simple RESTful microservice
Chapter 3. Just enough Application Server for microservices
Chapter 4. Microservices testing
Chapter 5. Cloud native development

Part 2. Implementing Enterprise Java microservices
Chapter 6. Consuming microservices
Chapter 7. Discovering microservices for consumption
Chapter 8. Strategies for fault tolerance and monitoring
Chapter 9. Securing a microservice
Chapter 10. Architecting a microservice hybrid
Chapter 11. Data streaming with Apache Kafka

Appendix. Spring Boot microservices

Book Details

  • Author: Ken Finnigan
  • Pages: 272 pages
  • Edition: 1
  • Publication Date: 2018-11-05
  • Publisher: Manning Publications
  • Language: English
  • ISBN-10: 1617294241
  • ISBN-13: 9781617294242

Book Preview

Click to Look Inside This eBook: Browse Sample Pages

PDF eBook Free Download

Note: There is a file embedded within this post, please visit this post to download the file.

The post Enterprise Java Microservices appeared first on Fox eBook.

25 Nov 22:26

Artificial Intelligence for Business

by foxebook

Editorial Reviews

Artificial Intelligence for Business: What You Need to Know about Machine Learning and Neural Networks

Artificial intelligence (AI) has landed on Earth like an alien spacecraft from a science fiction novel. We now have self-driving cars; computers that can diagnose illnesses, recommend treatments, and predict and solve crimes; smart phones that can route us from point A to point B; gadgets that can understand and respond to spoken commands; and much more. All of this is made possible by machine learning (ML). Although AI and ML can be used to help us answer questions and solve problems, for many of us they create more questions than answers, questions such as “What is intelligence?” “How do machines learn?” “What is a machine learning algorithm, and how does it work?” “Will machines take my job?” “Will they take over the world?” and, for those in business, “What do I need to know about AI and ML to harness its power?” This book tackles those questions and more as it brings you up to speed on the basics of AI, ML, and artificial neural networks. You begin by reading the story of AI that traces its evolution from the early 1950s to the present, revealing many of the core ideas that continue to drive its development. You explore recent technological innovations that have reinvigorated the field by providing the “big data” that makes machine learning so powerful — innovations such as GPS, social media and electronic transactions. And you discover how machines learn through the use of powerful processing combined with machine learning algorithms and artificial neural networks that mimic the function of the human brain. All of these ideas are discussed against a backdrop of potential new business opportunities and technologies, so you can begin to harness the power of AI to achieve and maintain competitive advantage.

Table of Contents

Part I. Thinking Machines: An Overview Of Artificial Intelligence
Chapter 1. What Is Artificial Intelligence?
Chapter 2. The Rise Of Machine Learning
Chapter 3. Zeroing In On The Best Approach
Chapter 4. Common Ai Applications
Chapter 5. Putting Ai To Work On Big Data
Chapter 6. Weighing Your Options

Part II. Machine Learning
Chapter 7. What Is Machine Learning?
Chapter 8. Different Ways A Machine Learns
Chapter 9. Popular Machine Learning Algorithms
Chapter 10. Applying Machine Learning Algorithms
Chapter 11. Words Of Advice

Part III. Artificial Neural Networks
Chapter 12. What Are Artificial Neural Networks?
Chapter 13. Artificial Neural Networks In Action
Chapter 14. Letting Your Network Learn
Chapter 15. Using Neural Networks To Classify Or Cluster
Chapter 16. Key Challenges

Book Details

  • Author: Doug Rose
  • Pages: 200 pages
  • Edition: 1
  • Publication Date: 2018-05-02
  • Publisher: Chicago Lakeshore Press
  • Language: English
  • ISBN-10: 0986435619
  • ISBN-13: 9780986435614

Book Preview

Click to Look Inside This eBook: Browse Sample Pages

PDF eBook Free Download

Note: There is a file embedded within this post, please visit this post to download the file.

The post Artificial Intelligence for Business appeared first on Fox eBook.

25 Nov 22:20

Collect, Combine, and Transform Data Using Power Query in Excel and Power BI

by foxebook

Editorial Reviews

Using Power Query, you can import, reshape, and cleanse any data from a simple interface, so you can mine that data for all of its hidden insights. Power Query is embedded in Excel, Power BI, and other Microsoft products, and leading Power Query expert Gil Raviv will help you make the most of it. Discover how to eliminate time-consuming manual data preparation, solve common problems, avoid pitfalls, and more. Then, walk through several complete analytics challenges, and integrate all your skills in a realistic chapter-length final project. By the time you’re finished, you’ll be ready to wrangle any data–and transform it into actionable knowledge.

Prepare and analyze your data the easy way, with Power Query

  • Quickly prepare data for analysis with Power Query in Excel (also known as Get & Transform) and in Power BI
  • Solve common data preparation problems with a few mouse clicks and simple formula edits
  • Combine data from multiple sources, multiple queries, and mismatched tables
  • Master basic and advanced techniques for unpivoting tables
  • Customize transformations and build flexible data mashups with the M formula language
  • Address collaboration challenges with Power Query
  • Gain crucial insights into text feeds
  • Streamline complex social network analytics so you can do it yourself

For all information workers, analysts, and any Excel user who wants to solve their own business intelligence problems.

Table of Contents

Chapter 1, Introduction to Power Query
Chapter 2, Basic Data Preparation Challenges
Chapter 3, Combining Data from Multiple Sources
Chapter 4, Combining Mismatched Tables
Chapter 5, Preserving Context
Chapter 6, Unpivoting Tables
Chapter 7, Advanced Unpivoting and Pivoting of Tables
Chapter 8, Addressing Collaboration Challenges
Chapter 9, Introduction to the Power Query M Formula Language
Chapter 10, From Pitfalls to Robust Queries
Chapter 11, Basic Text Analytics
Chapter 12, Advanced Text Analytics: Extracting Meaning
Chapter 13, Social Network Analytics
Chapter 14, Final Project: Combining It All Together

Book Details

  • Author: Gil Raviv
  • Pages: 432 pages
  • Edition: 1
  • Publication Date: 2018-11-04
  • Publisher: Microsoft Press
  • Language: English
  • ISBN-10: 1509307958
  • ISBN-13: 9781509307951

Book Preview

Click to Look Inside This eBook: Browse Sample Pages

PDF eBook Free Download

Note: There is a file embedded within this post, please visit this post to download the file.

The post Collect, Combine, and Transform Data Using Power Query in Excel and Power BI appeared first on Fox eBook.

25 Nov 22:14

Mastering SQL Server 2014 Data Mining

by foxebook

Editorial Reviews

Master selecting, applying, and deploying data mining models to build powerful predictive analysis frameworks

About This Book

  • Understand the different phases of data mining, along with the tools used at each stage
  • Explore the different data mining algorithms in depth
  • Become an expert in optimizing algorithms and situation-based modeling

Who This Book Is For

If you are a developer who is working on data mining for large companies and would like to enhance your knowledge of SQL Server Data Mining Suite, this book is for you. Whether you are brand new to data mining or are a seasoned expert, you will be able to master the skills needed to build a data mining solution.

In Detail

Whether you are new to data mining or are a seasoned expert, this book will provide you with the skills you need to successfully create, customize, and work with Microsoft Data Mining Suite. Starting with the basics, this book will cover how to clean the data, design the problem, and choose a data mining model that will give you the most accurate prediction.

Next, you will be taken through the various classification models such as the decision tree data model, neural network model, as well as Naive Bayes model. Following this, you'll learn about the clustering and association algorithms, along with the sequencing and regression algorithms, and understand the data mining expressions associated with each algorithm. With ample screenshots that offer a step-by-step account of how to build a data mining solution, this book will ensure your success with this cutting-edge data mining system.

Table of Contents

Chapter 1: Identifying, Staging, and Understanding Data
Chapter 2: Data Model Preparation and Deployment
Chapter 3: Tools of the Trade
Chapter 4: Preparing the Data
Chapter 5: Classification Models
Chapter 6: Segmentation and Association Models
Chapter 7: Sequence and Regression Models
Chapter 8: Data Mining Using Excel and Big Data
Chapter 9: Tuning the Models
Chapter 10: Troubleshooting

Book Details

Book Preview

Click to Look Inside This eBook: Browse Sample Pages

PDF eBook Free Download

Note: There is a file embedded within this post, please visit this post to download the file.

The post Mastering SQL Server 2014 Data Mining appeared first on Fox eBook.

25 Nov 22:10

Introducing Microsoft SQL Server 2014

by foxebook

Editorial Reviews

NOTE: This title is also available as a free eBook on the Microsoft Download Center. It is offered for sale in print format as a convenience.

Get a head start evaluating SQL Server 2014 - guided by two experts who have worked with the technology from the earliest beta. Based on Community Technology Preview 2 (CTP2) software, this guide introduces new features and capabilities, with practical insights on how SQL Server 2014 can meet the needs of your business. Get the early, high-level overview you need to begin preparing your deployment now.

Coverage includes:

  • SQL Server 2014 Editions and engine enhancements
  • Mission-critical performance enhancements
  • Hybrid cloud enhancements
  • Self-service Business Intelligence enhancements in Microsoft Excel
  • Enterprise information management enhancements
  • Big Data solutions

Table of Contents

Part 1: Database administration
Chapter 1: SQL Server 2014 editions and engine enhancements
Chapter 2: In-Memory OLTP investments
Chapter 3: High-availability, hybrid-cloud, and backup enhancements

Part 2: Business intelligence development
Chapter 4: Exploring self-service BI in Microsoft Excel 2013
Chapter 5: Introducing Power BI for Office 365
Chapter 6: Big data solutions

Book Details

Book Preview

Click to Look Inside This eBook: Browse Sample Pages

PDF eBook Free Download

Note: There is a file embedded within this post, please visit this post to download the file.

The post Introducing Microsoft SQL Server 2014 appeared first on Fox eBook.

25 Nov 21:46

Node.js in Action, 2nd Edition

by foxebook

Editorial Reviews

Summary

Node.js in Action, Second Edition is a thoroughly revised book based on the best-selling first edition. It starts at square one and guides you through all the features, techniques, and concepts you'll need to build production-quality Node applications.

Purchase of the print book includes a free eBook in PDF, Kindle, and ePub formats from Manning Publications.

About the Technology

You already know JavaScript. The trick to mastering Node.js is learning how to build applications that fully exploit its powerful asynchronous event handling and non-blocking I/O features. The Node server radically simplifies event-driven real-time apps like chat, games, and live data analytics, and with its incredibly rich ecosystem of modules, tools, and libraries, it's hard to beat!

About the Book

Based on the bestselling first edition, Node.js in Action, Second Edition is a completely new book. Packed with practical examples, it teaches you how to create high-performance web servers using JavaScript and Node. You'll master key design concepts such as asynchronous programming, state management, and event-driven programming. And you'll learn to put together MVC servers using Express and Connect, design web APIs, and set up the perfect production environment to build, lint, and test.

What's Inside

  • Mastering non-blocking I/O
  • The Node event loop
  • Testing and deploying
  • Web application templating

About the Reader

Written for web developers with intermediate JavaScript skills.

About the Authors

The Second Edition author team includes Node masters Alex Young, Bradley Meck, Mike Cantelon, and Tim Oxley, along with original authors Marc Harter, T.J. Holowaychuk, and Nathan Rajlich.

Table of Contents

PART 1 - WELCOME TO NODE
Chapter 1 Welcome To Node.Js
Chapter 2 Node Programming Fundamentals
Chapter 3 What Is A Node Web Application?

PART 2 - WEB DEVELOPMENT WITH NODE
Chapter 1 Front-End Build Systems
Chapter 2 Server-Side Frameworks
Chapter 3 Connect And Express In Depth
Chapter 4 Web Application Templating
Chapter 5 Storing Application Data
Chapter 6 Testing Node Applications
Chapter 7 Deploying Node Applications And Maintaining Uptime

PART 3 - BEYOND WEB DEVELOPMENT
Chapter 1 Writing Command-Line Applications
Chapter 2 Conquering The Desktop With Electron

Book Details

Book Preview

Click to Look Inside This eBook: Browse Sample Pages

PDF eBook Free Download

Note: There is a file embedded within this post, please visit this post to download the file.

The post Node.js in Action, 2nd Edition appeared first on Fox eBook.

25 Nov 21:39

Securing SQL Server: DBAs Defending the Database, 2nd Edition

by foxebook

Editorial Reviews

Protect your data from attack by using SQL Server technologies to implement a defense-in-depth strategy for your database enterprise. This new edition covers threat analysis, common attacks and countermeasures, and provides an introduction to compliance that is useful for meeting regulatory requirements such as the GDPR. The multi-layered approach in this book helps ensure that a single breach does not lead to loss or compromise of confidential, or business sensitive data.

div>Database professionals in today’s world deal increasingly with repeated data attacks against high-profile organizations and sensitive data. It is more important than ever to keep your company’s data secure. Securing SQL Server demonstrates how developers, administrators and architects can all play their part in the protection of their company’s SQL Server enterprise.

This book not only provides a comprehensive guide to implementing the security model in SQL Server, including coverage of technologies such as Always Encrypted, Dynamic Data Masking, and Row Level Security, but also looks at common forms of attack against databases, such as SQL Injection and backup theft, with clear, concise examples of how to implement countermeasures against these specific scenarios. Most importantly, this book gives practical advice and engaging examples of how to defend your data, and ultimately your job, against attack and compromise. 

What You'll Learn

  • Perform threat analysis
  • Implement access level control and data encryption
  • Avoid non-reputability by implementing comprehensive auditing
  • Use security metadata to ensure your security policies are enforced
  • Mitigate the risk of credentials being stolen
  • Put countermeasures in place against common forms of attack

Who This Book Is For

Database administrators who need to understand and counteract the threat of attacks against their company’s data, and useful for SQL developers and architects

Table of Contents

Part I: Database Security
Chapter 1: Threat Analysis and Compliance
Chapter 2: SQL Server Security Model
Chapter 3: SQL Server Audit
Chapter 4: Data-Level Security
Chapter 5: Encryption in SQL Server
Chapter 6: Security Metadata
Chapter 7: Implementing Service Accounts for Security
Chapter 8: Protecting Credentials
Chapter 9: Reducing the Attack Surface

Part II: Threats and Countermeasures
Chapter 10: SQL Injection
Chapter 11: Hijacking an Instance
Chapter 12: Database Backup Theft
Chapter 13: Code Injection
Chapter 14: Whole Value Substitution Attacks

Book Details

  • Author: Peter A. Carter
  • Pages: 349 pages
  • Edition: 2nd ed.
  • Publication Date: 2018-12-16
  • Publisher: Apress
  • Language: English
  • ISBN-10: 1484241606
  • ISBN-13: 9781484241608

Book Preview

Click to Look Inside This eBook: Browse Sample Pages

PDF eBook Free Download

Note: There is a file embedded within this post, please visit this post to download the file.

The post Securing SQL Server: DBAs Defending the Database, 2nd Edition appeared first on Fox eBook.

25 Nov 21:30

Microservices for the Enterprise: Designing, Developing, and Deploying

by foxebook

Editorial Reviews

Understand the key challenges and solutions around building microservices in the enterprise application environment. This book provides a comprehensive understanding of microservices architectural principles and how to use microservices in real-world scenarios.

Architectural challenges using microservices with service integration and API management are presented and you learn how to eliminate the use of centralized integration products such as the enterprise service bus (ESB) through the use of composite/integration microservices. Concepts in the book are supported with use cases, and emphasis is put on the reality that most of you are implementing in a “brownfield” environment in which you must implement microservices alongside legacy applications with minimal disruption to your business.

Microservices for the Enterprise covers state-of-the-art techniques around microservices messaging, service development and description, service discovery, governance, and data management technologies and guides you through the microservices design process. Also included is the importance of organizing services as core versus atomic, composite versus integration, and API versus edge, and how such organization helps to eliminate the use of a central ESB and expose services through an API gateway.

What You'll Learn

  • Design and develop microservices architectures with confidence
  • Put into practice the most modern techniques around messaging technologies
  • Apply the Service Mesh pattern to overcome inter-service communication challenges
  • Apply battle-tested microservices security patterns to address real-world scenarios
  • Handle API management, decentralized data management, and observability 

Who This Book Is For

Developers and DevOps engineers responsible for implementing applications around a microservices architecture, and architects and analysts who are designing such systems

Table of Contents

Chapter 1: The Case for Microservices
Chapter 2: Designing Microservices
Chapter 3: Inter-Service Communication
Chapter 4: Developing Services
Chapter 5: Data Management
Chapter 6: Microservices Governance
Chapter 7: Integrating Microservices
Chapter 8: Deploying and Running Microservices
Chapter 9: Service Mesh
Chapter 10: APIs, Events, and Streams
Chapter 11: Microservices Security Fundamentals
Chapter 12: Securing Microservices
Chapter 13: Observability

Book Details

Book Preview

Click to Look Inside This eBook: Browse Sample Pages

PDF eBook Free Download

Note: There is a file embedded within this post, please visit this post to download the file.

The post Microservices for the Enterprise: Designing, Developing, and Deploying appeared first on Fox eBook.

25 Nov 13:19

SQL Server 2017 Developer’s Guide, 2nd Edition

by foxebook

Editorial Reviews

SQL Server 2017 Developer's Guide: A professional guide to designing and developing enterprise database applications

Build smarter and efficient database application systems for your organization with SQL Server 2017

Key Features

  • Build database applications by using the development features of SQL Server 2017
  • Work with temporal tables to get information stored in a table at any time
  • Use adaptive querying to enhance the performance of your queries

Book Description

Microsoft SQL Server 2017 is the next big step in the data platform history of Microsoft as it brings in the power of R and Python for machine learning and containerization-based deployment on Windows and Linux. Compared to its predecessor, SQL Server 2017 has evolved into Machine Learning with R services for statistical analysis and Python packages for analytical processing. This book prepares you for more advanced topics by starting with a quick introduction to SQL Server 2017's new features and a recapitulation of the possibilities you may have already explored with previous versions of SQL Server. The next part introduces you to enhancements in the Transact-SQL language and new database engine capabilities and then switches to a completely new technology inside SQL Server: JSON support. We also take a look at the Stretch database, security enhancements, and temporal tables.

Furthermore, the book focuses on implementing advanced topics, including Query Store, columnstore indexes, and In-Memory OLTP. Towards the end of the book, you'll be introduced to R and how to use the R language with Transact-SQL for data exploration and analysis. You'll also learn to integrate Python code in SQL Server and graph database implementations along with deployment options on Linux and SQL Server in containers for development and testing.

By the end of this book, you will have the required information to design efficient, high-performance database applications without any hassle.

What you will learn

  • Explore the new development features introduced in SQL Server 2017
  • Identify opportunities for In-Memory OLTP technology
  • Use columnstore indexes to get storage and performance improvements
  • Exchange JSON data between applications and SQL Server
  • Use the new security features to encrypt or mask the data
  • Control the access to the data on the row levels
  • Discover the potential of R and Python integration
  • Model complex relationships with the graph databases in SQL Server 2017

Who This Book Is For

Database developers and solution architects looking to design efficient database applications using SQL Server 2017 will find this book very useful. In addition, this book will be valuable to advanced analysis practitioners and business intelligence developers. Database consultants dealing with performance tuning will get a lot of useful information from this book as well.

Some basic understanding of database concepts and T-SQL is required to get the best out of this book.

Table of Contents

Chapter 1. Introduction To Sql Server 2017
Chapter 2. Review Of Sql Server Features For Developers
Chapter 3. Sql Server Tools
Chapter 4. Transact-Sql And Database Engine Enhancements
Chapter 5. Json Support In Sql Server
Chapter 6. Stretch Database
Chapter 7. Temporal Tables
Chapter 8. Tightening The Security
Chapter 9. Query Store
Chapter 10. Columnstore Indexes
Chapter 11. Introducing Sql Server In-Memory Oltp
Chapter 12. In-Memory Oltp Improvements In Sql Server 2017
Chapter 13. Supporting R In Sql Server
Chapter 14. Data Exploration And Predictive Modeling With R In Sql Server
Chapter 15. Introducing Python For Sql Server
Chapter 16. Graph Databases
Chapter 17. Sql Server On Linux / In Containers

Book Details

Book Preview

Click to Look Inside This eBook: Browse Sample Pages

PDF eBook Free Download

Note: There is a file embedded within this post, please visit this post to download the file.

The post SQL Server 2017 Developer’s Guide, 2nd Edition appeared first on Fox eBook.

25 Nov 13:16

Hands-On TypeScript for C# and .NET Core Developers

by foxebook

Editorial Reviews

Hands-On TypeScript for C# and .NET Core Developers: Transition from C# to TypeScript 3.1 and build applications with ASP.NET Core 2

Discover how TypeScript allows you to build modern client-rich applications, thanks to its object-oriented capabilities and third-party tools like Angular and Web APIs

Key Features

  • Make a seamless transition to using TypeScript 3.1 in your development stack
  • Work with TypeScript 3.1 in your ASP.NET Core projects to build rich applications that are easy to maintain
  • Build, test, and integrate your own TypeScript library in real-world projects

Book Description

Writing clean, object-oriented code in JavaScript gets trickier and complex as the size of the project grows. This is where Typescript comes into the picture; it lets you write pure object-oriented code with ease, giving it the upper hand over JavaScript. This book introduces you to basic TypeScript concepts by gradually modifying standard JavaScript code, which makes learning TypeScript easy for C# ASP.NET developers.

As you progress through the chapters, you'll cover object programming concepts, such as classes, interfaces, and generics, and understand how they are related to, and similar in, both ES6 and C#. You will also learn how to use bundlers like WebPack to package your code and other resources. The book explains all concepts using practical examples of ASP.NET Core projects, and reusable TypeScript libraries. Finally, you'll explore the features that TypeScript inherits from either ES6 or C#, or both of them, such as Symbols, Iterables, Promises, and Decorators.

By the end of the book, you'll be able to apply all TypeScript concepts to understand the Angular framework better, and you'll have become comfortable with the way in which modules, components, and services are defined and used in Angular. You'll also have gained a good understanding of all the features included in the Angular/ASP.NET Core Visual Studio project template.

What you will learn

  • Organize, test, and package large TypeScript code base
  • Add TypeScript to projects using TypeScript declaration files
  • Perform DOM manipulation with TypeScript
  • Develop Angular projects with the Visual Studio Angular project template
  • Define and use inheritance, abstract classes, and methods
  • Leverage TypeScript-type compatibility rules
  • Use WebPack to bundle JavaScript and other resources such as CSS to improve performance
  • Build custom directives and attributes, and learn about animations

Who this book is for

If you're a C# or .NET developer looking for an easy accessible way of learning TypeScript, this book is for you.

Table of Contents

Chapter 1. Introduction To Typescript
Chapter 2. Complex Types And Functions
Chapter 3. Dom Manipulation
Chapter 4. Using Classes And Interfaces
Chapter 5. Generics
Chapter 6. Namespaces And Modules
Chapter 7. Bundling With Webpack
Chapter 8. Building Typescript Libraries
Chapter 9. Decorators And Advanced Es6 Features
Chapter 10. Angular Asp.Net Core Project Template
Chapter 11. Input And Interactions
Chapter 12. Advanced Features
Chapter 13. Navigation And Services

Book Details

Book Preview

Click to Look Inside This eBook: Browse Sample Pages

PDF eBook Free Download

Note: There is a file embedded within this post, please visit this post to download the file.

The post Hands-On TypeScript for C# and .NET Core Developers appeared first on Fox eBook.

27 Jul 21:16

封装QTableView,支持冻结列,绘制表头,按钮,复选框,支持字体指定颜色设置等一系列骚操作!!!!

by XChinux@163.com (1250479606)
封装QTableView,支持以下操作
1、绘制复选框
2、绘制按钮,点击响应
3、支持字体指定颜色的设置
4、绘制表头,支持排序、全选等操作
5、支持冻结列,移动滚动条时固定显示前几列
封装这个QTableView类,花了很多心血和时间进行测试,调试,现在已经是成熟的产品了!!!!
程序EXE下载链接:https://download.csdn.net/download/u012765446/10575337
欢迎大家下载程序,进行指正(本人已经测了很多遍,已用于项目中)。。。。。。。
若对源码感兴趣,有偿提供,毕竟花了太多精力,源码不止有QTableView封装类,还有窗口,对话框,QPushButton等封装类。。。。。。。。
联系QQ:2587939109

图片:1.png


图片:2.png


图片:3.png


图片:4.png


图片:5.png


19 Sep 12:19

2017年最受欢迎的10个编程挑战网站

引用

译者注:如果你想不断地提高自己的编程技能,那么不断尝试去解决那些编程中的难题,这是一个非常不错的途径。作者在本篇文章中列举出了10个编程挑战网站,你想尝试一下吗?以下为译文。

如果你正在在学习编程,那么我可以告诉你一个提高技能的好方法,那就是是敢于去解决编码过程中遇到的难题。解决不同类型的难题,可以帮助你成为一名优秀的问题解决者;不管编程语言多复杂,你也会得心应手;另外在面试准备以及学习新算法等很多方面,都会让你变得越来越出色。

下面是一些非常受大众欢迎的编程难题网站列表,文章还对每个网站所提供的信息进行了一番简短的描述。
1. TopCoder

TopCoder是最开始的在线竞技编程平台之一。它提供了很多的算法挑战,用户可以使用平台上的编辑器直接完成挑战。每个月该平台会提供几次它们最受欢迎的Single Round Matches,比赛要求用户在特定的时间内与他人竞争,看谁解决问题的速度更快。

TopCoder上排名靠前的用户都是很有竞争力的程序员,他们会定期参加各种比赛。这些用户还可以通过名称为ALGORITHMS WEEKLY BY PETR MITRICHEV的博客平台去发表一些关于编程竞赛、算法、数学等方面的文章。

2. Coderbyte

Coderbyte提供了200多项编码挑战,挑战者可以使用10门编程语言中的任意一种直接在线解决(看看这个例子)。这些挑战的难易程度各不相同。

另外Coderbyte还提供了很多的算法教程,入门视频和面试准备的课程。与HackerRank和其它网站不同,用户可以查看其他挑战者提供的解决方案,而不是Coderbyte*官方*发布的。

3. Project Euler

Project Euler提供了很多关于计算机科学和数学领域的挑战。挑战内容大致都是要求挑战者编写一段小程序从而为某个数学公式或方程式提供解决方案。

由于不支持直接在编辑器上编程,因此需要用户在自己的电脑上先写好解决方案,然后在网站上再提供出来。

4. HackerRank

HackerRank提供了很多不同领域的挑战,比如算法、数学、SQL、函数式编程、人工智能等等。挑战者可以直接在线完成所有挑战(看看这个例子)。HackerRank针对每一项挑战专门成立了讨论和领导委员会,而大多数挑战来自于一篇社论,它解释了更多的挑战,以及如何接近它提出解决方案。除了这篇社论,你目前还不能看到其他用户在HackerRank上的解决方案。

HackerRank还支持用户提交应用程序,而且通过解决公司发起的编码挑战,挑战者还有机会获得一份工作。

5. CodeChef

CodeChef是一家位于印度的编程竞赛网站,该网站提供了数百种挑战。挑战者可以通过在线编辑器进行编程,而且还可以根据自身的编程能力去查看已经分类好的适合于自己的挑战题目(请查看本示例)。CodeChef有一个庞大的编程社区,为论坛提供帮助,负责编写教程,而且也会参加CodeChef的编码竞赛

6. CodeEval

CodeEval类似于HackerRank,它还提供了很多公司发起的挑战,如果能很好地完成这些挑战,你还有机会得到一份工作。公司可以创建挑战和举办竞争比赛来招募新的工作人员。挑战者可以在这里查看当前的挑战列表。

7. Codewars

Codewars提供了很多的编码挑战,这些挑战都是由他们自己社区提交和编辑的。挑战者可以用几种语言在编辑器中直接在线完成挑战。用户还可以查看针对每个挑战的讨论以及其他用户的解决方案。

8. LeetCode

LeetCode是一个很受欢迎的在线判题系统,它提供了190道挑战题目,这些题目可以帮助挑战者为面试做好技术准备。挑战者可以用9种编程语言直接在线完成挑战。虽然该网站不支持查看其他用户的解决方案,但用户可以为自己的解决方案提供统计数据,例如与其他用户相比,代码运行速度如何。

他们也有一个专门为面试准备的Mock Interview部分,这是由他们自己主持的编码竞赛,其中有一些文章帮助用户更好地了解某些问题。

9. SPOJ

Sphere Online Judge(SPOJ)是一个在线判题系统,提供20000多个编程挑战。挑战者可以直接通过在线编辑器中提交代码。SPOJ还举办了自己的竞赛,并有一个区域专门供用户讨论编码挑战。他们目前没有像其他网站那样提供任何官方解决方案或社论。

10. CodinGame

CodinGame与其他网站有点不同,因为它不是简单地在编辑器中去完成编码挑战,而是让挑战者真正游戏的。用户可以在这里看到当前提供的游戏列表,在这里看到一个示例。这个游戏有一个问题描述,测试用例,和一个编辑器,你可以在其中一个20 +的编程语言编写你的代码。

虽然这个网站不同于上面提到的那些有竞争力的编程网站,但对于那些喜欢挑战并参与竞赛的程序员来说,它还是很受欢迎额。

本文所提及的都是根据以下内容整理出来的:一些是我本人浏览网站时关注到的,一些是通过谷歌搜索基于Quora上的文章,还有一些是诸如这类文章或者那类文章里面涉及到的。我还经常访问一些类似于r/learnprogramming这样的论坛和看板,看看那里的用户通常推荐哪些网站。免责声明:我在Coderbyte工作,这也是上面提到的网站之一。


感谢 jihong10102006 投递这篇资讯

声明:本文系ITeye网站发布的原创资讯,严禁任何网站转载本文,否则必将追究法律责任!

已有 0 人发表留言,猛击->>这里<<-参与讨论


ITeye推荐


19 Sep 12:17

Node.js End-to-End Testing with Nightwatch.js

by Gergely Nemeth
Node.js End-to-End Testing with Nightwatch.js

In this article, we are going to take a look at how you can do end-to-end testing with Node.js, using Nightwatch.js, a Node.js powered end-to-end testing framework.

In the previous chapter of Node.js at Scale, we discussed Node.js Testing and Getting TDD Right. If you did not read that article, or if you are unfamiliar with unit testing and TDD (test-driven development), I recommend checking that out before continuing with this article.

Click to see all chapters of Node.js at Scale:

What is Node.js end-to-end testing?

Before jumping into example codes and learning to implement end-to-end testing for a Node.js project, it's worth exploring what end-to-end tests really are.

First of all, end-to-end testing is part of the black-box testing toolbox. This means that as a test writer, you are examining functionality without any knowledge of internal implementation. So without seeing any source code.

Secondly, end-to-end testing can also be used as user acceptance testing, or UAT. UAT is the process of verifying that the solution actually works for the user. This process is not focusing on finding small typos, but issues that can crash the system, or make it dysfunctional for the user.

Enter Nightwatch.js

Nightwatch.js enables you to "write end-to-end tests in Node.js quickly and effortlessly that run against a Selenium/WebDriver server".

Nightwatch is shipped with the following features:

  • a built-in test runner,
  • can control the selenium server,
  • support for hosted selenium providers, like BrowserStack or SauceLabs,
  • CSS and Xpath selectors.

Installing Nightwatch

To run Nightwatch locally, we have to do a little bit of extra work - we will need a standalone Selenium server locally, as well as a webdriver, so we can use Chrome/Firefox to test our applications locally.

With these three tools, we are going to implement the flow this diagram shows below.

Node.js End-to-End Testing with Nightwatch.js 
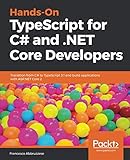
Photo credit: nightwatchjs.org

STEP 1: Add Nightwatch

You can add Nightwatch to your project simply by running npm install nightwatch --save-dev.

This places the Nightwatch executable in your ./node_modules/.bin folder, so you don't have to install it globally.

STEP 2: Download Selenium

Selenium is a suite of tools to automate web browsers across many platforms.

Prerequisite: make sure you have JDK installed, with at least version 7. If you don't have it, you can grab it from here.

The Selenium server is a Java application which is used by Nightwatch to connect to various browsers. You can download the binary from here.

Once you have downloaded the JAR file, create a bin folder inside your project, and place it there. We will set up Nightwatch to use it, so you don't have to manually start the Selenium server.

STEP 3: Download Chromedriver

ChromeDriver is a standalone server which implements the W3C WebDriver wire protocol for Chromium.

To grab the executable, head over to the downloads section, and place it to the same bin folder.

STEP 4: Configuring Nightwatch.js

The basic Nightwatch configuration happens through a json configuration file.

Let's create a nightwatch.json file, and fill it with:

{
  "src_folders" : ["tests"],
  "output_folder" : "reports",

  "selenium" : {
    "start_process" : true,
    "server_path" : "./bin/selenium-server-standalone-3.3.1.jar",
    "log_path" : "",
    "port" : 4444,
    "cli_args" : {
      "webdriver.chrome.driver" : "./bin/chromedriver"
    }
  },

  "test_settings" : {
    "default" : {
      "launch_url" : "http://localhost",
      "selenium_port"  : 4444,
      "selenium_host"  : "localhost",
      "desiredCapabilities": {
        "browserName": "chrome",
        "javascriptEnabled": true,
        "acceptSslCerts": true
      }
    }
  }
}

With this configuration file, we told Nightwatch where can it find the binary of the Selenium server and the Chromedriver, as well as the location of the tests we want to run.


Node.js End-to-End Testing with Nightwatch.js

You shouldn't rely only on e2e testing for QA. Trace helps you to find all issues before your users do.

Node.js monitoring & debugging from the experts of RisingStack
Learn more


Quick Recap

So far, we have installed Nightwatch, downloaded the standalone Selenium server, as well as the Chromedriver. With these steps, you have all the necessary tools to create end-to-end tests using Node.js and Selenium.

Writing your first Nightwatch Test

Let's add a new file in the tests folder, called homepage.js.

We are going to take the example from the Nightwatch getting started guide. Our test script will go to Google, search for Rembrandt, and check the Wikipedia page:

module.exports = {  
  'Demo test Google' : function (client) {
    client
      .url('http://www.google.com')
      .waitForElementVisible('body', 1000)
      .assert.title('Google')
      .assert.visible('input[type=text]')
      .setValue('input[type=text]', 'rembrandt van rijn')
      .waitForElementVisible('button[name=btnG]', 1000)
      .click('button[name=btnG]')
      .pause(1000)
      .assert.containsText('ol#rso li:first-child',
        'Rembrandt - Wikipedia')
      .end()
  }
}

The only thing left to do is to run Nightwatch itself! For that, I recommend adding a new script into our package.json's scripts section:

"scripts": {
  "test-e2e": "nightwatch"
}

The very last thing you have to do is to run the tests using this command:

npm run test-e2e  

If everything goes well, your test will open up Chrome, then Google and Wikipedia.

Nightwatch.js in Your Project

Now as you understood what end-to-end testing is, and how you can set up Nightwatch, it is time to start adding it to your project.

For that, you have to consider some aspects - but please note, that there are no silver bullets here. Depending on your business needs, you may answer the following questions differently:

  • Where should I run? On staging? On production? When don I build my containers?
  • What are the test scenarios I want to test?
  • When and who should write end-to-end tests?

Summary & Next Up

In this chapter of Node.js at Scale we have learned:

  • how to set up Nightwatch,
  • how to configure it to use a standalone Selenium server,
  • and how to write basic end-to-end tests.

In the next chapter, we are going to explore how you can monitor production Node.js infrastructures.

19 Sep 12:17

The Definitive Guide for Monitoring Node.js Applications

by Gergely Nemeth
The Definitive Guide for Monitoring Node.js Applications

In the previous chapters of Node.js at Scale we learned how you can get Node.js testing and TDD right, and how you can use Nightwatch.js for end-to-end testing.

In this article, we will learn about running and monitoring Node.js applications in Production. Let's discuss these topics:

  • What is monitoring?
  • What should be monitored?
  • Open-source monitoring solutions
  • SaaS and On-premise monitoring offerings
Click to see all chapters of Node.js at Scale:

What is Node.js Monitoring?

Monitoring is observing the quality of a software over time. The available products and tools we have in this industry usually go by the term Application Performance Monitoring or APM in short.

If you have a Node.js application in a staging or production environment, you can (and should) do monitoring on different levels:

You can monitor

  • regions,
  • zones,
  • individual servers and,
  • of course, the Node.js software that runs on them.

In this guide we will deal with the software components only, as if you run in a cloud environment, the others are taken care for you usually.

What should be monitored?

Each application you write in Node.js produces a lot of data about its' behavior.

There are different layers where an APM tool should collect data from. The more of them covered, the more insights you'll get about your system's behavior.

  • Service level
  • Host level
  • Instance (or process) level

The list you can find below collects the most crucial problems you'll run into while you maintain a Node.js application in production. We'll also discuss how monitoring helps to solve them and what kind of data you'll need to do so.

Problem 1.: Service Downtimes

If your application is unavailable, your customers can't spend money on your sites. If your API's are down, your business partners and services depending on them will fail as well because of you.

We all know how cringeworthy it is to apologize for service downtimes.

Your topmost priority should be preventing failures and providing 100% availability for your application.

Running a production app comes with great responsibility.

Node.js APM's can easily help you detecting and preventing downtimes, since they usually collect service level metrics.

This data can show if your application handles requests properly, although it won't always help to tell if your public sites or API's are available.

To have a proper coverage on downtimes, we recommend to set up a pinger as well which can emulate user behavior and provide foolproof data on availability. If you want to cover everything, don't forget to include different regions like the US, Europe and Asia too.

Problem 2.: Slow Services, Terrible Response Times

Slow response times have a huge impact on conversion rate, as well as on product usage. The faster your product is the more customers and user satisfaction you'll have.

Usually, all Node.js APM's can show if your services are slowing down, but interpreting that data requires further analysis.

I recommend doing two things to find the real reasons for slowing services.

  • Collect data on a process level too. Check out each instance of a service to figure out what happens under the hood.
  • Request CPU profiles when your services slow down and analyze them to find the faulty functions.

Eliminating performance bottlenecks enables you to scale your software more efficiently and also to optimize your budget.

Problem 3.: Solving Memory Leaks is Hard

Our Node.js Consulting & Development expertise allowed us to build huge enterprise systems and help developers making them better.

What we see constantly is that Memory Leaks in Node.js applications are quite frequent and that finding out what causes them is among the greatest struggles Node developers face.

This impression is backed with data as well. Our Node.js Developer Survey showed that Memory Leaks cause a lot of headache for even the best engineers.

To find memory leaks, you have to know exactly when they happen.

Some APM's collect memory usage data which can be used to recognize a leak. What you should look for is the steady growth of memory usage which ends up in a service crash & restart (as Node runs out of memory after 1,4 Gigabytes).

The Definitive Guide for Monitoring Node.js Applications

If your APM collects data on the Garbage Collector as well, you can look for the same pattern. As extra objects in a Node app's memory pile up, the time spent with Garbage Collection increases simultaneously. This is a great indicator of the Memory Leak.

After figuring out that you have a leak, request a memory heapdump and look for the extra objects!

This sounds easy in theory but can be challenging in practice.

What you can do is request 2 heapdumps from your production system with a Monitoring tool, and analyze these dumps with Chrome's DevTools. If you look for the extra objects in comparison mode, you'll end up seeing what piles up in your app's memory.

If you'd like a more detailed rundown on these steps, I wrote one article about finding a Node.js memory leak in Ghost, where I go into more details.

Problem 4.: Depending on Code Written by Anonymus

Most of the Node.js applications heavily rely on npm. We can end up with a lot of dependencies written by developers of unknown expertise and intentions.

Roughly 76% of Node shops use vulnerable packages, while open source projects regularly grow stale, neglecting to fix security flaws.

There are a couple of possible steps to lower the security risks of using npm packages.

  1. Audit your modules with the Node Security Platform CLI
  2. Look for unused dependencies with the depcheck tool
  3. Use the npm stats API, or browse historic stats on npm-stat.com to find out if others using a package
  4. Use the npm view <pkg> maintainers command to avoid packages maintained by only a few
  5. Use the npm outdated command or Greenkeeper to learn whether you're using the latest version of a package.

Going through these steps can consume a lot of your time, so picking a Node.js Monitoring Tool which can warn you about insecure dependencies is highly recommended.

Problem 6.: Email Alerts often go Unnoticed

Let's be honest. We are developers who like spending time writing code - not going through our email account every 10 minutes..

According to my experience, email alerts are usually unread and it's very easy to miss out on a major outage or problem if we depend only on them.

Email is a subpar method to learn about issues in production.

I guess that you also don't want to watch dashboards for potential issues 24/7. This is why it is important to look for an APM with great alerting capabilities.

What I recommend is to use pager systems like opsgenie or pagerduty to learn about critical issues. Pair up the monitoring solution of your choice with one of these systems if you'd like to know about your alerts instantly.

A few alerting best-practices we follow at RisingStack:

  • Always keep alerting simple and alert on symptoms
  • Aim to have as few alerts as possible - associated with end-user pain
  • Alert on high response time and error rates as high up in the stack as possible

Problem 7.: Finding Crucial Errors in the Code

If a feature is broken on your site, it can prevent customers from achieving their goals. Sometimes it can be a sign of bad code quality. Make sure you have proper test coverage for your codebase and a good QA process (preferably automated).

If you use an APM that collects errors from your app then you'll be able to find the ones which occur more often.

The more data your APM is accessing, better the chances of finding and fixing critical issues. We recommend to use a monitoring tool which collects and visualises stack traces as well - so you'll be able to find the root causes of errors in a distributed system.


In the next part of the article, I will show you one open-source, and one SaaS / on-premises Node.js monitoring solution that will help you operate your applications.

Prometheus - an Open-Source, General Purpose Monitoring Platform

Prometheus is an open-source systems monitoring and alerting toolkit originally built at SoundCloud.

Prometheus was started in 2012, and since then, many companies and organizations have adopted the tool. It is a standalone open source project and maintained independently of any company.

In 2016, Prometheus joined the Cloud Native Computing Foundation, right after Kubernetes.

The most important features of Prometheus are:

  • a multi-dimensional data model (time series identified by metric name and key/value pairs),
  • a flexible query language to leverage this dimensionality,
  • time series collection happens via a pull model over HTTP by default,
  • pushing time series is supported via an intermediary gateway.

Node.js monitoring with prometheus

As you could see from the previous features, Prometheus is a general purpose monitoring solution, so you can use it with any language or technology you prefer.

Check out the official Prometheus getting started pages if you'd like to give it a try.

Before you start monitoring your Node.js services, you need to add instrumentation to them via one of the Prometheus client libraries.

For this, there is a Node.js client module, which you can find here. It supports histograms, summaries, gauges and counters.

Essentially, all you have to do is require the Prometheus client, then expose its output at an endpoint:

const Prometheus = require('prom-client')  
const server = require('express')()

server.get('/metrics', (req, res) => {  
  res.end(Prometheus.register.metrics())
})

server.listen(process.env.PORT || 3000)  

This endpoint will produce an output, that Prometheus can consume - something like this:

# HELP process_start_time_seconds Start time of the process since unix epoch in seconds.
# TYPE process_start_time_seconds gauge
process_start_time_seconds 1490433285  
# HELP process_resident_memory_bytes Resident memory size in bytes.
# TYPE process_resident_memory_bytes gauge
process_resident_memory_bytes 33046528  
# HELP nodejs_eventloop_lag_seconds Lag of event loop in seconds.
# TYPE nodejs_eventloop_lag_seconds gauge
nodejs_eventloop_lag_seconds 0.000089751  
# HELP nodejs_active_handles_total Number of active handles.
# TYPE nodejs_active_handles_total gauge
nodejs_active_handles_total 4  
# HELP nodejs_active_requests_total Number of active requests.
# TYPE nodejs_active_requests_total gauge
nodejs_active_requests_total 0  
# HELP nodejs_version_info Node.js version info.
# TYPE nodejs_version_info gauge
nodejs_version_info{version="v4.4.2",major="4",minor="4",patch="2"} 1  

Of course, these are just the default metrics which were collected by the module we have used - you can extend it with yours. In the example below we collect the number of requests served:

const Prometheus = require('prom-client')  
const server = require('express')()

const PrometheusMetrics = {  
  requestCounter: new Prometheus.Counter('throughput', 'The number of requests served')
}

server.use((req, res, next) => {  
  PrometheusMetrics.requestCounter.inc()
  next()
})

server.get('/metrics', (req, res) => {  
  res.end(Prometheus.register.metrics())
})

server.listen(3000)  

Once you run it, the /metrics endpoint will include the throughput metrics as well:

# HELP process_start_time_seconds Start time of the process since unix epoch in seconds.
# TYPE process_start_time_seconds gauge
process_start_time_seconds 1490433805  
# HELP process_resident_memory_bytes Resident memory size in bytes.
# TYPE process_resident_memory_bytes gauge
process_resident_memory_bytes 25120768  
# HELP nodejs_eventloop_lag_seconds Lag of event loop in seconds.
# TYPE nodejs_eventloop_lag_seconds gauge
nodejs_eventloop_lag_seconds 0.144927586  
# HELP nodejs_active_handles_total Number of active handles.
# TYPE nodejs_active_handles_total gauge
nodejs_active_handles_total 0  
# HELP nodejs_active_requests_total Number of active requests.
# TYPE nodejs_active_requests_total gauge
nodejs_active_requests_total 0  
# HELP nodejs_version_info Node.js version info.
# TYPE nodejs_version_info gauge
nodejs_version_info{version="v4.4.2",major="4",minor="4",patch="2"} 1  
# HELP throughput The number of requests served
# TYPE throughput counter
throughput 5  

Once you have exposed all the metrics you have, you can start querying and visualizing them - for that, please refer to the official Prometheus query documentation and the vizualization documentation.

As you can imagine, instrumenting your codebase can take quite some time - since you have to create your dashboard and alerts to make sense of the data. While sometimes these solutions can provide greater flexibility for your use-case than hosted solutions, it can take months to implement them & then you have to deal with operating them as well.

If you have the time to dig deep into the topic, you'll be fine with it.

Meet Trace - our SaaS, and On-premises Node.js Monitoring Tool

As we just discussed, running your own solution requires domain knowledge, as well as expertise on how to do proper monitoring. You have to figure out what aggregation to use for what kind of metrics, and so on..

This is why it can make a lot of sense to go with a hosted monitoring solution - whether it is a SaaS product or an on-premises offering.

At RisingStack, we are developing our own Node.js Monitoring Solution, called Trace. We built all the experience into Trace which we gained through the years of providing professional Node services.

What's nice about Trace, is that you have all the metrics you need with only adding a single line of code to your application - so it really takes only a few seconds to get started.

require('@risingstack/trace')  

After this, the Trace collector automatically gathers your application's performance data and visualizes it for you in an easy to understand way.

Just a few things Trace is capable to do with your production Node app:

  1. Send alerts about Downtimes, Slow services & Bad Status Codes.
  2. Ping your websites and API's with an external service + show APDEX metrics.
  3. Collect data on service, host and instance levels as well.
  4. Automatically create a (10 second-long) CPU profile in a production environment in case of a slowdown.
  5. Collect data on memory consumption and garbage collection.
  6. Create memory heapdumps automatically in case of a Memory Leak in production.
  7. Show errors and stack traces from your application.
  8. Visualize whole transaction call-chains in a distributed system.
  9. Show how your services communicate with each other on a live map.
  10. Automatically detect npm packages with security vulnerabilities.
  11. Mark new deployments and measure their effectiveness.
  12. Integrate with Slack, Pagerduty, and Opsgenie - so you'll never miss an alert.

Although Trace is currently a SaaS solution, we'll make an on-premises version available as well soon.

It will be able to do exactly the same as the cloud version, but it will run on Amazon VPC or in your own datacenter. If you're interested in it, let's talk!

Summary

I hope that in this chapter of Node.js at Scale I was able to give useful advice about monitoring your Node.js application. In the next article, you will learn how to debug Node.js applications in an easy way.

19 Sep 12:16

Mastering the Node.js CLI & Command Line Options

by Gergely Nemeth
Mastering the Node.js CLI & Command Line Options

Node.js comes with a lot of CLI options to expose built-in debugging & to modify how V8, the JavaScript engine works.

In this post, we have collected the most important CLI commands to help you become more productive.

Accessing Node.js CLI Options

To get a full list of all available Node.js CLI options in your current distribution of Node.js, you can access the manual page from the terminal using:

$ man node

Usage: node [options] [ -e script | script.js ] [arguments]  
       node debug script.js [arguments] 

Options:  
  -v, --version         print Node.js version
  -e, --eval script     evaluate script
  -p, --print           evaluate script and print result
  -c, --check           syntax check script without executing
...

As you can see in the first usage section, you have to provide the optional options before the script you want to run.

Take the following file:

console.log(new Buffer(100))  

To take advantage of the --zero-fill-buffers option, you have to run your application using:

$ node --zero-fill-buffers index.js

This way the application will produce the correct output, instead of random memory garbage:

<Buffer 00 00 00 00 00 00 00 00 00 00 00 00 00 00 00 00 00 00 00 00 00 00 00 00 00 00 00 00 00 00 00 00 00 00 00 00 00 00 00 00 00 00 00 00 00 00 00 00 00 00 ... >  

CLI Options

Now as we saw how you instruct Node.js to use CLI options, let's see what other options are there!

--version or -v

Using the node --version, or short, node -v, you can print the version of Node.js you are using.

$ node -v
v6.10.0  

--eval or -e

Using the --eval option, you can run JavaScript code right from your terminal. The modules which are predefined in REPL can also be used without requiring them, like the http or the fs module.

$ node -e 'console.log(3 + 2)'
5  

--print or -p

The --print option works the same way as the --eval, however it prints the result of the expression. To achieve the same output as the previous example, we can simply leave the console.log:

$ node -p '3 + 2'
5  

--check or -c

Available since v4.2.0

The --check option instructs Node.js to check the syntax of the provided file, without actually executing it.

Take the following example again:

console.log(new Buffer(100)  

As you can see, a closing ) is missing. Once you run this file using node index.js, it will produce the following output:

/Users/gergelyke/Development/risingstack/mastering-nodejs-cli/index.js:1
(function (exports, require, module, __filename, __dirname) { console.log(new Buffer(100)
                                                                                        ^
SyntaxError: missing ) after argument list  
    at Object.exports.runInThisContext (vm.js:76:16)
    at Module._compile (module.js:542:28)
    at Object.Module._extensions..js (module.js:579:10)
    at Module.load (module.js:487:32)
    at tryModuleLoad (module.js:446:12)
    at Function.Module._load (module.js:438:3)
    at Module.runMain (module.js:604:10)
    at run (bootstrap_node.js:394:7)

Using the --check option you can check for the same issue, without executing the script, using node --check index.js. The output will be similar, except you won't get the stack trace, as the script never ran:

/Users/gergelyke/Development/risingstack/mastering-nodejs-cli/index.js:1
(function (exports, require, module, __filename, __dirname) { console.log(new Buffer(100)
                                                                                        ^
SyntaxError: missing ) after argument list  
    at startup (bootstrap_node.js:144:11)
    at bootstrap_node.js:509:3

The --check option can come handy, when you want to see if your script is syntactically correct, without executing it.


Expert help when you need it the most

Commercial Node.js Support by RisingStack
Learn more


--inspect[=host:port]

Available since v6.3.0

Using node --inspect will activate the inspector on the provided host and port. If they are not provided, the default is 127.0.0.1:9229. The debugging tools attached to Node.js instances communicate via a tcp port using the Chrome Debugging Protocol.

--inspect-brk[=host:port]

Available since v7.6.0

The --inspect-brk has the same functionality as the --inspect option, however it pauses the execution at the first line of the user script.

$ node --inspect-brk index.js 
Debugger listening on port 9229.  
Warning: This is an experimental feature and could change at any time.  
To start debugging, open the following URL in Chrome:  
    chrome-devtools://devtools/bundled/inspector.html?experiments=true&v8only=true&ws=127.0.0.1:9229/86dd44ef-c865-479e-be4d-806d622a4813

Once you have ran this command, just copy and paste the URL you got to start debugging your Node.js process.

--zero-fill-buffers

Available since v6.0.0

Node.js can be started using the --zero-fill-buffers command line option to force all newly allocated Buffer instances to be automatically zero-filled upon creation. The reason to do so is that newly allocated Buffer instances can contain sensitive data.

It should be used when it is necessary to enforce that newly created Buffer instances cannot contain sensitive data, as it has significant impact on performance.

Also note, that some Buffer constructors got deprecated in v6.0.0:

  • new Buffer(array)
  • new Buffer(arrayBuffer[, byteOffset [, length]])
  • new Buffer(buffer)
  • new Buffer(size)
  • new Buffer(string[, encoding])

Instead, you should use Buffer.alloc(size[, fill[, encoding]]), Buffer.from(array), Buffer.from(buffer), Buffer.from(arrayBuffer[, byteOffset[, length]]) and Buffer.from(string[, encoding]).

You can read more on the security implications of the Buffer module on the Synk blog.

--prof-process

Using the --prof-process, the Node.js process will output the v8 profiler output.

To use it, first you have to run your applications using:

node --prof index.js  

Once you ran it, a new file will be placed in your working directory, with the isolate- prefix.

Then, you have to run the Node.js process with the --prof-process option:

node --prof-process isolate-0x102001600-v8.log > output.txt  

This file will contain metrics from the V8 profiler, like how much time was spent in the C++ layer, or in the JavaScript part, and which function calls took how much time. Something like this:

[C++]:
   ticks  total  nonlib   name
     16   18.4%   18.4%  node::ContextifyScript::New(v8::FunctionCallbackInfo<v8::Value> const&)
      4    4.6%    4.6%  ___mkdir_extended
      2    2.3%    2.3%  void v8::internal::String::WriteToFlat<unsigned short>(v8::internal::String*, unsigned short*, int, int)
      2    2.3%    2.3%  void v8::internal::ScavengingVisitor<(v8::internal::MarksHandling)1, (v8::internal::LoggingAndProfiling)0>::ObjectEvacuationStrategy<(v8::internal::ScavengingVisitor<(v8::internal::MarksHandling)1, (v8::internal::LoggingAndProfiling)0>::ObjectContents)1>::VisitSpecialized<24>(v8::internal::Map*, v8::internal::HeapObject**, v8::internal::HeapObject*)

[Summary]:
   ticks  total  nonlib   name
      1    1.1%    1.1%  JavaScript
     70   80.5%   80.5%  C++
      5    5.7%    5.7%  GC
      0    0.0%          Shared libraries
     16   18.4%          Unaccounted

To get a full list of Node.js CLI options, check out the official documentation here.


V8 Options

You can print all the available V8 options using the --v8-options command line option.

Currently V8 exposes more than a 100 command line options - here we just picked a few to showcase some of the functionality they can provide. Some of these options can drastically change how V8 behaves, use them with caution!

--harmony

With the harmony flag, you can enable all completed harmony features.

--max_old_space_size

With this option, you can set the maximum size of the old space on the heap, which directly affects how much memory your process can allocate.

This setting can come handy when you run in low memory environments.

--optimize_for_size

With this option, you can instruct V8 to optimize the memory space for size - even if the application gets slower.

Just as the previous option, it can be useful in low memory environments.


Environment Variables

NODE_DEBUG=module[,…]

Setting this environment variable enables the core modules to print debug information. You can run the previous example like this to get debug information on the module core component (instead of module, you can go for http, fs, etc...):

$ NODE_DEBUG=module node index.js

The output will be something like this:

MODULE 7595: looking for "/Users/gergelyke/Development/risingstack/mastering-nodejs-cli/index.js" in ["/Users/gergelyke/.node_modules","/Users/gergelyke/.node_libraries","/Users/gergelyke/.nvm/versions/node/v6.10.0/lib/node"]  
MODULE 7595: load "/Users/gergelyke/Development/risingstack/mastering-nodejs-cli/index.js" for module "."  

NODE_PATH=path

Using this setting, you can add extra paths for the Node.js process to search modules in.

OPENSSL_CONF=file

Using this environment variable, you can load an OpenSSL configuration file on startup.

For a full list of supported environment variables, check out the official Node.js docs.

Let's Contribute to the CLI related Node Core Issues!

As you can see, the CLI is a really useful tool which becomes better with each Node version!

If you'd like to contribute to its advancement, you can help by checking out the currently open issues at https://github.com/nodejs/node/labels/cli !

Mastering the Node.js CLI & Command Line Options

19 Sep 12:16

How to Debug Node.js with the Best Tools Available

by Gergely Nemeth
How to Debug Node.js with the Best Tools Available

Debugging - the process of finding and fixing defects in software - can be a challenging task to do in all languages. Node.js is no exception.

Luckily, the tooling for finding these issues improved a lot in the past period. Let's take a look at what options you have to find and fix bugs in your Node.js applications!

We will dive into two different aspects of debugging Node.js applications - the first one will be logging, so you can keep an eye on production systems, and have events from there. After logging, we will take a look at how you can debug your applications in development environments.

Click to see all chapters of Node.js at Scale:

Logging in Node.js

Logging takes place in the execution of your application to provide an audit trail that can be used to understand the activity of the system and to diagnose problems to find and fix bugs.

For logging purposes, you have lots of options when building Node.js applications. Some npm modules are shipped with built in logging that can be turned on when needed using the debug module. For your own applications, you have to pick a logger too! We will take a look at pino.

Before jumping into logging libraries, let's take a look what requirements they have to fulfil:

  • timestamps - it is crucial to know which event happened when,
  • formatting - log lines must be easily understandable by humans, and straightforward to parse for applications,
  • log destination - it should be always the standard output/error, applications should not concern themselves with log routing,
  • log levels - log events have different severity levels, in most cases, you won't be interested in debug or info level events.

The debug module of Node.js

Recommendation: use for modules published on npm

Let's see how it makes your life easier! Imagine that you have a Node.js module that sends serves requests, as well as send out some.

// index.js
const debugHttpIncoming = require('debug')('http:incoming')  
const debugHttpOutgoing = require('debug')('http:outgoing')

let outgoingRequest = {  
  url: 'https://risingstack.com'
}

// sending some request
debugHttpOutgoing('sending request to %s', outgoingRequest.url)

let incomingRequest = {  
  body: '{"status": "ok"}'
}

// serving some request
debugHttpOutgoing('got JSON body %s', incomingRequest.body)  

Once you have it, start your application this way:

DEBUG=http:incoming,http:outgoing node index.js  

The output will be something like this:

How to Debug Node.js with the Best Tools Available

Also, the debug module supports wildcards with the * character. To get the same result we got previously, we simply could start our application with DEBUG=http:* node index.js.

What's really nice about the debug module is that a lot of modules (like Express or Koa) on npm are shipped with it - as of the time of writing this article more than 14.000 modules.

The pino logger module

Recommendation: use for your applications when performance is key

How to Debug Node.js with the Best Tools Available

Pino is an extremely fast Node.js logger, inspired by bunyan. In many cases, pino is over 6x faster than alternatives like bunyan or winston:

benchWinston*10000:     2226.117ms  
benchBunyan*10000:      1355.229ms  
benchDebug*10000:       445.291ms  
benchLogLevel*10000:    322.181ms  
benchBole*10000:        291.727ms  
benchPino*10000:        269.109ms  
benchPinoExtreme*10000: 102.239ms  

Getting started with pino is straightforward:

const pino = require('pino')()

pino.info('hello pino')  
pino.info('the answer is %d', 42)  
pino.error(new Error('an error'))  

The above snippet produces the following log lines:

{"pid":28325,"hostname":"Gergelys-MacBook-Pro.local","level":30,"time":1492858757722,"msg":"hello pino","v":1}
{"pid":28325,"hostname":"Gergelys-MacBook-Pro.local","level":30,"time":1492858757724,"msg":"the answer is 42","v":1}
{"pid":28325,"hostname":"Gergelys-MacBook-Pro.local","level":50,"time":1492858757725,"msg":"an error","type":"Error","stack":"Error: an error\n    at Object.<anonymous> (/Users/gergelyke/Development/risingstack/node-js-at-scale-debugging/pino.js:5:12)\n    at Module._compile (module.js:570:32)\n    at Object.Module._extensions..js (module.js:579:10)\n    at Module.load (module.js:487:32)\n    at tryModuleLoad (module.js:446:12)\n    at Function.Module._load (module.js:438:3)\n    at Module.runMain (module.js:604:10)\n    at run (bootstrap_node.js:394:7)\n    at startup (bootstrap_node.js:149:9)\n    at bootstrap_node.js:509:3","v":1}

The Built-in Node.js Debugger module

Node.js ships with an out-of-process debugging utility, accessible via a TCP-based protocol and built-in debugging client. You can start it using the following command:

$ node debug index.js

This debugging agent is a not a fully featured debugging agent - you won't have a fancy user interface, however, simple inspections are possible.

You can add breakpoints to your code by adding the debugger statement into your codebase:

const express = require('express')  
const app = express()

app.get('/', (req, res) => {  
  debugger
  res.send('ok')
})

This way the execution of your script will be paused at that line, then you can start using the commands exposed by the debugging agent:

  • cont or c - continue execution,
  • next or n - step next,
  • step or s - step in,
  • out or o - step out,
  • repl - to evaluate script's context.

V8 Inspector Integration for Node.js

The V8 inspector integration allows attaching Chrome DevTools to Node.js instances for debugging by using the Chrome Debugging Protocol.

V8 Inspector can be enabled by passing the --inspect flag when starting a Node.js application:

$ node --inspect index.js

In most cases, it makes sense to stop the execution of the application at the very first line of your codebase and continue the execution from that. This way you won't miss any command execution.

$ node --inspect-brk index.js


I recommend watching this video in full-screen mode to get every detail!

How to Debug Node.js with Visual Studio Code

Most modern IDEs have some support for debugging applications - so does VS Code. It has built-in debugging support for Node.js.

What you can see below, is the debugging interface of VS Code - with the context variables, watched expressions, call stack and breakpoints.

How to Debug Node.js with the Best Tools Available Image credit: Visual Studio Code

One of the most valuable features of the integrated Visual Studio Code debugger is the ability to add conditional breakpoints. With conditional breakpoints, the breakpoint will be hit whenever the expression evaluates to true.

If you need more advanced settings for VS Code, it comes with a configuration file, .vscode/launch.json which describes how the debugger should be launched. The default launch.json looks something like this:

{
    "version": "0.2.0",
    "configurations": [
        {
            "type": "node",
            "request": "launch",
            "name": "Launch Program",
            "program": "${workspaceRoot}/index.js"
        },
        {
            "type": "node",
            "request": "attach",
            "name": "Attach to Port",
            "address": "localhost",
            "port": 5858
        }
    ]
}

For advanced configuration settings of launch.json go to https://code.visualstudio.com/docs/editor/debugging#_launchjson-attributes.

For more information on debugging with Visual Studio Code, visit the official site: https://code.visualstudio.com/docs/editor/debugging.

Next Up

If you have any questions about debugging, please let me know in the comments section.

In the next episode of the Node.js at Scale series, we are going to talk about Node.js Post-Mortem Diagnostics & Debugging.

19 Sep 12:16

Node.js Post-Mortem Diagnostics & Debugging

by Gergely Nemeth
Node.js Post-Mortem Diagnostics & Debugging

Post-mortem diagnostics & debugging comes into the picture when you want to figure out what went wrong with your Node.js application in production.

In this chapter of Node.js at Scale we will take a look at node-report, a core project which aims to help you to do post-mortem diagnostics & debugging.

Click to see all chapters of Node.js at Scale:

The node-report diagnostics module

The purpose of the module is to produce a human-readable diagnostics summary file. It is meant to be used in both development and production environments.

The generated report includes:

  • JavaScript and native stack traces,
  • heap statistics,
  • system information,
  • resource usage,
  • loaded libraries.

Currently node-report supports Node.js v4, v6, and v7 on AIX, Linux, MacOS, SmartOS, and Windows.

Adding it to your project just takes an npm install and require:

npm install node-report --save  
//index.js
require('node-report')  

Once you add node-report to your application, it will automatically listen on unhandled exceptions and fatal error events, and will trigger a report generation. Report generation can also be triggered by sending a USR2 signal to the Node.js process.

Use cases of node-report

Diagnostics of exceptions

For the sake of simplicity, imagine you have the following endpoint in one of your applications:

function myListener(request, response) {  
  switch (request.url) {
  case '/exception':
    throw new Error('*** exception.js: uncaught exception thrown from function myListener()');
  }
}

This code simply throws an exception once the /exception route handler is called. To make sure we get the diagnostics information, we have to add the node-report module to our application, as shown previously.

require('node-report')  
function my_listener(request, response) {  
  switch (request.url) {
  case '/exception':
    throw new Error('*** exception.js: uncaught exception thrown from function my_listener()');
  }
}

Let's see what happens once the endpoint gets called! Our report just got written into a file:

Writing Node.js report to file: node-report.20170506.100759.20988.001.txt  
Node.js report completed  


Need assistance running Node.js in production?

Expert help when you need it the most
I want help


The header

Once you open the file, you'll get something like this:

=================== Node Report ===================

Event: exception, location: "OnUncaughtException"  
Filename: node-report.20170506.100759.20988.001.txt  
Dump event time:  2017/05/06 10:07:59  
Module load time: 2017/05/06 10:07:53  
Process ID: 20988  
Command line: node demo/exception.js

Node.js version: v6.10.0  
(ares: 1.10.1-DEV, http_parser: 2.7.0, icu: 58.2, modules: 48, openssl: 1.0.2k, 
 uv: 1.9.1, v8: 5.1.281.93, zlib: 1.2.8)

node-report version: 2.1.2 (built against Node.js v6.10.0, 64 bit)

OS version: Darwin 16.4.0 Darwin Kernel Version 16.4.0: Thu Dec 22 22:53:21 PST 2016; root:xnu-3789.41.3~3/RELEASE_X86_64

Machine: Gergelys-MacBook-Pro.local x86_64  

You can think of this part as a header for your diagnostics summary - it includes..

  • the main event why the report was created,
  • how the Node.js application was started (node demo/exception.js),
  • what Node.js version was used,
  • the host operating system,
  • and the version of node-report itself.

The stack traces

The next part of the report includes the captured stack traces, both for JavaScript and the native part:

=================== JavaScript Stack Trace ===================
Server.myListener (/Users/gergelyke/Development/risingstack/node-report/demo/exception.js:19:5)  
emitTwo (events.js:106:13)  
Server.emit (events.js:191:7)  
HTTPParser.parserOnIncoming [as onIncoming] (_http_server.js:546:12)  
HTTPParser.parserOnHeadersComplete (_http_common.js:99:23)  

In the JavaScript part, you can see..

  • the stack trace (which function called which one with line numbers),
  • and where the exception occurred.

In the native part, you can see the same thing - just on a lower level, in the native code of Node.js

=================== Native Stack Trace ===================
 0: [pc=0x103c0bd50] nodereport::OnUncaughtException(v8::Isolate*) [/Users/gergelyke/Development/risingstack/node-report/api.node]
 1: [pc=0x10057d1c2] v8::internal::Isolate::Throw(v8::internal::Object*, v8::internal::MessageLocation*) [/Users/gergelyke/.nvm/versions/node/v6.10.0/bin/node]
 2: [pc=0x100708691] v8::internal::Runtime_Throw(int, v8::internal::Object**, v8::internal::Isolate*) [/Users/gergelyke/.nvm/versions/node/v6.10.0/bin/node]
 3: [pc=0x3b67f8092a7] 
 4: [pc=0x3b67f99ab41] 
 5: [pc=0x3b67f921533] 

Heap and garbage collector metrics

You can see in the heap metrics how each heap space performed during the creation of the report:

  • new space,
  • old space,
  • code space,
  • map space,
  • large object space.

These metrics include:

  • memory size,
  • committed memory size,
  • capacity,
  • used size,
  • available size.

To better understand how memory handling in Node.js works, check out the following articles:

=================== JavaScript Heap and GC ===================
Heap space name: new_space  
    Memory size: 2,097,152 bytes, committed memory: 2,097,152 bytes
    Capacity: 1,031,680 bytes, used: 530,736 bytes, available: 500,944 bytes
Heap space name: old_space  
    Memory size: 3,100,672 bytes, committed memory: 3,100,672 bytes
    Capacity: 2,494,136 bytes, used: 2,492,728 bytes, available: 1,408 bytes

Total heap memory size: 8,425,472 bytes  
Total heap committed memory: 8,425,472 bytes  
Total used heap memory: 4,283,264 bytes  
Total available heap memory: 1,489,426,608 bytes

Heap memory limit: 1,501,560,832  

Resource usage

The resource usage section includes metrics on..

  • CPU usage,
  • the size of the resident set size,
  • information on page faults,
  • and the file system activity.
=================== Resource usage ===================
Process total resource usage:  
  User mode CPU: 0.119704 secs
  Kernel mode CPU: 0.020466 secs
  Average CPU Consumption : 2.33617%
  Maximum resident set size: 21,965,570,048 bytes
  Page faults: 13 (I/O required) 5461 (no I/O required)
  Filesystem activity: 0 reads 3 writes

System information

The system information section includes..

  • environment variables,
  • resource limits (like open files, CPU time or max memory size)
  • and loaded libraries.

Diagnostics of fatal errors

The node-report module can also help once you have a fatal error, like your application runs out of memory.

By default, you will get an error message something like this:

<--- Last few GCs --->

   23249 ms: Mark-sweep 1380.3 (1420.7) -> 1380.3 (1435.7) MB, 695.6 / 0.0 ms [allocation failure] [scavenge might not succeed].
   24227 ms: Mark-sweep 1394.8 (1435.7) -> 1394.8 (1435.7) MB, 953.4 / 0.0 ms (+ 8.3 ms in 231 steps since start of marking, biggest step 1.2 ms) [allocation failure] [scavenge might not succeed].

On its own, this information is not that helpful. You don't know the context, or what was the state of the application. With node-report, it gets better.

First of all, in the generated post-mortem diagnostics summary you will have a more descriptive event:

Event: Allocation failed - JavaScript heap out of memory, location: "MarkCompactCollector: semi-space copy, fallback in old gen"  

Secondly, you will get the native stack trace - that can help you to understand better why the allocation failed.

Diagnostics of blocking operations

Imagine you have the following loops which block your event loop. This is a performance nightmare.

var list = []  
for (let i = 0; i < 10000000000; i++) {  
  for (let j = 0; i < 1000; i++) {
    list.push(new MyRecord())
  }
  for (let j=0; i < 1000; i++) {
    list[j].id += 1
    list[j].account += 2
  }
  for (let j = 0; i < 1000; i++) {
    list.pop()
  }
}

With node-report you can request reports even when your process is busy, by sending the USR2 signal. Once you do that you will receive the stack trace, and you will see in a minute where your application spends time.

(Examples are taken for the node-report repository)

The API of node-report

Triggering report generation programmatically

The creation of the report can also be triggered using the JavaScript API. This way your report will be saved in a file, just like when it was triggered automatically.

const nodeReport = require('node-report')  
nodeReport.triggerReport()  

Getting the report as a string

Using the JavaScript API, the report can also be retrieved as a string.

const nodeReport = require('nodereport')  
const report = nodeReport.getReport()  

Using without automatic triggering

If you don't want to use automatic triggers (like the fatal error or the uncaught exception) you can opt-out of them by requiring the API itself - also, the file name can be specified as well:

const nodeReport = require('node-report/api')  
nodeReport.triggerReport('name-of-the-report')  

Contribute

If you feel like making Node.js even better, please consider joining the Postmortem Diagnostics working group, where you can contribute to the module.

The Postmortem Diagnostics working group is dedicated to the support and improvement of postmortem debugging for Node.js. It seeks to elevate the role of postmortem debugging for Node, to assist in the development of techniques and tools, and to make techniques and tools known and available to Node.js users.

In the next chapter of the Node.js at Scale series, we will discuss profiling Node.js Applications. If you have any questions, please let me know in the comments section below.

19 Sep 12:15

Node.js + MySQL Example: Handling 100's of GigaBytes of Data

by Tamas Kadlecsik
Node.js + MySQL Example: Handling 100's of GigaBytes of Data

Through this Node.js & MySQL example project, we will take a look at how you can efficiently handle billions of rows that take up hundreds of gigabytes of storage space.

My secondary goal with this article is to help you decide if Node.js + MySQL is a good fit for your needs, and to provide help with implementing such a solution.

The actual code we will use throughout this blogpost can be found on GitHub.

Why Node.js and MySQL?

We use MySQL to store the distributed tracing data of the users of our Node.js Monitoring & Debugging Tool called Trace.

We chose MySQL, because at the time of the decision, Postgres was not really good at updating rows, while for us, updating immutable data would have been unreasonably complex.

Unfortunately, these solutions are not ACID compliant which makes them difficult to use when data consistency is extremely important.

However, with good indexing and proper planning, MySQL can be just as suitable for the task as the above-mentioned NoSQL alternatives.

MySQL has several storage engines. InnoDB is the default one, which comes with the most features. However, one should take into account that InnoDB tables are immutable, meaning every ALTER TABLE statement will copy all the data into a new table. It will make matters worse when the need arises to migrate an already existing database.

If you have nominal values, each having a lot of associated data — e.g. each of your users have millions of products and you have tons of users — it is probably the easiest by creating tables for each of them and giving them names like <user_id>_<entity_name>. This way you can reduce the size of individual tables significantly.

Also, getting rid of a user's data in case of an account removal is an O(1) operation. This is very important, because if you need to remove large amount of values from big tables, MySQL may decide to use the wrong index or not to use indexes at all.

It does not help either that you cannot use index hints for DELETEs. You might need to ALTER your table to remove your data, but that would mean copying each row to a new table.

Creating tables for each user clearly adds complexity, but it may be a big win when it comes to removing users or similar entities with huge amount of associated data.

However, before going for dynamically created tables, you should try deleting rows in chunks as it may help as well and results in less added complexity. Of course, if you have data coming in faster than you can delete, you might get stuck with the aforementioned solution.

But what if your tables are still huge after partitioning them by users and you need to delete outdated rows as well? You still have data coming in faster than you can remove. In this case, you should try MySQL's built in table partitioning. It comes handy when you need to cut your tables by values that are defined on an ordinal or continuous scale, such as a creation timestamp.

Table partitioning with MySQL

With MySQL, a partitioned table will work as if it was multiple tables, but you can use the same interface you got used to, while no additional logic is needed from the application's side. This also means you can drop partitions as if you dropped tables.

The documentation is good, but pretty verbose as well (after all this is not a simple topic), so let's take a quick look at how you should create a partitioned table.

The way we handled our partitions was taken from Rick James's post on the topic. He also gives quite some insight on how you should plan your tables.

CREATE TABLE IF NOT EXISTS tbl (  
      id INTEGER NOT NULL AUTO_INCREMENT,
      data VARCHAR(255) NOT NULL,
      created_at DATETIME NOT NULL DEFAULT CURRENT_TIMESTAMP,
      PRIMARY KEY (id, created_at)
    )

PARTITION BY RANGE (TO_DAYS(created_at)) (  
        start        VALUES LESS THAN (0),
        from20170514 VALUES LESS THAN (TO_DAYS('2017-05-15')),
        from20170515 VALUES LESS THAN (TO_DAYS('2017-05-16')),
        from20170516 VALUES LESS THAN (TO_DAYS('2017-05-17')),
        future       VALUES LESS THAN MAXVALUE
    );

It is nothing unusual until the part PARTITION BY RANGE.

In MySQL, you can partition by RANGE, LIST, COLUMN, HASH and KEY you can read about them in the documentation. Notice that the partitioning key must be part of the primary key or any unique indexes.

The ones starting with from<date> should be self-explanatory. Each partition holds values for which the created_at column is less than the date of the next day. This also means that from20120414 holds all data that are older than 2012-04-15, so this is the partition that we will drop when we perform the cleanup.

The future and start partitions need some explanation: future holds the values for the days we have not yet defined. So if we cannot run repartitioning in time, all data that arrives on 2017-05-17 or later will end up there, making sure we don't lose any of it. start serves as a safety net as well. We expect all rows to have a DATETIME created_at value, however, we need to be prepared for possible errors. If for some reason a row would end up having NULL there, it will end up in the start partition, serving as a sign that we have some debugging to do.

When you use partitioning, MySQL will keep that data on separate parts of the disk as if they were separate tables and organizes your data automatically based on the partitioning key.

There are some restrictions to be taken into account though:

  • Query cache is not supported.
  • Foreign keys are not supported for partitioned InnoDB tables.
  • Partitioned tables do not support FULLTEXT indexes or searches.

There are a lot more, but these are the ones that we felt the most constraining after adopting partitioned tables at RisingStack.

If you want to create a new partition, you need to reorganize an existing one and split it to fit your needs:

ALTER TABLE tbl  
    REORGANIZE PARTITION future INTO (
        from20170517 VALUES LESS THAN (TO_DAYS('2017-05-18')),
        from20170518 VALUES LESS THAN (TO_DAYS('2017-05-19')),
        PARTITION future VALUES LESS THAN MAXVALUE
);

Dropping partitions takes an alter table, yet it runs as if you dropped a table:

ALTER TABLE tbl  
    DROP PARTITION from20170517, from20170518;

As you can see you have to include the actual names and descriptions of the partitions in the statements. They cannot be dynamically generated by MySQL, so you have to handle it in the application logic. That's what we'll cover next.

Table partitioning example with Node.js & MySQL

Let's see the actual solution. For the examples here, we will use knex, which is a query builder for JavaScript. In case you are familiar with SQL, you shouldn't have any problem understanding the code.

First, let's create the table:

const dedent = require('dedent')  
const _ = require('lodash')  
const moment = require('moment')

const MAX_DATA_RETENTION = 7  
const PARTITION_NAME_DATE_FORMAT = 'YYYYMMDD'

Table.create = function () {  
  return knex.raw(dedent`
    CREATE TABLE IF NOT EXISTS \`${tableName}\` (
      \`id\` INTEGER NOT NULL AUTO_INCREMENT,
      \`data\` VARCHAR(255) NOT NULL,
      \`created_at\` DATETIME NOT NULL DEFAULT CURRENT_TIMESTAMP,
      PRIMARY KEY (\`id\`, \`created_at\`)
    )
    PARTITION BY RANGE ( TO_DAYS(\`created_at\`)) (
      PARTITION \`start\` VALUES LESS THAN (0),
      ${Table.getPartitionStrings()}
      PARTITION \`future\` VALUES LESS THAN MAXVALUE
    );
  `)
}

Table.getPartitionStrings = function () {  
  const days = _.range(MAX_DATA_RETENTION - 2, -2, -1)
  const partitions = days.map((day) => {
    const tomorrow = moment().subtract(day, 'day').format('YYYY-MM-DD')
    const today = moment().subtract(day + 1, 'day').format(PARTITION_NAME_DATE_FORMAT)
    return `PARTITION \`from${today}\` VALUES LESS THAN (TO_DAYS('${tomorrow}')),`
  })
  return partitions.join('\n')
}

It is practically the same statement we saw earlier, but we have to create the names and descriptions of partitions dynamically. That's why we created the getPartitionStrings method.

The first row is:

const days = _.range(MAX_DATA_RETENTION - 2, -2, -1)  

MAX_DATA_RETENTION - 2 = 5 creates an sequence from 5 to -2 (last value exclusive) -> [ 5, 4, 3, 2, 1, 0, -1 ], then we subtract these values from the current time and create the name of the partition (today) and its' limit (tomorrow). The order is vital as MySQL throws an error if the values to partition by do not grow constantly in the statement.

Large Scale Data Removal Example with MySQL and Node.js

Now let's take a step by step look at data removal. You can see the whole code here.

The first method, removeExpired gets the list of current partitions then passes it on to repartition.

const _ = require('lodash')

Table.removeExpired = function (dataRetention) {  
  return Table.getPartitions()
    .then((currentPartitions) => Table.repartition(dataRetention, currentPartitions))
}

Table.getPartitions = function () {  
  return knex('information_schema.partitions')
    .select(knex.raw('partition_name as name'), knex.raw('partition_description as description')) // description holds the day of partition in mysql days
    .where('table_schema', dbName)
    .andWhere('partition_name', 'not in', [ 'start', 'future' ])
    .then((partitions) => partitions.map((partition) => ({
      name: partition.name,
      description: partition.description === 'MAX_VALUE' ? 'MAX_VALUE' : parseInt(partition.description)
    })))
}

Table.repartition = function (dataRetention, currentPartitions) {  
  const partitionsThatShouldExist = Table.getPartitionsThatShouldExist(dataRetention, currentPartitions)

  const partitionsToBeCreated = _.differenceWith(partitionsThatShouldExist, currentPartitions, (a, b) => a.description === b.description)
  const partitionsToBeDropped = _.differenceWith(currentPartitions, partitionsThatShouldExist, (a, b) => a.description === b.description)

  const statement = dedent
    `${Table.reorganizeFuturePartition(partitionsToBeCreated)}
    ${Table.dropOldPartitions(partitionsToBeDropped)}`

  return knex.raw(statement)
}

First, we select all currently existing partitions from the information_schema.partitions table that is maintained by MySQL.

Then we create all the partitions that should exist for the table. If A is the set of partitions that exist and B is set of partitions that should exist then

partitionsToBeCreated = B \ A

partitionsToBeDropped = A \ B.

getPartitionsThatShouldExist creates set B.

Table.getPartitionsThatShouldExist = function (dataRetention, currentPartitions) {  
  const days = _.range(dataRetention - 2, -2, -1)
  const oldestPartition = Math.min(...currentPartitions.map((partition) => partition.description))
  return days.map((day) => {
    const tomorrow = moment().subtract(day, 'day')
    const today = moment().subtract(day + 1, 'day')
    if (Table.getMysqlDay(today) < oldestPartition) {
      return null
    }

    return {
      name: `from${today.format(PARTITION_NAME_DATE_FORMAT)}`,
      description: Table.getMysqlDay(tomorrow)
    }
  }).filter((partition) => !!partition)
}

Table.getMysqlDay = function (momentDate) {  
  return momentDate.diff(moment([ 0, 0, 1 ]), 'days') // mysql dates are counted since 0 Jan 1 00:00:00
}

The creation of partition objects is quite similar to the creation of the CREATE TABLE ... PARTITION BY RANGE statement. It is also vital to check if the partition we are about to create is older than the current oldest partition: it is possible that we need to change the dataRetention over time.

Take this scenario for example:

Imagine that your users start out with 7 days of data retention, but have an option to upgrade it to 10 days. In the beginning the user has partitions that cover days in the following order: [ start, -7, -6, -5, -4, -3, -2, -1, future ]. After a month or so, a user decides to upgrade. The missing partitions are in this case: [ -10, -9, -8, 0 ].

At cleanup, the current script would try to reorganize the future partition for the missing partitions appending them after the current ones.

Creating partitions for days older than -7 does not make sense in the first place because that data was meant to be thrown away so far anyways, and it would also lead to a partition list that looks like [ start, -7, -6, -5, -4, -3, -2, -1, -10, -9, -8, 0, future ] which isn't monotonously increasing, thus MySQL will throw an error, and the cleanup will fail.

MySQL's TO_DAYS(date) function calculates the number of days passed since year 0 January 1, so we replicate this in JavaScript.

Table.getMysqlDay = function (momentDate) {  
  return momentDate.diff(moment([ 0, 0, 1 ]), 'days')
}

Now that we have the partitions that have to be dropped, and the partitions that have to be created, let's create our new partition first for the new day.

Table.reorganizeFuturePartition = function (partitionsToBeCreated) {  
  if (!partitionsToBeCreated.length) return '' // there should be only one every day, and it is run hourly, so ideally 23 times a day it should be a noop
  const partitionsString = partitionsToBeCreated.map((partitionDescriptor) => {
    return `PARTITION \`${partitionDescriptor.name}\` VALUES LESS THAN (${partitionDescriptor.description}),`
  }).join('\n')

  return dedent`
    ALTER TABLE \`${tableName}\`
      REORGANIZE PARTITION future INTO (
        ${partitionsString}
        PARTITION \`future\` VALUES LESS THAN MAXVALUE
      );`
}

We simply prepare a statement for the new partition(s) to be created.

We run this script hourly just to make sure nothing goes astray and we are able to perform the cleanup properly at least once a day.

So the first thing to check is if there's a partition to be created at all. This should happen only at the first run, then be a noop 23 times a day.

We also have to drop the outdated partitions.

Table.dropOldPartitions = function (partitionsToBeDropped) {  
  if (!partitionsToBeDropped.length) return ''
  let statement = `ALTER TABLE \`${tableName}\`\nDROP PARTITION\n`
  statement += partitionsToBeDropped.map((partition) => {
    return partition.name
  }).join(',\n')
  return statement + ';'
}

This method creates the same ALTER TABLE ... DROP PARTITION statement we saw earlier.

And finally, everything is ready for the reorganization.

  const statement = dedent
    `${Table.reorganizeFuturePartition(partitionsToBeCreated)}
    ${Table.dropOldPartitions(partitionsToBeDropped)}`

  return knex.raw(statement)

Wrapping it up

As you can see, contrary to popular belief, ACID compliant DBMS solutions such as MySQL can be used when you are handling large amounts of data, so you don't necessarily need to give up the features of transactional databases.

However, table partitioning comes with quite a few restrictions, meaning you are cut off from using all the power InnoDB provides for keeping your data consistent. You might also have to handle in the app logic what otherwise would be available such as foreign key constraints or full-text searches.

I hope this post helps you decide whether MySQL is a good fit for your needs and helps you implement your solution. Until next time: Happy engineering!

If you have any Node + MySQL questions, let me know in the comments below!

19 Sep 12:15

Mastering Async Await in Node.js

by Tamas Kadlecsik
Mastering Async Await in Node.js

In this article, you will learn how you can simplify your callback or Promise based Node.js application with async functions (async/await).

Asynchronous language constructs have been around in other languages for a while, like async/await in C#, coroutines in Kotlin and goroutines in Go. With the release of Node.js 8, the long awaited async functions have landed in Node.js as well.

By the end of this tutorial, you should be able to answer the following question too:

What are async functions in Node?

Async function declarations return an AsyncFunction object. These are similar to Generator-s in the sense that their execution can be halted. The only difference is that they always return a Promise instead of a { value: any, done: Boolean } object. In fact, they are so similar that you could gain similar functionality using the co package.

In an async function, you can await for any Promise or catch its rejection cause.

So if you had some logic implemented with promises:

function handler (req, res) {  
  return request('https://user-handler-service')
    .catch((err) => {
      logger.error('Http error', err)
      error.logged = true
      throw err
    })
    .then((response) => Mongo.findOne({ user: response.body.user }))
    .catch((err) => {
      !error.logged && logger.error('Mongo error', err)
      error.logged = true
      throw err
    })
    .then((document) => executeLogic(req, res, document))
    .catch((err) => {
      !error.logged && console.error(err)
      res.status(500).send()
    })
}

You can make it look like synchronous code using async/await:

async function handler (req, res) {  
  let response
  try {
    response = await request('https://user-handler-service')  
  } catch (err) {
    logger.error('Http error', err)
    return res.status(500).send()
  }

  let document
  try {
    document = await Mongo.findOne({ user: response.body.user })
  } catch (err) {
    logger.error('Mongo error', err)
    return res.status(500).send()
  }

  executeLogic(document, req, res)
}

In older versions of V8, unhandled promise rejections were silently dropped. Now at least you get a warning from Node, so you don’t necessarily need to bother with creating a listener. However, it is recommended to crash your app in this case as when you don’t handle an error, your app is in an unknown state:

process.on('unhandledRejection', (err) => {  
  console.error(err)
  process.exit(1)
})

Patterns with async functions

There are quite a couple of use cases when the ability to handle asynchronous operations as if they were synchronous comes very handy, as solving them with Promises or callbacks requires the use of complex patterns or external libraries.

These are cases when you need to loop through asynchronously gained data or use if-else conditionals.

Retry with exponential backoff

Implementing retry logic was pretty clumsy with Promises:

function requestWithRetry (url, retryCount) {  
  if (retryCount) {
    return new Promise((resolve, reject) => {
      const timeout = Math.pow(2, retryCount)

      setTimeout(() => {
        console.log('Waiting', timeout, 'ms')
        _requestWithRetry(url, retryCount)
          .then(resolve)
          .catch(reject)
      }, timeout)
    })
  } else {
    return _requestWithRetry(url, 0)
  }
}

function _requestWithRetry (url, retryCount) {  
  return request(url, retryCount)
    .catch((err) => {
      if (err.statusCode && err.statusCode >= 500) {
        console.log('Retrying', err.message, retryCount)
        return requestWithRetry(url, ++retryCount)
      }
      throw err
    })
}

requestWithRetry('http://localhost:3000')  
  .then((res) => {
    console.log(res)
  })
  .catch(err => {
    console.error(err)
  })

It gave me a headache just to look at it. We can rewrite it with async/await and make it a lot more simple.

function wait (timeout) {  
  return new Promise((resolve) => {
    setTimeout(() => {
      resolve()
    }, timeout)
  })
}

async function requestWithRetry (url) {  
  const MAX_RETRIES = 10
  for (let i = 0; i <= MAX_RETRIES; i++) {
    try {
      return await request(url)
    } catch (err) {
      const timeout = Math.pow(2, i)
      console.log('Waiting', timeout, 'ms')
      await wait(timeout)
      console.log('Retrying', err.message, i)
    }
  }
}

A lot more pleasing to the eye isn't it?

Intermediate values

Not as hideous as the previous example, but if you have a case where 3 asynchronous functions depend on each other the following way, then you have to choose from several ugly solutions.

functionA returns a Promise, then functionB needs that value and functionC needs the resolved value of both functionA's and functionB's Promise.

Solution 1: The .then Christmas tree
function executeAsyncTask () {  
  return functionA()
    .then((valueA) => {
      return functionB(valueA)
        .then((valueB) => {          
          return functionC(valueA, valueB)
        })
    })
}

With this solution, we get valueA from the surrounding closure of the 3rd then and valueB as the value the previous Promise resolves to. We cannot flatten out the Christmas tree as we would lose the closure and valueA would be unavailable for functionC.


Need help with enterprise-grade Node.js Development?
Hire the experts of RisingStack!


Solution 2: Moving to a higher scope
function executeAsyncTask () {  
  let valueA
  return functionA()
    .then((v) => {
      valueA = v
      return functionB(valueA)
    })
    .then((valueB) => {
      return functionC(valueA, valueB)
    })
}

In the Christmas tree, we used a higher scope to make valueA available as well. This case works similarly, but now we created the variable valueA outside the scope of the .then-s, so we can assign the value of the first resolved Promise to it.

This one definitely works, flattens the .then chain and is semantically correct. However, it also opens up ways for new bugs in case the variable name valueA is used elsewhere in the function. We also need to use two names — valueA and v — for the same value.

Solution 3: The unnecessary array
function executeAsyncTask () {  
  return functionA()
    .then(valueA => {
      return Promise.all([valueA, functionB(valueA)])
    })
    .then(([valueA, valueB]) => {
      return functionC(valueA, valueB)
    })
}

There is no other reason for valueA to be passed on in an array together with the Promise functionB then to be able to flatten the tree. They might be of completely different types, so there is a high probability of them not belonging to an array at all.

Solution 4: Write a helper function
const converge = (...promises) => (...args) => {  
  let [head, ...tail] = promises
  if (tail.length) {
    return head(...args)
      .then((value) => converge(...tail)(...args.concat([value])))
  } else {
    return head(...args)
  }
}

functionA(2)  
  .then((valueA) => converge(functionB, functionC)(valueA))

You can, of course, write a helper function to hide away the context juggling, but it is quite difficult to read, and may not be straightforward to understand for those who are not well versed in functional magic.

By using async/await our problems are magically gone:
async function executeAsyncTask () {  
  const valueA = await functionA()
  const valueB = await functionB(valueA)
  return function3(valueA, valueB)
}

Multiple parallel requests with async/await

This is similar to the previous one. In case you want to execute several asynchronous tasks at once and then use their values at different places, you can do it easily with async/await:

async function executeParallelAsyncTasks () {  
  const [ valueA, valueB, valueC ] = await Promise.all([ functionA(), functionB(), functionC() ])
  doSomethingWith(valueA)
  doSomethingElseWith(valueB)
  doAnotherThingWith(valueC)
}

As we've seen in the previous example, we would either need to move these values into a higher scope or create a non-semantic array to pass these value on.

Array iteration methods

You can use map, filter and reduce with async functions, although they behave pretty unintuitively. Try guessing what the following scripts will print to the console:

  1. map
function asyncThing (value) {  
  return new Promise((resolve, reject) => {
    setTimeout(() => resolve(value), 100)
  })
}

async function main () {  
  return [1,2,3,4].map(async (value) => {
    const v = await asyncThing(value)
    return v * 2
  })
}

main()  
  .then(v => console.log(v))
  .catch(err => console.error(err))
  1. filter
function asyncThing (value) {  
  return new Promise((resolve, reject) => {
    setTimeout(() => resolve(value), 100)
  })
}

async function main () {  
  return [1,2,3,4].filter(async (value) => {
    const v = await asyncThing(value)
    return v % 2 === 0
  })
}

main()  
  .then(v => console.log(v))
  .catch(err => console.error(err))
  1. reduce
function asyncThing (value) {  
  return new Promise((resolve, reject) => {
    setTimeout(() => resolve(value), 100)
  })
}

async function main () {  
  return [1,2,3,4].reduce(async (acc, value) => {
    return await acc + await asyncThing(value)
  }, Promise.resolve(0))
}

main()  
  .then(v => console.log(v))
  .catch(err => console.error(err))

Solutions:

  1. [ Promise { <pending> }, Promise { <pending> }, Promise { <pending> }, Promise { <pending> } ]
  2. [ 1, 2, 3, 4 ]
  3. 10

If you log the returned values of the iteratee with map you will see the array we expect: [ 2, 4, 6, 8 ]. The only problem is that each value is wrapped in a Promise by the AsyncFunction.

So if you want to get your values, you'll need to unwrap them by passing the returned array to a Promise.all:

main()  
  .then(v => Promise.all(v))
  .then(v => console.log(v))
  .catch(err => console.error(err))

Originally, you would first wait for all your promises to resolve and then map over the values:

function main () {  
  return Promise.all([1,2,3,4].map((value) => asyncThing(value)))
}

main()  
  .then(values => values.map((value) => value * 2))
  .then(v => console.log(v))
  .catch(err => console.error(err))

This seems a bit more simple isn't it?

The async/await version can still be useful if you have some long running synchronous logic in your iteratee and another long-running async task.

This way you can start calculating as soon as you have the first value - you don't have to wait for all the Promises to be resolved to run your computations. Even though the results will still be wrapped in Promises, those are resolved a lot faster then if you did it the sequential way.

What about filter? Something is clearly wrong...

Well, you guessed it: even though the returned values are [ false, true, false, true ], they will be wrapped in promises, which are truthy, so you'll get back all the values from the original array. Unfortunately, all you can do to fix this is to resolve all the values and then filter them.

Reducing is pretty straightforward. Bear in mind though that you need to wrap the initial value into Promise.resolve, as the returned accumulator will be wrapped as well and has to be await-ed.

.. As it is pretty clearly intended to be used for imperative code styles.

To make your .then chains more "pure" looking, you can use Ramda's pipeP and composeP functions.


Need help with enterprise-grade Node.js Development?
Hire the experts of RisingStack!


Rewriting callback-based Node.js applications

Async functions return a Promise by default, so you can rewrite any callback based function to use Promises, then await their resolution. You can use the util.promisify function in Node.js to turn callback-based functions to return a Promise-based ones.

Rewriting Promise-based applications

Simple .then chains can be upgraded in a pretty straightforward way, so you can move to using async/await right away.

function asyncTask () {  
  return functionA()
    .then((valueA) => functionB(valueA))
    .then((valueB) => functionC(valueB))
    .then((valueC) => functionD(valueC))
    .catch((err) => logger.error(err))
}

will turn into

async function asyncTask () {  
  try {
    const valueA = await functionA()
    const valueB = await functionB(valueA)
    const valueC = await functionC(valueB)
    return await functionD(valueC)
  } catch (err) {
    logger.error(err)
  }
}

Rewriting Node.js apps with async/await

  • If you liked the good old concepts of if-else conditionals and for/while loops,
  • if you believe that a try-catch block is the way errors are meant to be handled,

you will have a great time rewriting your services using async/await.

As we have seen, it can make several patterns a lot more easier to code and read, so it is definitely more suitable in several cases than Promise.then() chains. However, if you are caught up in the functional programming craze of the past years, you might wanna pass on this language feature.

So what do you guys think? Is async/await is the next best thing since the invention of sliced bread, or is it just as controversial as the addition of class was in es2015?

Are you already using async/await it in production, or you plan on never touching it? Let's discuss it in the comments below.

19 Sep 12:15

Node.js Performance Monitoring with Prometheus

by Péter Márton
Node.js Performance Monitoring with Prometheus

This article helps you to understand what to monitor if you have a Node.js application in production, and how to use Prometheus - an open-source solution, which provides powerful data compressions and fast data querying for time series data - for Node.js monitoring.

What is Node.js Monitoring?

The term "service monitoring", means tasks of collecting, processing, aggregating, and displaying real-time quantitative data about a system.

Monitoring gives us the ability to observe our system's state and address issues before they impact our business. Monitoring can also help to optimize our users' experience.

To analyze the data, first, you need to extract metrics from your system - like the Memory usage of a particular application instance. We call this extraction instrumentation.

We use the term white box monitoring when metrics are provided by the running system itself. This is the kind of Node.js monitoring we'll be diving into.

The four signals to know

Every service is different, and you can monitor many aspects of them. Metrics can range from low-level resources like Memory usage to high-level business metrics like the number of signups.

We recommend you to watch these signals for all of your services:

  • Error Rate: Because errors are user facing and immediately affect your customers.
  • Response time: Because the latency directly affects your customers and business.
  • Throughput: The traffic helps you to understand the context of increased error rates and the latency too.
  • Saturation: It tells how "full" your service is. If the CPU usage is 90%, can your system handle more traffic?

Instrumentation

You can instrument your system manually, but most of the paid monitoring solutions provide out of the box instrumentations.

In many cases, instrumentation means adding extra logic and code pieces that come with a performance overhead.

With Node.js monitoring and instrumentation, you should aim to achieve low overhead, but it doesn’t necessarily mean that a bigger performance impact is not justifiable for better system visibility.

The risk of instrumenting your code

Instrumentations can be very specific and usually need expertise and more development time. Also, a bad instrumentation can introduce bugs into your system or generate an unreasonable performance overhead.

Instrumenting your code can also produce a lot's of extra lines and bloat your applications codebase.

Node.js Performance Monitoring with Prometheus

Picking your Node.js Monitoring Tool

When your team picks a monitoring tool you should consider the following aspects:

  • Expertise: Do you have the expertise? Building a monitoring tool and writing a high-quality instrumentation and extracting the right metrics is not easy. You need to know what you are doing.

  • Build or buy: Building a proper monitoring solution needs lot's of expertise, time and money while obtaining an existing solution can be easier and cheaper.

  • SaaS or on-premises: Do you want to host your monitoring solution? Can you use a SaaS solution, what's your data compliance and protection policy? Using a SaaS solution can be a good pick for example when you want to focus on your product instead of tooling. Both open-source and commercial solutions are usually available as hosted or on-premises setup.

  • Licensing: Do you want to ship your monitoring toolset with your product? Can you use a commercial solution? You should always check licensing.

  • Integrations: Does it support my external dependencies like databases, orchestration system and npm libraries?

  • Instrumentation: Does it provide automatic instrumentation? Do I need to instrument my code manually? How much time would it take to do it on my own?

  • Microservices: Do you build a monolith or a distributed system? Microservices needs specific tools and philosophy to debug and monitor them effectively. Do you need to distribute tracing or security checks?

Based on our experience, in most of the cases an out of the box SaaS or on-premises monitoring solution like Trace gives the right amount of visibility and toolset to monitor and debug your Node.js applications.

But what can you do when you cannot choose a commercial solution for some reason, and you want to build your own monitoring suite?

This is the case when Prometheus comes into the picture!

Node Monitoring with Prometheus

Prometheus is an open-source solution for Node.js monitoring and alerting. It provides powerful data compressions and fast data querying for time series data.

Time series is a stream of immutable timestamped values that belong to the same metric and the same labels. The labels cause the metrics to be multi-dimensional.

You can read more about how Prometheus optimizes its storage engine in the Writing a Time Series Database from Scratch article.

FunFact: Prometheus was initially built at SoundCloud, in 2016 it joined the Cloud Native Computing Foundation as the second hosted project after Kubernetes.

Data collection and metrics types

Prometheus uses the HTTP pull model, which means that every application needs to expose a GET /metrics endpoint that can be periodically fetched by the Prometheus instance.

Prometheus has four metrics types:

  • Counter: cumulative metric that represents a single numerical value that only ever goes up
  • Gauge: represents a single numerical value that can arbitrarily go up and down
  • Histogram: samples observations and counts them in configurable buckets
  • Summary: similar to a histogram, samples observations, it calculates configurable quantiles over a sliding time window

In the following snippet, you can see an example response for the /metrics endpoint. It contains both the counter (nodejs_heap_space_size_total_bytes) and histogram (http_request_duration_ms_bucket) types of metrics:

# HELP nodejs_heap_space_size_total_bytes Process heap space size total from node.js in bytes.
# TYPE nodejs_heap_space_size_total_bytes gauge
nodejs_heap_space_size_total_bytes{space="new"} 1048576 1497945862862  
nodejs_heap_space_size_total_bytes{space="old"} 9818112 1497945862862  
nodejs_heap_space_size_total_bytes{space="code"} 3784704 1497945862862  
nodejs_heap_space_size_total_bytes{space="map"} 1069056 1497945862862  
nodejs_heap_space_size_total_bytes{space="large_object"} 0 1497945862862

# HELP http_request_duration_ms Duration of HTTP requests in ms
# TYPE http_request_duration_ms histogram
http_request_duration_ms_bucket{le="10",code="200",route="/",method="GET"} 58  
http_request_duration_ms_bucket{le="100",code="200",route="/",method="GET"} 1476  
http_request_duration_ms_bucket{le="250",code="200",route="/",method="GET"} 3001  
http_request_duration_ms_bucket{le="500",code="200",route="/",method="GET"} 3001  
http_request_duration_ms_bucket{le="+Inf",code="200",route="/",method="GET"} 3001  

Prometheus offers an alternative, called the Pushgateway to monitor components that cannot be scrapped because they live behind a firewall or are short-lived jobs.

Before a job gets terminated, it can push metrics to this gateway, and Prometheus can scrape the metrics from this gateway later on.

To set up Prometheus to periodically collect metrics from your application check out the following example configuration.

Monitoring a Node.js application

When we want to monitor our Node.js application with Prometheus, we need to solve the following challenges:

  • Instrumentation: Safely instrumenting our code with minimal performance overhead
  • Metrics exposition: Exposing our metrics for Prometheus with an HTTP endpoint
  • Hosting Prometheus: Having a well configured Prometheus running
  • Extracting value: Writing queries that are statistically correct
  • Visualizing: Building dashboards and visualizing our queries
  • Alerting: Setting up efficient alerts
  • Paging: Get notified about alerts with applying escalation policies for paging

Node.js Performance Monitoring with Prometheus

Node.js Metrics Exporter

To collect metrics from our Node.js application and expose it to Prometheus we can use the prom-client npm library.

In the following example, we create a histogram type of metrics to collect our APIs' response time per routes. Take a look at the pre-defined bucket sizes and our route label:

// Init
const Prometheus = require('prom-client')  
const httpRequestDurationMicroseconds = new Prometheus.Histogram({  
  name: 'http_request_duration_ms',
  help: 'Duration of HTTP requests in ms',
  labelNames: ['route'],
  // buckets for response time from 0.1ms to 500ms
  buckets: [0.10, 5, 15, 50, 100, 200, 300, 400, 500]
})

We need to collect the response time after each request and report it with the route label.

// After each response
httpRequestDurationMicroseconds  
  .labels(req.route.path)
  .observe(responseTimeInMs)

We can register a route a GET /metrics endpoint to expose our metrics in the right format for Prometheus .

// Metrics endpoint
app.get('/metrics', (req, res) => {  
  res.set('Content-Type', Prometheus.register.contentType)
  res.end(Prometheus.register.metrics())
})

Queries

After we collected our metrics, we want to extract some value from them to visualize.

Prometheus provides a functional expression language that lets the user select and aggregate time series data in real time.

The Prometheus dashboard has a built-in query and visualization tool:

Node.js Performance Monitoring with Prometheus Prometheus dashboard

Let's see some example queries for response time and memory usage.

Query: 95th Response Time

We can determinate the 95th percentile of our response time from our histogram metrics. With the 95th percentile response time, we can filter out peaks, and it usually gives a better understanding of the average user experience.

histogram_quantile(0.95, sum(rate(http_request_duration_ms_bucket[1m])) by (le, service, route, method))  

Query: Average Response Time

As histogram type in Prometheus also collects the count and sum values for the observed metrics, we can divide them to get the average response time for our application.

avg(rate(http_request_duration_ms_sum[1m]) / rate(http_request_duration_ms_count[1m])) by (service, route, method, code)  

For more advanced queries like Error rate and Apdex score check out our Prometheus with Node.js example repository.

Alerting

Prometheus comes with a built-in alerting feature where you can use your queries to define your expectations, however, Prometheus alerting doesn't come with a notification system. To set up one, you need to use the Alert manager or an other external process.

Let's see an example of how you can set up an alert for your applications' median response time. In this case, we want to fire an alert when the median response time goes above 100ms.

# APIHighMedianResponseTime
ALERT APIHighMedianResponseTime  
  IF histogram_quantile(0.5, sum(rate(http_request_duration_ms_bucket[1m])) by (le, service, route, method)) > 100
  FOR 60s
  ANNOTATIONS {
    summary = "High median response time on {{ $labels.service }} and {{ $labels.method }} {{ $labels.route }}",
    description = "{{ $labels.service }}, {{ $labels.method }} {{ $labels.route }} has a median response time above 100ms (current value: {{ $value }}ms)",
  }

Node.js Performance Monitoring with Prometheus Prometheus active alert in pending state

Kubernetes integration

Prometheus offers a built-in Kubernetes integration. It's capable of discovering Kubernetes resources like Nodes, Services, and Pods while scraping metrics from them.

It's an extremely powerful feature in a containerized system, where instances born and die all the time. With a use-case like this, HTTP endpoint based scraping would be hard to achieve through manual configuration.

You can also provision Prometheus easily with Kubernetes and Helm. It only needs a couple of steps. First of all, we need a running Kubernetes cluster!

As Azure Container Service provides a hosted Kubernetes, I can provision one quickly:

# Provision a new Kubernetes cluster
az acs create -n myClusterName -d myDNSPrefix -g myResourceGroup --generate-ssh-keys --orchestrator-type kubernetes

# Configure kubectl with the new cluster
az acs kubernetes get-credentials --resource-group=myResourceGroup --name=myClusterName  

After a couple of minutes when our Kubernetes cluster is ready, we can initialize Helm and install Prometheus:

helm init  
helm install stable/prometheus  

For more information on provisioning Prometheus with Kubernetes check out the Prometheus Helm chart.

Grafana

As you can see, the built-in visualization method of Prometheus is great to inspect our queries output, but it's not configurable enough to use it for dashboards.

As Prometheus has an API to run queries and get data, you can use many external solutions to build dashboards. One of my favorite is Grafana.

Grafana is an open-source, pluggable visualization platform. It can process metrics from many types of systems, and it has built-in Prometheus data source support.

In Grafana, you can import an existing dashboard or build you own.

Node.js Performance Monitoring with Prometheus Dashboard with Grafana - click for high-res

Conclusion

Prometheus is a powerful open-source tool to monitor your application, but as you can see, it doesn't work out of the box.

With Prometheus, you need expertise to instrument your application, observe your data, then query and visualize your metrics.

In case you're looking for a simple but powerful out of the box tool to debug and monitor your Node.js application, check out our solution called Trace.


You can find our example repository below, which can help you with more in-depth advice in case you'll choose this way of monitoring your Node.js application.

Example repository: RisingStack/example-prometheus-nodejs

19 Sep 12:14

Building a Node.js App with TypeScript Tutorial

by Gergely Nemeth
Building a Node.js App with TypeScript Tutorial

This tutorial teaches how you can build, structure, test and debug a Node.js application written in TypeScript. To do so, we use an example project which you can access anytime later.


Managing large-scale JavaScript projects can be challenging, as you need to guarantee that the pieces fit together. You can use unit tests, types (which JavaScript does not really have), or the two in combination to solve this issue.

This is where TypeScript comes into the picture. TypeScript is a typed superset of JavaScript that compiles to plain JavaScript.

In this article you will learn:

  • what TypeScript is,
  • what are the benefits of using Typescript,
  • how you can set up a project to start developing using it:
    • how to add linters,
    • how to write tests,
    • how to debug applications written in TypeScript

This article won't go into to details of using the TypeScript language itself, it focuses on how you can build Node.js applications using it. If you are looking for an in-depth TypeScript tutorial, I recommend checking out the TypeScript Gitbook.

The benefits of using TypeScript

As we already discussed, TypeScript is a superset of Javascript. It gives you the following benefits:

  • optional static typing, with emphasis on optional (it makes porting JavaScript application to TypeScript easy),
  • as a developer, you can start using ECMAScript features that are not supported by the current V8 engine by using build targets,
  • use of interfaces,
  • great tooling with instruments like IntelliSense.

Getting started with TypeScript & Node

TypeScript is a static type checker for JavaScript. This means that it will check for issues in your codebase using the information available on different types. Example: a String will have a toLowerCase() method, but not a parseInt() method. Of course, the type system of TypeScript can be extended with your own type definitions.

As TypeScript is a superset of JavaScript, you can start using it by literally just renaming your .js files to .ts, so you can introduce TypeScript gradually to your teams.

Note: TypeScript won't do anything in runtime, it works only during compilation time. You will run pure JavaScript files.


To get started with TypeScript, grab it from npm:

$ npm install -g typescript

Let's write our first TypeScript file! It will simply greet the person it gets as a parameter:

// greeter.ts
function greeter(person: string) {  
  return `Hello ${person}!`
}

const name = 'Node Hero'

console.log(greeter(name))  

One thing you could already notice is the string type annotation which tells the TypeScript compiler that the greeter function is expecting a string as its parameter.

Let's try to compile it!

tsc greeter.ts  

First, let's take a look at the compiled output! Ss you can see, there was no major change, only that the type annotations were removed:

function greeter(person) {  
    return "Hello " + person + "!";
}
var userName = 'Node Hero';  
console.log(greeter(userName));  

What would happen if you'd change the userName to a Number? As you could guess, you will get a compilation error:

greeter.ts(10,21): error TS2345: Argument of type '3' is not assignable to parameter of type 'string'.  

Tutorial: Building a Node.js app with TypeScript

1. Set up your development environment

To build applications using TypeScript, make sure you have Node.js installed on your system. This article will use Node.js 8.

We recommend installing Node.js using nvm, the Node.js version manager. With this utility application, you can have multiple Node.js versions installed on your system, and switching between them is only a command away.

# install nvm
curl -o- https://raw.githubusercontent.com/creationix/nvm/v0.33.2/install.sh | bash

# install node 8
nvm install 8

# to make node 8 the default
nvm alias default 8  

Once you have Node.js 8 installed, you should create a directory where your project will live. After that, create your package.json file using:

npm init  

2. Create the project structure

When using TypeScript, it is recommended to put all your files under an src folder.

At the end of this tutorial, we will end up with the following project structure:

Building a Node.js App with TypeScript Tutorial

Let's start by adding the App.ts file - this will be the file where your web server logic will be implemented, using express.

In this file, we are creating a class called App, which will encapsulate our web server. It has a private method called mountRoutes, which mounts the routes served by the server. The express instance is reachable through the public express property.

import * as express from 'express'

class App {  
  public express

  constructor () {
    this.express = express()
    this.mountRoutes()
  }

  private mountRoutes (): void {
    const router = express.Router()
    router.get('/', (req, res) => {
      res.json({
        message: 'Hello World!'
      })
    })
    this.express.use('/', router)
  }
}

export default new App().express  

We are also creating an index.ts file, so the web server can be fired up:

import app from './App'

const port = process.env.PORT || 3000

app.listen(port, (err) => {  
  if (err) {
    return console.log(err)
  }

  return console.log(`server is listening on ${port}`)
})

With this - at least in theory - we have a functioning server. To actually make it work, we have to compile our TypeScript code to JavaScript.

For more information on how to structure your project, read our Node.js project structuring article.

3. Configuring TypeScript

You can pass options to the TypeScript compiler by either by using the CLI, or a special file called tsconfig.json. As we would like to use the same settings for different tasks, we will go with the tsconfig.json file.

By using this configuration file, we are telling TypeScript things like the build target (can be ES5, ES6, and ES7 at the time of this writing), what module system to expect, where to put the build JavaScript files, or whether it should create source-maps as well.

{
  "compilerOptions": {
    "target": "es6",
    "module": "commonjs",
    "outDir": "dist",
    "sourceMap": true
  },
  "files": [
    "./node_modules/@types/mocha/index.d.ts",
    "./node_modules/@types/node/index.d.ts"
  ],
  "include": [
    "src/**/*.ts"
  ],
  "exclude": [
    "node_modules"
  ]
}

Once you added this TypeScript configuration file, you can build your application using the tsc command.

If you do not want to install TypeScript globally, just add it to the dependency of your project, and create an npm script for it: "tsc": "tsc".

This will work, as npm scripts will look for the binary in the ./node_modules/.bin folder, and add it to the PATH when running scripts. Then you can access tsc using npm run tsc. Then, you can pass options to tsc using this syntax: npm run tsc -- --all (this will list all the available options for TypeScript).


Need help with enterprise-grade Node.js Development?
Hire the experts of RisingStack!


4. Add ESLint

As with most projects, you want to have linters to check for style issues in your code. TypeScript is no exception.

To use ESLint with TypeScript, you have to add an extra package, a parser, so ESLint can understand Typescript as well: typescript-eslint-parser. Once you installed it, you have to set it as the parser for ESLint:

# .eslintrc.yaml
---
  extends: airbnb-base
  env:
    node: true
    mocha: true
    es6: true
  parser: typescript-eslint-parser
  parserOptions:
    sourceType: module
    ecmaFeatures: 
      modules: true

Once you run eslint src --ext ts, you will get the same errors and warnings for your TypeScript files that you are used to:

Building a Node.js App with TypeScript Tutorial

5. Testing your application

Testing your TypeScript-based applications is essentially the same as you would do it with any other Node.js applications.

The only gotcha is that you have to compile your application before actually running the tests on them. Achieving it is very straightforward, you can simply do it with: tsc && mocha dist/**/*.spec.js.

For more on testing, check out our Node.js testing tutorial.

6. Build a Docker image

Once you have your application ready, most probably you want to deploy it as a Docker image. The only extra steps you need to take are:

  • build the application (compile from TypeScript to JavaScript),
  • start the Node.js application from the built source.
FROM risingstack/alpine:3.4-v6.9.4-4.2.0

ENV PORT 3001

EXPOSE 3001

COPY package.json package.json  
RUN npm install

COPY . .  
RUN npm run build

CMD ["node", "dist/"]  

7. Debug using source-maps

As we enabled generating source-maps, we can use them to find bugs in our application. To start looking for issues, start your Node.js process the following way:

node --inspect dist/  

This will output something like the following:

To start debugging, open the following URL in Chrome:  
    chrome-devtools://devtools/remote/serve_file/@60cd6e859b9f557d2312f5bf532f6aec5f284980/inspector.html?experiments=true&v8only=true&ws=127.0.0.1:9229/23cd0c34-3281-49d9-81c8-8bc3e0bc353a
server is listening on 3000  

To actually start the debugging process, open up your Google Chrome browser and browse to chrome://inspect. A remote target should already be there, just click inspect. This will bring up the Chrome DevTools.

Here, you will instantly see the original source, and you can start putting breakpoints, watchers on the TypeScript source code.

Building a Node.js App with TypeScript Tutorial

The source-map support only works with Node.js 8 and higher.

The Complete Node.js TypeScript Tutorial

You can find the complete Node.js TypeScript starter application on GitHub.

Let us know in the issues, or here in the comments what would you change!

11 Sep 07:17

小韩老师课程更新

by XChinux@163.com (小韩老师)
小韩老师的课程更新了快来围观吧,经过几天的紧张制作完成了两节视频的制作,现在放到哔哩哔哩上了,直接复制网页,通过浏览器网址打开。
第二节
https://www.bilibili.com/video/av14345833/
第三节
https://www.bilibili.com/video/av14347006/

对于之前有同学说的,视频和声音不同步的问题还是存在,主要是在Qt大量占用电脑资源的时候会出现不同步的情况,这个问题暂时不好解决,我就看视频的你抱歉一下!
05 May 03:59

[来自异次元] 5KPlayer 免费全能视频播放器 - 跨平台支持 AirPlay 无线串流 / 下载在线视频

by X-Force

AirPlay苹果推出的一个非常实用的「跨屏播放视频与音乐」的功能,它可以将 iPhone 手机或 iPad 上的音乐、视频通过 WiFi 无线串流投射到电视等更大的屏幕上播放。

不过首先你得花钱买一台 AppleTV 才能享受这个功能。异次元之前推荐过的 KodiApowersoft 苹果录屏王 都能通过软件实现 AirPlay,而今天我们又发现了一款更加好用的软件——5KPlayer!而它,还是一款跨平台支持 Win 和 Mac 的免费万能视频播放器以及在线视频下载器……

[ 马上前往围观.... ]


异次元还有这些值得一看:

异次元正版数字商城  |  异次元首页  |  iPc.me  |  新浪微博  |  软件精选

15 Jan 11:08

QT写的串口上位机程序

by XChinux@163.com (harold00124)
小弟自学2个月
经过无数苦斗写的上位机程序

功能有
控制修改与监控PLC面板内的值

程序开启后自动发送确认码并测试所有可用Port口直到PLC相应的port口回传确认值后才做对接


代码都是提供思路而已 不是完整的...
硬体失联后重接可自动接回port口
  1. void MainWindow::TimeDeary()//定時器
  2. {
  3.     int Index=ui->tabWidget->currentIndex();
  4.     //偵測連接Port並自動接上
  5.     //判別旗標 接收到回傳資料後更改旗標跳出該判斷
  6. if(!SerialPort_Link_Flag){
  7.     if(LinkPoint>SerialPort_Name_Point) {
  8.         LinkPoint=0;
  9.         ui->Show_ComPort_label->setText("無可用連結 重新建立連線中");
  10.         ui->Show_Decoding_label->setText("");
  11.         SerialPort_Name_Point=0;
  12.         foreach (const QSerialPortInfo &info, QSerialPortInfo::availablePorts())
  13.             {
  14.                 //獲得當前可用的所有Port並放入緩存內
  15.                 SerialPort_Name[SerialPort_Name_Point]=info.portName();
  16.                 //每獲得一個Port就讓旗標+1
  17.                 SerialPort_Name_Point++;
  18.             }
  19.     }
  20.     Txserialport->setPortName(SerialPort_Name[LinkPoint]);
  21.     Txserialport->open(QIODevice::ReadWrite);
  22.     WidthRead(DSP_Status);
  23.     SerialPort_Link_Delay->start(1);//計時報錯
  24. }
  25.     //連接成功後執行下列呼叫回應
  26. else{
  27.     if(Index<4){
  28.         if(TX_Begin_Flag==1){
  29.         TX_Begin_Flag = 0;
  30.         WidthRead(Dsp[DspPoint]);
  31.         }
  32.         else ErrTime->start(1);
  33.     }
  34.     if(Index>3 && Index<8){
  35.         if(TX_Begin_Flag==1){
  36.         TX_Begin_Flag = 0;
  37.         WidthRead(Dsp[DspPoint]);
  38.         }
  39.         else ErrTime->start(1);
  40.     }
  41.     if(Index==8){
  42.      if(TX_Begin_Flag==1){
  43.         TX_Begin_Flag = 0;
  44.         WidthRead(Dsp[DspPoint]);
  45.      }
  46.        else ErrTime->start(1);
  47.    }
  48. }
  49. }
  50. void MainWindow::ErrTimeDelay()
  51. {
  52.     if(Txserialport->readAll().isEmpty()){
  53.     ErrPoint+=1;
  54.     }
  55.     if(ErrPoint==20){
  56.         Txserialport->close();
  57.         Txserialport->clear();
  58.         SerialPort_Link_Flag=false;
  59.         ErrPoint=0;
  60.         DspPoint=0;
  61.         ErrTime->stop();
  62.         ui->Show_ComPort_label->setText("請求無回應 重新連線中");
  63.         ui->Show_Decoding_label->setText("");
  64.     }
  65. }
  66. void MainWindow::Port_Link_Delay(){
  67.     if(Txserialport->readAll().isEmpty()){//Port接收緩存為空時 指針+1
  68.     ErrPoint++;
  69.     }
  70.     if(ErrPoint==5){//數值達到10次時
  71.         Txserialport->close();//關閉端口
  72.         Txserialport->clear();//清空緩存
  73.         LinkPoint++;//Port指針++
  74.         ErrPoint=0;//重置報錯指針
  75.         SerialPort_Link_Delay->stop();//停止計時
  76.         ui->Show_ComPort_label->setText("無可用連結 重新建立連線中");
  77.         ui->Show_Decoding_label->setText("");
  78.     }
  79. }


主要来说难题都在逻辑部份...Decode就难住我2周...整个快崩溃了
然后串口接收资料不完整也是让我整个难过了一整周
函式内没定义的都是全局变数
  1. void MainWindow::Rxreaddate()
  2. {
  3.     ErrPoint=0;
  4.     ErrTime->stop();
  5.     SerialPort_Link_Delay->stop();
  6.     TX_Begin_Flag = 1;
  7.     char pai_Rx_CRC,i,pai_CRC_temp=0,Rxlength=0;
  8.     int Read_Data[4]={0};
  9.     int Value;
  10.     Rx=Txserialport->readAll();
  11.     Rxlength=Rx.length();
  12.     char Rx_End_flag = 99;
  13.     for( i=0;i<Rxlength;i++)
  14.     {
  15.         if ( (Rx[i]&0x01) == 1 ) Rx_End_flag = i;
  16.         pai_Rx_Buffer_Array[pai_Rx_Buffer_Byte_Index_No+i] = Rx[i]&0xFE;
  17.     }
  18.     if ( Rx_End_flag != 99 )
  19.     {
  20.       pai_Rx_CRC = Rx[Rx_End_flag]& 0xFE;
  21.       for ( i = 0;i<4;i++)
  22.       pai_Rx_Data_Array[i] = pai_Rx_Buffer_Array[i];
  23.       pai_Rx_Buffer_Byte_Index_No = 0;
  24.       //******************Verify CRC**********************
  25.       for(i=0;i<4;i++)
  26.       pai_CRC_temp=pai_CRC_temp^pai_Rx_Data_Array[i];
  27.       if(pai_CRC_temp==pai_Rx_CRC)
  28.       {
  29.       //******************Decode Data**********************
  30.       Read_Data[0]=(pai_Rx_Data_Array[1]>>4)&0x0F;
  31.       Read_Data[1]=(pai_Rx_Data_Array[1]&0x0E)|((pai_Rx_Data_Array[2]>>7)&0x01);
  32.       Read_Data[2]=(pai_Rx_Data_Array[2]>>3)&0x0F;
  33.       Read_Data[3]=((pai_Rx_Data_Array[2]<<1)&0xE)|((pai_Rx_Data_Array[3]>>6)&0x03);
  34.       Value=(Read_Data[0]<<12)|
  35.             (Read_Data[1]<<8)|
  36.             (Read_Data[2]<<4)|
  37.             (Read_Data[3]);
  38.        ui->Show_Decoding_label->setText("解碼正常");
  39.       if(SerialPort_Link_Flag) Ui_Value_Buffer(Value);
  40.       if(!SerialPort_Link_Flag){
  41.           if(Value==0xAAAA){
  42.               SerialPort_Link_Flag=true;
  43.               ui->Show_ComPort_label->setText(SerialPort_Name[LinkPoint]);
  44.           }
  45.       }
  46.       }
  47.       else
  48.       {
  49.        ui->Show_Decoding_label->setText("解碼出現錯誤");
  50.        DspPoint--;
  51.       }
  52.     }
  53.     else
  54.        pai_Rx_Buffer_Byte_Index_No = i;
  55. }


数值有变化都是我控制板子造成的 没有直接在电脑上控制他表示有成功监控...

图片:123.gif


现在还有一难题过不了关 日子难过...

15 Jan 11:08

Chart和QtGraphicalEffects静态编译的问题

by XChinux@163.com (adadadda)
  一直想静态编译代码,但是在代码中使用了Chart和QtGraphicalEffects模块。Chart模块无法在别的电脑运行,QtGraphicalEffects无法编译。

因为我想使用Control 2,所以我用的Qt 5.8,顺便吐槽一句Qt 5.7的Control 2的BUG实在有点多,并且莫名其妙。

工程文件代码如下:
  1. QT += qml quick
  2. QT += core gui widgets
  3. QT += charts
  4. CONFIG += c++11
  5. SOURCES += main.cpp
  6. RESOURCES += qml.qrc
  7. # Additional import path used to resolve QML modules in Qt Creator's code model
  8. QML_IMPORT_PATH =
  9. # Additional import path used to resolve QML modules just for Qt Quick Designer
  10. QML_DESIGNER_IMPORT_PATH =
  11. # The following define makes your compiler emit warnings if you use
  12. # any feature of Qt which as been marked deprecated (the exact warnings
  13. # depend on your compiler). Please consult the documentation of the
  14. # deprecated API in order to know how to port your code away from it.
  15. DEFINES += QT_DEPRECATED_WARNINGS
  16. # You can also make your code fail to compile if you use deprecated APIs.
  17. # In order to do so, uncomment the following line.
  18. # You can also select to disable deprecated APIs only up to a certain version of Qt.
  19. #DEFINES += QT_DISABLE_DEPRECATED_BEFORE=0x060000    # disables all the APIs deprecated before Qt 6.0.0
  20. # Default rules for deployment.
  21. qnx: target.path = /tmp/${TARGET}/bin
  22. else: unix:!android: target.path = /opt/${TARGET}/bin
  23. !isEmpty(target.path): INSTALLS += target

chart需要用到Widget里面的东西,所以必须添加Widget,并且在main.c的代码里面要app类型为QApplication
main.c文件代码如下:
  1. #include <QQmlApplicationEngine>
  2. #include <QtWidgets/QApplication>
  3. #include <QtPlugin>
  4. Q_IMPORT_PLUGIN(QWindowsIntegrationPlugin)
  5. int main(int argc, char *argv[])
  6. {
  7.     QCoreApplication::setAttribute(Qt::AA_EnableHighDpiScaling);
  8.     QApplication app(argc, argv);
  9.     QQmlApplicationEngine engine;
  10.     engine.load(QUrl(QLatin1String("qrc:/main.qml")));
  11.     return app.exec();
  12. }

main.qml中的代码
  1. import QtQuick 2.7
  2. import QtQuick.Controls 2.1
  3. import QtQuick.Layouts 1.0
  4. import QtCharts 2.1
  5. import QtGraphicalEffects 1.0
  6. ApplicationWindow {
  7.     visible: true
  8.     width: 640
  9.     height: 480
  10.     title: qsTr("Hello World")
  11.     SwipeView {
  12.         id: swipeView
  13.         anchors.fill: parent
  14.         currentIndex: tabBar.currentIndex
  15.         Page {
  16.             Button{
  17.                 anchors.centerIn: parent
  18.                 text:"First page"
  19.                 layer.enabled: hovered
  20.                 layer.smooth: true
  21.                 layer.effect: DropShadow {
  22.                     color: activeFocus ? "#330066ff" : "#aaaaaa"
  23.                     verticalOffset: 3
  24.                     horizontalOffset: 3
  25.                     radius: 6
  26.                     samples: 12
  27.                     spread: 0.7
  28.                 }
  29.             }
  30.         }
  31.         Page {
  32.             ChartView {
  33.                 title: "Line"
  34.                 anchors.fill: parent
  35.                 antialiasing: true
  36.                 LineSeries {
  37.                     name: "LineSeries"
  38.                     XYPoint { x: 0; y: 0 }
  39.                     XYPoint { x: 1.1; y: 2.1 }
  40.                     XYPoint { x: 1.9; y: 3.3 }
  41.                     XYPoint { x: 2.1; y: 2.1 }
  42.                     XYPoint { x: 2.9; y: 4.9 }
  43.                     XYPoint { x: 3.4; y: 3.0 }
  44.                     XYPoint { x: 4.1; y: 3.3 }
  45.                 }
  46.             }
  47.         }
  48.     }
  49.     footer: TabBar {
  50.         id: tabBar
  51.         currentIndex: swipeView.currentIndex
  52.         TabButton {
  53.             text: qsTr("First")
  54.         }
  55.         TabButton {
  56.             text: qsTr("Second")
  57.         }
  58.     }
  59. }

静态编译所用的命令符:
configure.bat -confirm-license -opensource -platform win32-g++ -mp -debug-and-release -static -prefix "D:\Qt\5.8.0_MinGW_static" -qt-zlib -qt-libpng -qt-libjpeg -opengl desktop -qt-freetype -no-qml-debug -no-angle -nomake tests -nomake examples -skip qtwebengine -skip qtwebview

这个命令符是什么意思,我只能看懂-skip qtwebengine -skip qtwebview?会不会是静态编译包在制作的时候没有把Chart和QtGraphicalEffects编译进去?

还有一个问题,在Qt 5.8默认的编译器下,DEBUG会出现如下的问题,Release版本则不会:
ASSERT failure in void QtFontFamily::ensurePopulated(): "SimSun", file text\qfontdatabase.cpp, line 425
Invalid parameter passed to C runtime function.

我在网上找了相关的信息,有人遇到了,但是解决办法我没有看懂。链接如下:http://blog.csdn.net/zyzhaojun/article/details/52491041