Shared posts

04 Aug 01:11

A Friday night with bike folks

by jnyyz

My evening began with a critical mass ride that started in High Park. There were two very different themes that were being protested. The first was the recent ticketing of cyclists in High Park for exceeding the posted 20 kph speed limit, and for not stopping at stop signs. The second was the very heavy handed eviction of homeless from encampments in several parks. The link between the two themes was the over reliance on police force to solve problems, one relatively minor, and the other a serious and continuing issue of the homeless in the city.

A crowd gathered at the north entrance to High Park. I talked to several cyclists who had been ticketed. One of the speed traps was set up at the bottom of the hill on the west side of the loop, and cyclists were then stopped at the top of the hill. At the same time, cars going at least as fast were apparently not being ticketed.

It was sheer joy to circle the park surrounded by my fellow cyclists.

It was noted that just coasting down the hill it was easy to exceed 30 kph. Not that anyone present did such an outrageous thing.

After two and a half laps, a group split off to ride towards 14 Division. Here we are at the High Park Blvd entrance to the park.

Riding through Roncy.

In front of 14 Division on Dovercourt. Clapping, bell riding, and shouts of “shame”, and then a minute of silence to recognize the police brutality that accompanied the eviction of the homeless.

Thanks to David for organizing the event, and to everyone who rode with us.

I then wanted to check out Bike Party Toronto. The meeting place was Christie Pits. These gentlemen seemed oblivious to all the activity around them: many bikes with fancy decorations and lights, and several people in costume.

Syncing up the soundtrack. Oddly, the first track was the theme song from “the Price is Right”

Here we go.

This fellow had a tricked out Tern GSD with big speakers front and rear.

Circling Christie Pits.

Now on Bloor.

Not only did Natalie have one of the most decorated bikes, but she was also running a bubble machine when she was stopped.

U of T.

It’s getting darker now.

We pause at Trinity Bellwoods, and I take the opportunity to leave at this point.

I will say that the Bike Party was well organized, and it turned out to feel very much like a Critical Mass ride, with people helping to cork intersections, and occasional regroups to keep everyone together. Also since we had music and lights with us, bystanders were really happy to see us, in particular all of the people on the CafeTO patios. We were all out having a great evening out.

If you are interested in joining another Bike Party, check out the Toronto Cruisers page, or the Bike Parties Facebook page.

04 Aug 01:07

The Fine Line Between Reality and Imaginary

Nadine Dijkstra, Nautilus, Jul 30, 2021
Icon

I think this is a key to understanding not only how we think but also how we learn: "there is no real categorical difference between imagination and reality, but that they are subjectively intermixed. When this combination of internal and external signals is strong enough, we believe it reflects reality." The second key (not in the article) is that we don't intentionally create these signals, nbeither external nor internal. We don't 'construct' our understanding of reality. Rather, we grow into it through a process of, as Hume would say, custom and habit.

Web: [Direct Link] [This Post]
04 Aug 01:07

Bicycles May Use Full Lane

by peter@rukavina.net (Peter Rukavina)

As you’ve been moving about Charlottetown this month you may have noticed new cycling-related street signs installed, marking dedicated bicycle lanes, areas where the road should be shared with bicycles, and the like.

My favourite of this new crop of signs are the “Bicycles May Use Full Lane” signs like this one on Richmond Street.

Many city streets aren’t wide enough to safely allow cars and trucks to pass bicycles, especially the very narrow streets downtown. My strategy has always been to ride such that they simply can’t pass, and while this keeps me safer, it also means I need to gird myself against the palpable “how dare you!?” actions is frustrated drivers: the engine-gunning, the creeping up almost close enough to touch my back wheel, the sudden acceleration when finally freed from my annoyance.

While these signs won’t prevent that, at least they give me official comfort that I’m in the right.

04 Aug 01:06

Coronavirus Vaccines vs The Variants: Latest Data & Efficacy Figures

by David McCandless

Chart aggregating vaccine efficacy & effectiveness figures against Alpha, Beta, Delta, Gamma variants of the SARS-CoV-2 coronavirus from a multitude of sources.

» See the chart
» Review the data

Methodology

We reviewed all available publications, studies, reports and news articles (as of 30th July 2021), sourcing back to original studies where possible.

Where disparate sources cited different figures, we used the average of the range.

Sources

Major sources were Public Health England, New England Journal of Medicine, The Lancet, Institute for Health Metrics & Evaluation (IMHE), Centers for Disease Control, New York Times, and the excellent updates of Eric Topol. See the data doc for a full list of studies and articles.

Research issues & challenges

Not all studies specifically cite the variant. For those, we used the @IMHE_UW method: using “the study location as a proxy for the predominant variant [at the time]. eg. studies in S. Africa were assumed to represent efficacy against B.1.351”. (ref)

Not all media reports differentiate between vaccine protection against ‘symptomatic disease’ and ‘severe COVID & hospitalisation’ when citing % figures.

Nor do they necessarily differentiate between vaccine *efficacy* (performance in clinical trials) and *effectiveness* (real world performance). So it’s a bit of mush that’s taken us three weeks or so to pick apart & distill.

We’ll keep this updated with any major studies or new numbers as they emerge.

» See the chart

Some good sources compiling similar evidence:
» Pharmaceutical Journal
» British Heart Foundation

More sources in the data doc

04 Aug 01:06

GDPR Takes Sampling Bite Out Of Amazon

by Ton Zijlstra

Amazon has been fined 746 million Euro by the Luxembourg DPA (where Amazon’s EU activities reside). In its response Amazon shows it isn’t willing to publicly acknowledge to even understand the EU data protection rules.

There has been no data breach, and no customer data has been exposed to any third party. These facts are undisputed., said an Amazon spokesperson according to Techcrunch.

Those facts are of course undisputed because a data breach or exposure of data to third parties is not a prerequisite for being in breach of GDPR rules. Using the data yourself in ways that aren’t allowed is plenty reason in itself for fines the size of a few percentage points of your global yearly turnover. In Amazon’s case the fine isn’t even a third of a percentage point of their turnover, so about a day’s worth of turnover for them: they’re being let-off pretty lightly actually compared to what is possible under the GDPR.

How Amazon uses the data it collects, not any breach or somesuch, is the actual reason for the complaint by La Quadrature du Net (PDF) filed with the Luxembourg DPA: the complaint “alleges that Amazon manipulates customers for commercial means by choosing what advertising and information they receive.” (emphasis mine)

The complaint and the ruling are laying bare the key fact Amazon and other tech companies aren’t willing to publicly comment upon: adtech in general is in breach of the GDPR.

There are a range of other complaints along these lines being processed by various DPA’s in the EU, though for some of those it will be a long wait as e.g. the Irish DPA is working at a snail’s pace w.r.t. complaints against Apple and Facebook. (The slow speed of the Irish DPA is itself now the subject of a complaint.)

Meanwhile two new European laws have been proposed that don’t chime with the current modus operandi of Amazon et al, the Digital Markets Act and the Digital Services Act, which both contain still bigger potential fines than the GDPR for non-compliance w.r.t. e.g. interoperability, service-neutrality, and transparency and accountability measures. And of course there are the European anti-trust charges against Amazon as well.

Amazon will of course appeal, but it can only ever be an attempt to gaslight and gloss over the fundamental conflict between adtech and GDPR. Let’s hope the Luxembourg DPA continues to see through that.

04 Aug 01:05

Running OBS Studio in the Cloud

by Martin

In 2020, the Vintage Computing Festival had to happen online. For this, we used quite a number of virtual machines in the cloud (i.e. in a datacenter) to host the BBB video conference servers. The live streams of the talks, however, ran on a physical notebook and we used OBS Studio to record the screen of that notebook and stream it to to the CCC distribution network. And it looks like we are going to have at least a part of this year’s event in the cloud again. So it was time to think a bit about how to improve last year’s setup. Pretty high on my list: Virtualize that notebook with OBS on it and push it out into a virtual machine in the cloud.

The Problem Space

While running OBS on a physical notebook worked great, I felt that there are to areas in which we could improve this year: Running a BBB client in the browser with video streams, and OBS for recording and streaming at the same time takes quite some processing power. And even though the notebook was relatively new, the mobile Core i5 processor could not run BBB in the browser with OBS recording at full-HD resolution and streaming at the same time. So we settled for streaming at 1920x1080p and recording at 1280x720p. For the final publication of the video, the material was upscaled to 1080p again. Not ideal. And the second thing I didn’t like was that the notebook was physically located at my place. That meant that I had to run the streaming on my own for two days and became I and my Internet connectivity became the single point of failure.

OBS out in the Cloud

The fix for both problems is to put OBS for recording and streaming the screen into a virtual machine in a data center. That’s not quite the typical use of a VM in the cloud but I have found quite a number of good uses for it over the past year. Unfortunately, OBS is not on good terms with the x virtual frame buffer (xvfb) package that is the basis of my ‘GUI in the cloud’ solution. I also tried to get it working with other solutions such as X2Go but that also didn’t work. A bit of research on the Internet also didn’t get me anywhere. The problem as I understand it is that OBS requires OpenGL Mesa support of the X-server which xvfb and X2Go do not seem to provide.

But then I noticed that there is yet another approach to running a Linux X-Server and window system in a virtual machine: By simulating a graphics card and screen instead of ‘just’ a virtual frame buffer. Linux ships with a number of graphics card drivers, such as for example for Intel, Nvidia or AMD graphics chips. And on top, it comes with an X-server graphics driver called “xserver-xorg-video-dummy”. And this X-server and driver combination combines OpenGL Mesa support in software. Ah! And with this approach I could get OBS running in the cloud in a virtual machine without a real graphics card.

While OBS would take great videos of non-video content like scrolling through web pages, recording of video content did not look quite right. It’s hard to explain. After a good night’s sleep, however, I had the idea to see if I could get the refresh rate of the simulated screen that is attached to the simulated graphics card to exactly 60 Hz, so OBS could record at 30 Hz exactly. And that was the final piece of the puzzle Once that simulated monitor ran at a refresh rate 60 Hz, OBS suddenly produced sharp and crisp recordings of video content, e.g. of BBB sessions.

VM Setup

O.k., long story short, here’s how the VM has to be set-up to make this work. In my case, I got a VM at Hetzner for the purpose. I scaled it up and down a bit to see how many vCPUs I need, and came up with 8 vCPUs for 1920x1080p streaming and recording with BBB running in a browser. Yes, that’s not a small VM, but at around €35 a month or around €1 a day, quite affordable.

One strange thing: The setup described below will only work with their Intel based VMs, while the X-server stubbornly refuses to work in their AMD based VMs. I made the same experience with my other VNC based cloud GUI solutions. If you have any idea why, please leave a comment.

And here is the sequence of package installs in the VM that brings the system to life. First, the repository is updated, the video dummy driver and X-server system is installed, and a new user is created to be used in the GUI as follows:

apt update
apt-get install xserver-xorg-video-dummy

adduser cloud

# Root rights for the user
usermod -aG sudo cloud

The X-server requires a config file in /etc/X11/xorg.conf that should have the following content. The Modeline used in this config file creates a monitor that runs with a refresh rate of exactly 60 Hz. This is important for OBS to create high quality recordings of video streams!

nano /etc/X11/xorg.conf
# This xorg configuration file is meant to be used
# to start a dummy X11 server.
# For details, please see:
# https://www.xpra.org/xorg.conf

# Here we setup a Virtual Display of 1920x1080 pixels
 
Section "Device"
     Identifier "Configured Video Device"
     Driver "dummy"
     #VideoRam 4096000
     VideoRam 256000
     #VideoRam 16384
EndSection

Section "Monitor"
    Identifier "Configured Monitor"
    HorizSync 5.0 - 1000.0
    VertRefresh 5.0 - 200.0
    Modeline "1920x1080_60.00"  173.00  1920 2048 2248 2576  1080 1083 1088 1120 -hsync +vsync
EndSection

Section "Screen"
    Identifier "Default Screen"
    Monitor "Configured Monitor"
    Device "Configured Video Device"
    DefaultDepth 24
    SubSection "Display"
        Viewport 0 0
        Depth 24
        Virtual 1920 1080
    EndSubSection
EndSection

Next, configure and run the X-server and abort with CTRL-C once the config was written and the output stops after a second:

X -config /etc/X11/xorg.conf 

Now, install the Ubuntu desktop packages for the GUI:

sudo apt install x11vnc gnome-shell ubuntu-gnome-desktop autocutsel gnome-core gnome-panel gnome-themes-standard gnome-settings-daemon metacity nautilus gnome-terminal dconf-editor gnome-tweaks yaru-theme-unity yaru-theme-gnome-shell yaru-theme-gtk yaru-theme-icon fonts-ubuntu tmux fonts-emojione

And that’s it, now reboot.

reboot

When the system comes up it takes a few seconds for the X-server to start and the Ubuntu login screen to initialize. Once ready, start the VNC server with the X token of root and use a VNC Client such as Remmina to enter the user’s password. The user id (114 in this example) might be different on your system.

Note: The first time you run x11vnc, it requires a password to be entered. It’s limited to 8 characters, all characters beyond are ignored. Not good at all from a security point of view but you can always use the -localhost parameter, so the TCP port used by x11vnc is not exposed to the world and tunnel the connection through an SSH tunnel.

sudo x11vnc  -auth /run/user/114/gdm/Xauthority -usepw -forever -repeat -display :0

Now enter the password for user “cloud” that was created a the beginning of the process. The greeter will then go away but is not replaced by the desktop, as that runs as user “cloud”. Press CTRL-C to abort x11vnc and restart it with the X token of user “cloud”. Again, the user id (1000 in this example) might be different on your machine:

sudo x11vnc  -auth /run/user/1000/gdm/Xauthority -usepw -forever -repeat -display :1

We are almost there now but one thing remains to be done: We need audio for OBS recording. Turns out that the PulseAudio system works well even if no physical sound card exists:

sudo apt-get install pulseaudio jackd2 alsa-utils dbus-x11

And that’s it, the desktop in the cloud is complete now and the final thing that remains to be done is to install and run OBS:

sudo apt install obs-studio 

There you go, OBS studio in the cloud with 1920x1080p recording of BBB sessions.

04 Aug 00:30

Making CRDTs faster, by @JosephGentle: “I wa...

Making CRDTs faster, by @JosephGentle:

“I want Google Docs without Google…I think [CRDTs are] the future of collaborative editing. And maybe the future of all software - but I’m not ready to talk about that yet.”

04 Aug 00:14

Scraping politely

by kchodorow

A lot of projects require scraping websites. I usually write a scraper, run it, it fetches all of the data, and then fails in some final step before writing it anywhere. Then I curse a bit and try to fix my program without being sure what the responses actually looked like. Then I rerun my script, crossing my fingers that I don’t go over any rate limits.

This isn’t optimal, so I’ve finally come up with a better system for this. My requirements are:

  1. Only download a page once.
  2. …for a given time period (e.g., a day). If I rerun after that time period, download the page again.
  3. Make everything human-readable. I want to be able to easily find the response for a given request and visually inspect it.
  4. Basic rate limiting support.
  5. Not reinvent the wheel.

So basically, if I request http://httpbin.org/anything?foo=bar I want it to save the response to a file like ./.db/cache/2021-07-31/httpbin.org_anything_foo_bar. Then I can cat the file and see the response (or delete it to “clear” the cache). However, URLs can be much longer than legal filenames (and the human-readable scheme above could cause collisions), so I’m going to compromise and store the response in file with an opaque hash for a name (e.g., ./.db/cache/2021-07-31/e23403ee51adae9260d7810e2f49f0f2098d8a25c3581440d25d20d02e00ccb9) and then have a CSV file in the directory that maps request URL -> hash. It’s not quite as user-friendly as being able to just visually examine the filename, but I can just do:

$ cat ./.db/cache/2021-07-31/cache_map.csv | grep 'foo=bar'
e23403ee51adae9260d7810e2f49f0f2098d8a25c3581440d25d20d02e00ccb9,http://httpbin.org/anything?foo=bar

I’m using Python, so for not reinventing the wheel, I decided to use requests-cache. The requests-cache package actually has an option to write responses to the filesystem, but I wanted some custom behavior: 1) the cache_map.csv file as described above and 2) naming cache directories by date. Thus, I implemented a custom storage layer for requests-cache to use.

requests-cache represents storage as a dict: each URL is hashed and then requests-cache calls the getter or setter for that hash, depending on if it’s reading or writing. Thus, to implement custom storage, I just have to implement the dict interface to read/write to the filesystem, plus keep my cache_map.csv up-to-date:

class FilesystemStorage(requests_cache.backends.BaseStorage):

    def __init__(self, **kwargs):
        # I'm using APIs that return JSON, so it's easiest to
        # use the built-in JSON serializer.
        super().__init__(serializer='json', **kwargs)

        # A cache a day keeps the bugs at bay.
        today = datetime.datetime.today().strftime('%Y-%m-%d')
        self._storage_dir = os.path.join('.db/cache', today)
        if not os.path.isdir(self._storage_dir):
            os.makedirs(self._storage_dir, exist_ok=True)

        # The map of filename hashes -> URLs.
        self._cache_map = os.path.join(self._storage_dir, 'cache_map.csv')
        # Load any existing cache.
        self._cache = self._LoadCacheMap()

    def _LoadCacheMap(self) -> Dict[str, str]:
        if not os.path.exists(self._cache_map):
            return {}
        # Using pandas is overkill, but are you even a data
        # scientist if you don't?
        return pd.read_csv(self._cache_map, index_col='filename')['url'].to_dict()

    # Dict implementation.

    def __getitem__(self, key: str) -> requests_cache.CachedResponse:
        if key not in self._cache:
            raise KeyError
        k = os.path.join(self._storage_dir, key)
        with open(k, mode='rb') as fh:
            content = fh.read()
        # I want to be able to get the URL from the response,
        # so adding it here.
        url = self._cache[key]
        return requests_cache.CachedResponse(content, url=url)

    def __setitem__(self, key: str, value: requests_cache.CachedResponse):
        # Note that `key` is already hashed, so we use `value`'s
        # URL attribute to get the human-readable URL.
        k = os.path.join(self._storage_dir, key)
        with open(k, mode='wt') as fh:
            json.dump(value.json(), fh)
        # Update cache map
        self._cache[key] = value.url
        # Write the cache back to the file system.
        (
            pd.Series(self._cache, name='url')
            .rename_axis('filename')
            .to_frame()
            .to_csv(self._cache_map)
        )

    # I don't plan on using these, so didn't both implementing them.
    def __delitem__(self, key):
        pass
    
    def __iter__(self):
        pass
    
    def __len__(self) -> int:
        return len(self._cache)

Now I add a simple cache class to use this custom storage:

class FilesystemCache(requests_cache.backends.BaseCache):
    """Stores a map of URL to filename."""

    def __init__(self, **kwargs):
        super().__init__(**kwargs)
        storage = FilesystemStorage(**kwargs)
        self.redirects = storage
        self.responses = storage

Note that I’m using the same instance of my cache for both responses and redirects. This isn’t optimal if I were actually expecting redirects, but I’m not and my storage layer is designed to be a singleton (as implemented, multiple instances would clobber each other).

Now I create a request class that uses my custom cache.

import requests_cache
from typing import Any, Dict

from lib import custom_cache

class Requester(object):

    def __init__(self):
        self._client = requests_cache.CachedSession(
            backend=custom_cache.FilesystemCache())

    def DoRequest(self, url: str) -> Dict[str, Any]:
        resp = self._client.get(url, headers=_GetHeader())
        body = resp.json()
        # The API I'm using always has a 'data' field in valid
        # responses, YMMV.
        if 'data' not in body:
            raise ValueError('Unexpected response: %s' % resp.text)
        return body

This reads auth info from environment variables:

def _GetHeader() -> Dict[str, str]:
    return {'Authorization': 'Bearer %s' % _GetBearerToken()}

def _GetBearerToken() -> str:
   bearer_token = os.getenv('bearer_token')
   if not bearer_token:
       raise RuntimeError('No bearer token found, try `source setup.env`')
   return bearer_token

Finally, I want to support rate limiting. I used the ratelimit package for this. ratelimit is based on the Twitter API, which rate limits on 15-minute intervals. So if I was hitting an endpoint that allowed 10 requests/minute (10*15 = 150 requests per 15 minutes) then I could write:

@ratelimit.sleep_and_retry
@ratelimit.limits(calls=150)
def DoApiCall(self, url) -> Dict[str, Any]:
    return self._requester.DoRequest(url)

This will block the program’s main thread if this function is called more frequently than the allowed rate limit (which may not be what you want, check the ratelimit docs for other options).

The downside of this implementation is that it still rate limits, even if you’re hitting the cache. You could get around this by checking the cache contents in Requester and then only conditionally calling DoApiCall, but this is left as an exercise for the reader 😉

04 Aug 00:13

Grammar checking (and spelling as well in 25 Languages.)

by Matt Harris


Thunderbird has long missed out of a grammar checking library or addon.  Companies like Gammarly have fallen over themselves to get addons for browsers,  but none has shown interest in supporting desktop mail clients like Thunderbird.

This week that changed as the Grammar and Spell Checker - LanguageTool has been ported from Firefox to Thunderbird.  


The tool has been available for Firefox for some time and has some 170,000 users on Firefox with almost 2000 five star reviews ad a Recommended badge from Mozilla so I was determined to try it.  So far I like it.

The grammar and spell checker for Thunderbird is obviously very new and there is little to judge it by except the reviews for other products which appear to be mostly very good.  I have only used it in Thunderbird for one day and it has so far been quite useful, except I have to unlearn the right click spelling for Thunderbird.  Now it is right click.

The addon can be downloaded from here and I recommend it as it is the only game in town.  But it does have some fairly good features and supports a wide range of programs and writing platforms in the paid version.

The developers web site https://languagetool.org/ indicates the developer hosts it's servers in Germany and that the product is GDPR-compliant so the privacy of data will be a hight priority.


04 Aug 00:12

Went to the Imperfect Offerings show at the RAG...

Went to the Imperfect Offerings show at the RAG yesterday.

I was blown away by Naoko Fukumaru’s work, where she does kintsugi on & with a variety of objects & materals: urchins, gilded blackberry spines, & barnacles.

04 Aug 00:12

Week Notes 21#29

by Ton Zijlstra

I’m writing this a week late and postdating it. Completely forgot about it the weekend itself, after our arrival in Denmark for our vacation. That’s a good sign.

This week I

  • spent more time with Y now that school is closed for the summer
  • did some early invoicing for July, a some of our team are leaving for their vacation
  • looked at a proposed set of indicators for policy tracking w.r.t. smart multimodal mobility
  • got my second covid vaccine shot at the start of the week
  • wrote a Q2 progress report for a client
  • had a session with the ministry for infrastructure and water management with their data team and smart mobility team
  • wrote draft texts for a client for their proposal to the ministry for the interior for 2022
  • did the Q2 book keeping and VAT tax filings for the 5 entities I do the books for
  • went to the office, for a face to face session with part of our team with an agency to get to a ‘house style’
  • finished up our review of the first phase of our work in Rotterdam on air quality and citizen science, and our advice and a plan for the next phase, and submitted it to the client
  • packed up for our trip, printed our vaccination cards (in case our phones might lack a data connection at the border, or have empty batteries).
  • had a Covid test, necessary to enter Denmark
  • drove us to E’s parents’ place, right on the German border, shaving about 90 minutes of our trip to Denmark
  • drove to Copenhagen on Friday, choosing the land route as it provided more certainty w.r.t. travel times with the ferry operating at 35% capacity to help maintain distance between passengers.
  • over the weekend enjoyed our very beautiful (and local architecture price winning) temporary home in Copenhagen, had the mandatory Covid-test after arrival, cycled through the city on a Christiania cargo bike, visited the beach near Helsingør, and met our friend Henriette in Helsingør for a late lunch at the harbour

It was a busy week, and preparing the household for travel always is a bit chaotic, even without the Covid travel rules currently in place, but it was a good week.

20210727_162650
Hello Copenhagen, it’s good to see you again! View from Rundetaarn, by Ton Zijlstra license CC BY NC SA


This is a RSS only posting for regular readers. Not secret, just unlisted. Comments / webmention / pingback all ok.
Read more about RSS Club
04 Aug 00:12

Week Notes 21#30

by Ton Zijlstra

We’re at the end of our first full week in Denmark. It’s good to travel again, and see different things. Our temporary home’s garden is very pleasant, with a few different seating spots to catch the sun or shade at different times of the day. I’ve spent quite a bit of time in it, just enjoying being outside.

Last week I skipped writing my week notes, so I wrote them and backfilled the notes for last week today.

This week we spent enjoying our time together in Copenhagen. We spent a day in town, browsing some shops, having lunch outside, visiting the Lego store with Y where she got a big tower that we then built at home together. Visited the beach again. Another day we cycled to the Kongens Have, the King’s garden for coffee and a visit to the Rosenborg castle to see the crown jewels which didn’t happen until the next day, as all available slots were sold out. The nice weather is interrupted now and then with heavy downpours, and one of them caught up with us while cycling back to the house. Yesterday we visited the Experimentarium, a huge indoor ‘playground’ for kids to experiment with all kinds of things. Y xat first didn’t know where to look, there was so much to do.

In between I did a few work related things, such as tax payments, a board decision with the NGO I chair to turn temporary contracts for several team members into permanent ones, and I got some writing about ideas done.

20210730_115800
Enjoying coffee and ice cream at the Coffee Collective near Nørreport after visiting Rosenborg castle to see the crown jewels (hence Y wearing a crown). Image by Ton Zijlstra, license CC BY NC SA


This is a RSS only posting for regular readers. Not secret, just unlisted. Comments / webmention / pingback all ok.
Read more about RSS Club
04 Aug 00:11

A beautiful power tool to scrape, clean, and combine data

by Jon Udell

Labels like “data scientist” and “data journalist” connote an elite corps of professionals who can analyze data and use it to reason about the world. There are elite practitioners, of course, but since the advent of online data a quarter century ago I’ve hoped that every thinking citizen of the world (and of the web) could engage in similar analysis and reasoning.

That’s long been possible for those of us with the ability to wrangle APIs and transform data using SQL, Python, or another programming language. But even for us it hasn’t been easy. When I read news stories that relate to the generation of electric power in California, for example, questions occur to me that I know I could illuminate by finding, transforming, and charting sources of web data:

– How can I visualize the impact of shutting down California’s last nuclear plant?

– What’s the relationship between drought and hydro power?

All the ingredients are lying around in plain sight, but the effort required to combine them winds up being more trouble than it’s worth. And that’s for me, a skilled longtime scraper and transformer of web data. For you — even if you’re a scientist or a journalist! — that may not even be an option.

Enter Workbench, a web app with the tagline: “Scrape, clean, combine and analyze data without code.” I’ve worked with tools in the past that pointed the way toward that vision. DabbleDB in 2005 (now gone) and Freebase Gridworks in 2010 (still alive as Open Refine) were effective ways to cut through data friction. Workbench carries those ideas forward delightfully. It enables me to fly through the boring and difficult stuff — the scraping, cleaning, and combining — in order to focus on what matters: the analysis.

Here’s the report that I made to address the questions I posed above. It’s based on a workflow that you can visit and explore as I describe it here. (If you create your own account you can clone and modify.)

The workflow contains a set of tabs; each tab contains a sequence of steps; each step transforms a data set and displays output as a table or chart. When you load the page the first tab runs, and the result of its last step is displayed. In this case that’s the first chart shown in the report:

As in a Jupyter notebook you can run each step individually. Try clicking step 1. You’ll see a table of data from energy.ca.gov. Notice that step 1 is labeled Concatenate tabs. If you unfurl it you’ll see that it uses another tab, 2001-2020 scraped, which in turn concatenates two other tabs, 2001-2010 scraped and 2011-2020 scraped. Note that I’ve helpfully explained that in the optional comment field above step 1.

Each of the two source tabs scrapes a table from the page at energy.ca.gov. As I note in the report, it wasn’t necessary to scrape those tables since the data are available as an Excel file that can be downloaded, then uploaded to Workbench (as I’ve done in the tab named energy.ca.gov xslx). I scraped them anyway because that web page presents a common challenge: the data appear in two separate HTML tables. That’s helpful to the reader but frustrating to an analyst who wants to use the data. Rapid and fluid combination of scraped tables is grease for cutting through data friction; Workbench supplies that grease.

Now click step 2 in the first tab. It’s the last step, so you’re back to the opening display of the chart. Unfurl it and you’ll see the subset of columns included in the chart. I’ve removed some minor sources, like oil and waste heat, in order to focus on major ones. Several details are notable here. First: colors. The system provides a default palette but you can adjust it. Black wasn’t on the default palette but I chose that for coal.

Second, grand total. The data set doesn’t include that column, and it’s not something I needed here. But in some situations I’d want it, so the system offers it as a choice. That’s an example of the attention to detail that pervades every aspect of Workbench.

Third, Vega. See the triple-dot button above the legend in the chart? Click it, then select Open in Vega Editor, and when you get there, click Run. Today I learned that Vega is:

a declarative format for creating, saving, and sharing visualization designs. With Vega, visualizations are described in JSON, and generate interactive views using either HTML5 Canvas or SVG.

Sweet! I think I’ll use it in my own work to simplify what I’ve recently (and painfully) learned how to do with D3.js. It’s also a nice example of how Workbench prioritizes openness, reusability, and reproducibility in every imaginable way.

I use the chart as the intro to my report, which is made with an elegant block editor in which you can combine tables and charts from any of your tabs with snippets of text written in markdown. There I begin to ask myself questions, adding tabs to marshal supporting evidence and sourcing evidence from tabs into the report.

My first question is about the contribution that the Diablo Canyon nuclear plant has been making to the overall mix. In the 2020 percentages all major sources tab I start in step 1 by reusing the tab 2001-2020 scraped. Step 2 filters the columns to just the same set of major sources shown in the chart. I could instead apply that step in 2001-2020 scraped and avoid the need to select columns for the chart. Since I’m not sure how that decision might affect downstream analysis I keep all the columns. If I change my mind it’s easy to push the column selection upstream.

Workbench not only makes it possible to refactor a workflow, it practically begs you to do that. When things go awry, as they inevitably will, it’s no problem. You can undo and redo the steps in each tab! You won’t see that in the read-only view but if you create your own account, and duplicate my workflow in it, give it a try. With stepwise undo/redo, exploratory analysis becomes a safe and stress-free activity.

At step 2 of 2020 percentages all major sources we have rows for all the years. In thinking about Diablo Canyon’s contribution I want to focus on a single reference year so in step 3 I apply a filter that selects just the 2020 row. Here’s the UX for that.

In situations like this, where you need to select one or more items from a list, Workbench does all the right things to minimize tedium: search if needed, start from all or none depending on which will be easier, then keep or remove selected items, again depending on which will be easier.

In step 4 I include an alternate way to select just the 2020 row. It’s a Select SQL step that says select * from input where Year = '2020'. That doesn’t change anything here; I could omit either step 3 or step 4 without affecting the outcome; I include step 4 just to show that SQL is available at any point to transform the output of a prior step.

Which is fantastic, but wait, there’s more. In step 5 I use a Python step to do the same thing in terms of a pandas dataframe. Again this doesn’t affect the outcome, I’m just showing that Python is available at any point to transform the output of a prior step. Providing equivalent methods for novices and experts, in a common interface, is extraordinarily powerful.

I’m noticing now, by the way, that step 5 doesn’t work if you’re not logged in. So I’ll show it to you here:

Step 6 transposes the table so we can reason about the fuel types. In steps 3-5 they’re columns, in step 6 they become rows. This is a commonly-needed maneuver. And while I might use the SQL in step 4 to do the row selection handled by the widget in step 3, I won’t easily accomplish the transposition that way. The Transpose step is one of the most powerful tools in the kit.

Notice at step 6 that the first column is named Year. That’s a common outcome of transposition and here necessitates step 7 in which I rename it to Fuel Type. There are two ways to do that. You can click the + Add Step button, choose the Rename columns option, drag the new step into position 7, open it, and do the renaming there.

But look:

You can edit anything in a displayed table. When I change Year to Fuel Type that way, the same step 7 that you can create manually appears automatically.

It’s absolutely brilliant.

In step 8 I use the Calculate step to add a new column showing each row’s percentage of the column sum. In SQL I’d have to think about that a bit. Here, as is true for so many routine operations like this, Workbench offers the solution directly:

Finally in step 9 I sort the table. The report includes it, and there I consider the question of Diablo Canyon’s contribution. According to my analysis nuclear power was 9% of the major sources I’ve selected, contributing 16,280 GWh in 2020. According to another energy.ca.gov page that I cite in the report, Diablo Canyon is the only remaining nuke plant in the state, producing “about 18,000 GWh.” That’s not an exact match but it’s close enough to give me confidence that reasoning about the nuclear row in the table applies to Diablo Canyon specifically.

Next I want to compare nuclear power to just the subset of sources that are renewable. That happens in the 2020 percentages renewable tab, the output of which is also included in the report. Step 1 begins with the output of 2020 percentages of all major sources. In step 2 I clarify that the 2020 column is really 2020 GWh. In step 3 I remove the percent column in order to recalculate it. In step 4 I remove rows in order to focus on just nuclear and renewables. In step 5 I recalculate the percentages. And in step 6 I make the chart that also flows through to the report.

Now, as I look at the chart, I notice that the line for large hydro is highly variable and appears to correlate with drought years. In order to explore that correlation I look for data on reservoir levels and arrive at https://cdec.water.ca.gov/. I’d love to find a table that aggregates levels for all reservoirs statewide since 2001, but that doesn’t seem to be on offer. So I decide to use Lake Mendocino as a proxy. In step 1 I scrape an HTML table with monthly levels for the lake since 2001. In step 2 I delete the first row which only has some months. In step 3 I rename the first column to Year in order to match what’s in the table I want to join with. In step 4 I convert the types of the month columns from text to numeric to enable calculation. In step 5 I calculate the average into a new column, Avg. In step 6 I select just Year and Avg.

When I first try the join in step 8 it fails for a common reason that Workbench helpfully explains:

In the other table Year looks like ‘2001’, but the text scraped from energy.ca.gov looks like ‘2,001’. That’s a common glitch that can bring an exercise like this to a screeching halt. There’s probably a Workbench way to do this, but in step 7 I use SQL to reformat the values in the Year column, removing the commas to enable the join. While there I also rename the Avg column to Lake Mendocino Avg Level. Now in tab 8 I can do the join.

In tab 9 I scale the values for Large Hydro into a new column, Scaled Large Hydro. Why? The chart I want to see will compare power generation in GWh (gigawatt hours) and lake levels in AF (acre-feet). These aren’t remotely compatible but I don’t care, I’m just looking for comparable trends. Doubling the value for Large Hydro gets close enough for the comparison chart in step 10, which also flows through to the report.

All this adds up to an astonishingly broad, deep, and rich set of features. And I haven’t even talked about the Clean text step for tweaking whitespace, capitalization, and punctuation, or the Refine step for finding and merging clusters of similar values that refer to the same things. Workbench is also simply beautiful as you can see from the screen shots here, or by visiting my workflow. When I reviewed software products for BYTE and InfoWorld it was rare to encounter one that impressed me so thoroughly.

But wait, there’s more.

At the core of my workflow there’s a set of tabs; each is a sequence of steps; some of these produce tables and charts. Wrapped around the workflow there’s the report into which I cherrypick tables and charts for the story I’m telling there.

There’s also another kind of wrapper: a lesson wrapped around the workflow. I could write a lesson that guides you through the steps I’ve described and checks that each yields the expected result. See Intro to data journalism for an example you can try. Again, it’s brilliantly well done.

So Workbench succeeds in three major ways. If you’re not a data-oriented professional, but you’re a thinking person who wants to use available web data to reason about the world, Workbench will help you power through the grunt work of scraping, cleaning, and combining that data so you can focus on analysis. If you aspire to become such a professional, and you don’t have a clue about how to do that grunt work, it will help you learn the ropes. And if you are one of the pros you’ll still find it incredibly useful.

Kudos to the Workbench team, and especially to core developers Jonathan Stray, Pierre Conti, and Adam Hooper, for making this spectacularly great software tool.

04 Aug 00:07

What can be learned from studying long gone development practices?

by Derek Jones

Current ideas about the best way of building a software system are heavily influenced by the ideas that captured the attention of previous generations of developers. Can anything of practical use be learned from studying long gone techniques for building software systems?

During the writing of my software engineering book, I was spending a lot of time researching the development techniques used during the twentieth century, and one day I suddenly realised that this was a waste of time. While early software developers tend to be eulogized today, the reality is that they were mostly people who had little idea what they were doing, who through personal competence of being in the right place at the right time managed to produce something good enough. On the whole, twentieth century software development techniques are only of historical interest. Yes, some timeless development principles were discovered, and these can be integrated into today’s techniques (which may also turn out to be of their-time).

My experience of software development in the late 1970s and 1980s is that there was rarely any connection between what management told the world about the development process, and how those reporting to the manager actually did the development.

If you are a manager in a world where software development is still very new, and you are given the job of managing the development of a software system, how do you go about it? A common approach is to apply the techniques that are already being used to run the manager’s organization. On a regular basis, managers came up with the idea of applying techniques from the science of industrial production (which is still happening today).

In the 1970s and 1980s there were usually very visible job hierarchies, and sharply defined roles. Organizations tended to use their existing job hierarchies and roles to create the structure for their software development employees. For years after I started work as a graduate, managers and secretaries were surprised to see me typing; secretaries typed, men did not type, and women developers fumed when they were treated like secretaries (because they had been seen typing).

The manual workers performed data entry, operated the computer (e.g., mounted tapes, and looked after the printer). The junior staff often started with the job title programmer, or perhaps junior programmer and there might be senior programmers; on paper these people wrote the code to implement the functionality specified by a systems analyst (or just analyst, or business analyst, perhaps with added junior or senior). Analysts did not to write code and programmers only coded what the specification they were given, at least according to management.

Pay level was set by the position in the job hierarchy, with those higher up earning more than those below them, and job titles/roles were also mapped to positions in the hierarchy. This created, in theory, a direct correspondence between pay and job title/role. In practice, organizations wanted to keep their productive employees, and so were flexible about the correspondence between pay and title, e.g., during their annual review some people were more interested in the status provided by a job title, while others wanted more money and did not care about job titles. Add into this mix the fact that pay/title levels rarely matched up between organizations, it soon became obvious to all that software job titles were a charade.

How should the people at the sharp end go about building a software system?

Structured programming was the widely cited technique in the 1970s. Consultants promoted their own variants, with Jackson structured programming being widely known in the UK, with regular courses and consultants offering to train staff. Today, structured programming appears remarkably simplistic, great for writing tiny programs (it has an academic pedigree), but not for anything larger than a thousand lines. Part of its appeal may have been this simplicity, many programs were small (because computer memory was measured in kilobytes) and management often thought that problems were simple (a recurring problem). There were a few adaptations that tried to address larger scale issues, e.g., Warnier/Orr structured programming.

The military were major employers of software developers in the 1960s and 1970s. In the US Work Breakdown Structure was mandated by the DOD for project development (for all projects, not just software), and in the UK we had MASCOT. These mandated development methodologies were created by committees, and have not been experimentally tested to be better/worse than any other approach.

I think the best management technique for successfully developing a software system in the 1970s and 1980s (and perhaps in the following decades), is based on being lucky enough to have a few very capable people, and then providing them with what is needed to get the job done while maintaining the fiction to upper management that the agreed bureaucratic plan is being followed.

There is one technique for producing a software system that rarely gets mentioned: keep paying for development until something good enough is delivered. Given the life-or-death need an organization might have for some software systems, paying what it takes may well have been a prevalent methodology during the early days of major software development.

To answer the question posed at the start of this post. What might be learned from a study of early software development techniques is the need for management to have lots of luck and to be flexible; funding is easier to obtain when managing a life-or-death project.

04 Aug 00:04

Twitter Favorites: [katherinebailey] I participated in a philosophy workshop earlier this week - that’s a first! It was on Feminism, Social Justice, and… https://t.co/PJxBCsbbhh

Katherine Bailey @katherinebailey
I participated in a philosophy workshop earlier this week - that’s a first! It was on Feminism, Social Justice, and… twitter.com/i/web/status/1…
04 Aug 00:04

Twitter Favorites: [Lesley_NOPE] Cheers fam. I love you all so very very much. https://t.co/G6cjmiBgaE

I’m home @Lesley_NOPE
Cheers fam. I love you all so very very much. pic.twitter.com/G6cjmiBgaE
04 Aug 00:04

Twitter Favorites: [Lesley_NOPE] I’m craie https://t.co/S0r4KvfhVe

04 Aug 00:04

Twitter Favorites: [zeynep] Provincetown was a worse case scenario from what I can tell—week of overcrowded, indoors and close-contact— and als… https://t.co/fLMtQhOdLh

zeynep tufekci @zeynep
Provincetown was a worse case scenario from what I can tell—week of overcrowded, indoors and close-contact— and als… twitter.com/i/web/status/1…
04 Aug 00:04

Twitter Favorites: [nbellotoronto] Using @BikeShareTO to enjoy another lovely #activeto road opening today https://t.co/BDoL5iqnPM

nicolas bello @nbellotoronto
Using @BikeShareTO to enjoy another lovely #activeto road opening today pic.twitter.com/BDoL5iqnPM
04 Aug 00:04

Twitter Favorites: [Sean_YYZ] What can be done in a grown up city. https://t.co/v7l5aufV0b

Sean Marshall @Sean_YYZ
What can be done in a grown up city. pic.twitter.com/v7l5aufV0b
04 Aug 00:04

Twitter Favorites: [Sean_YYZ] “I’m a white male, aged 18 to 49. Everyone listens to me, no matter how dumb my suggestions are.” https://t.co/hrx5il1hFS

Sean Marshall @Sean_YYZ
“I’m a white male, aged 18 to 49. Everyone listens to me, no matter how dumb my suggestions are.” twitter.com/ooccouchgags/s…
04 Aug 00:03

Twitter Favorites: [tomhawthorn] A 15-year-old "Reach for the Top" nerd. https://t.co/2OWH39coWi https://t.co/BwQTma4Tn9

Tom Hawthorn @tomhawthorn
A 15-year-old "Reach for the Top" nerd. twitter.com/DMacdha/status… pic.twitter.com/BwQTma4Tn9
04 Aug 00:03

Twitter Favorites: [skinnylatte] Eavesdropping on straight strangers flirting with each other is like an anthropological exercise for me. It’s so in… https://t.co/PYyTqk6mNQ

Adrianna Tan 陈丽珍 @skinnylatte
Eavesdropping on straight strangers flirting with each other is like an anthropological exercise for me. It’s so in… twitter.com/i/web/status/1…
04 Aug 00:03

Fellow Democrats

Fellow Democrats,

Yesterday afternoon, a now-former member of the Malden (MA) Democratic City Committee’s disciplinary committee sent an email mentioning me to a number of people. In doing so, she violated a written promise of confidentiality.

This was an astonishing and deplorable breach of faith. The former member was right to submit her resignation, but should have addressed herself to the Ward Chair or Secretary alone.

That she saw fit to broadcast her remarks was wrong. That she communicated them to all save myself was cowardly.

The context of this entire matter has been my effort over a span of years to bring our local Democratic Party into more active opposition to American fascism and Republican totalitarianism, to be more than a social club. The former member had insisted that I adopt Reinhold Niebuhr’s “serenity prayer.” In this context, to require an atheist Jew to conform to this Protestant invocation is inappropriate and un-American.

Inchoate antisemitism is rife in our little neighborhood branch of the Democratic Party, to an extent that would have astonished me only a few years ago. People complain that I talk funny and use big words. Richard Wagner (in “Music and Jewishness”, 1856) started from the question, “Why do none of us like Jews?” One answer for Wagner was that Jews use weird words and they talk like they're not from here: “Words and constructions are hurled together in this jargon with wondrous inexpressiveness... the sole concern is talking at all hazards, and not the object which might make that talk worth doing.”

People sometimes complain that I am loud and angry. In the face of caged children and murderous police, they would prefer cringing acceptance. It makes for better barbecues. Hannah Arendt (in The Origins Of Totalitarianism) observed that “As far as the Jews were concerned, the transformation of the ‘crime’ of Judaism into the fashionable ‘vice’ of Jewishness was dangerous in the extreme. Jews had been able to escape from Judaism into conversion; from Jewishness there is no escape.”

This appalling antisemitism aside, it is absurd to expect no disagreements or disputes within our vast party. People will disagree, sometimes profoundly. Styles differ. Rights do not depend on being likable. Amity is nice, but not if the peace it brings is a well-tended grave in some corner of totalitarian America.

I have worked hard for the Democratic Party of the United States and for the ideals it represents. I have donated more than I could afford, and driven thousands of miles to attend hundreds of meetings, rallies, and conventions. Many of you have eaten some of the hundreds of election-day kolaches I baked at 4am, or served yourself from the gallons of vegetarian posole I have cooked for you.

I deserve better of you. Your neighbors who were not your schoolmates, neighbors who grew up in Chicago or Chengdu, deserve better of you. So does The Democratic Party.

04 Aug 00:02

Farewell to Bowen, Part 1

by Dave Pollard


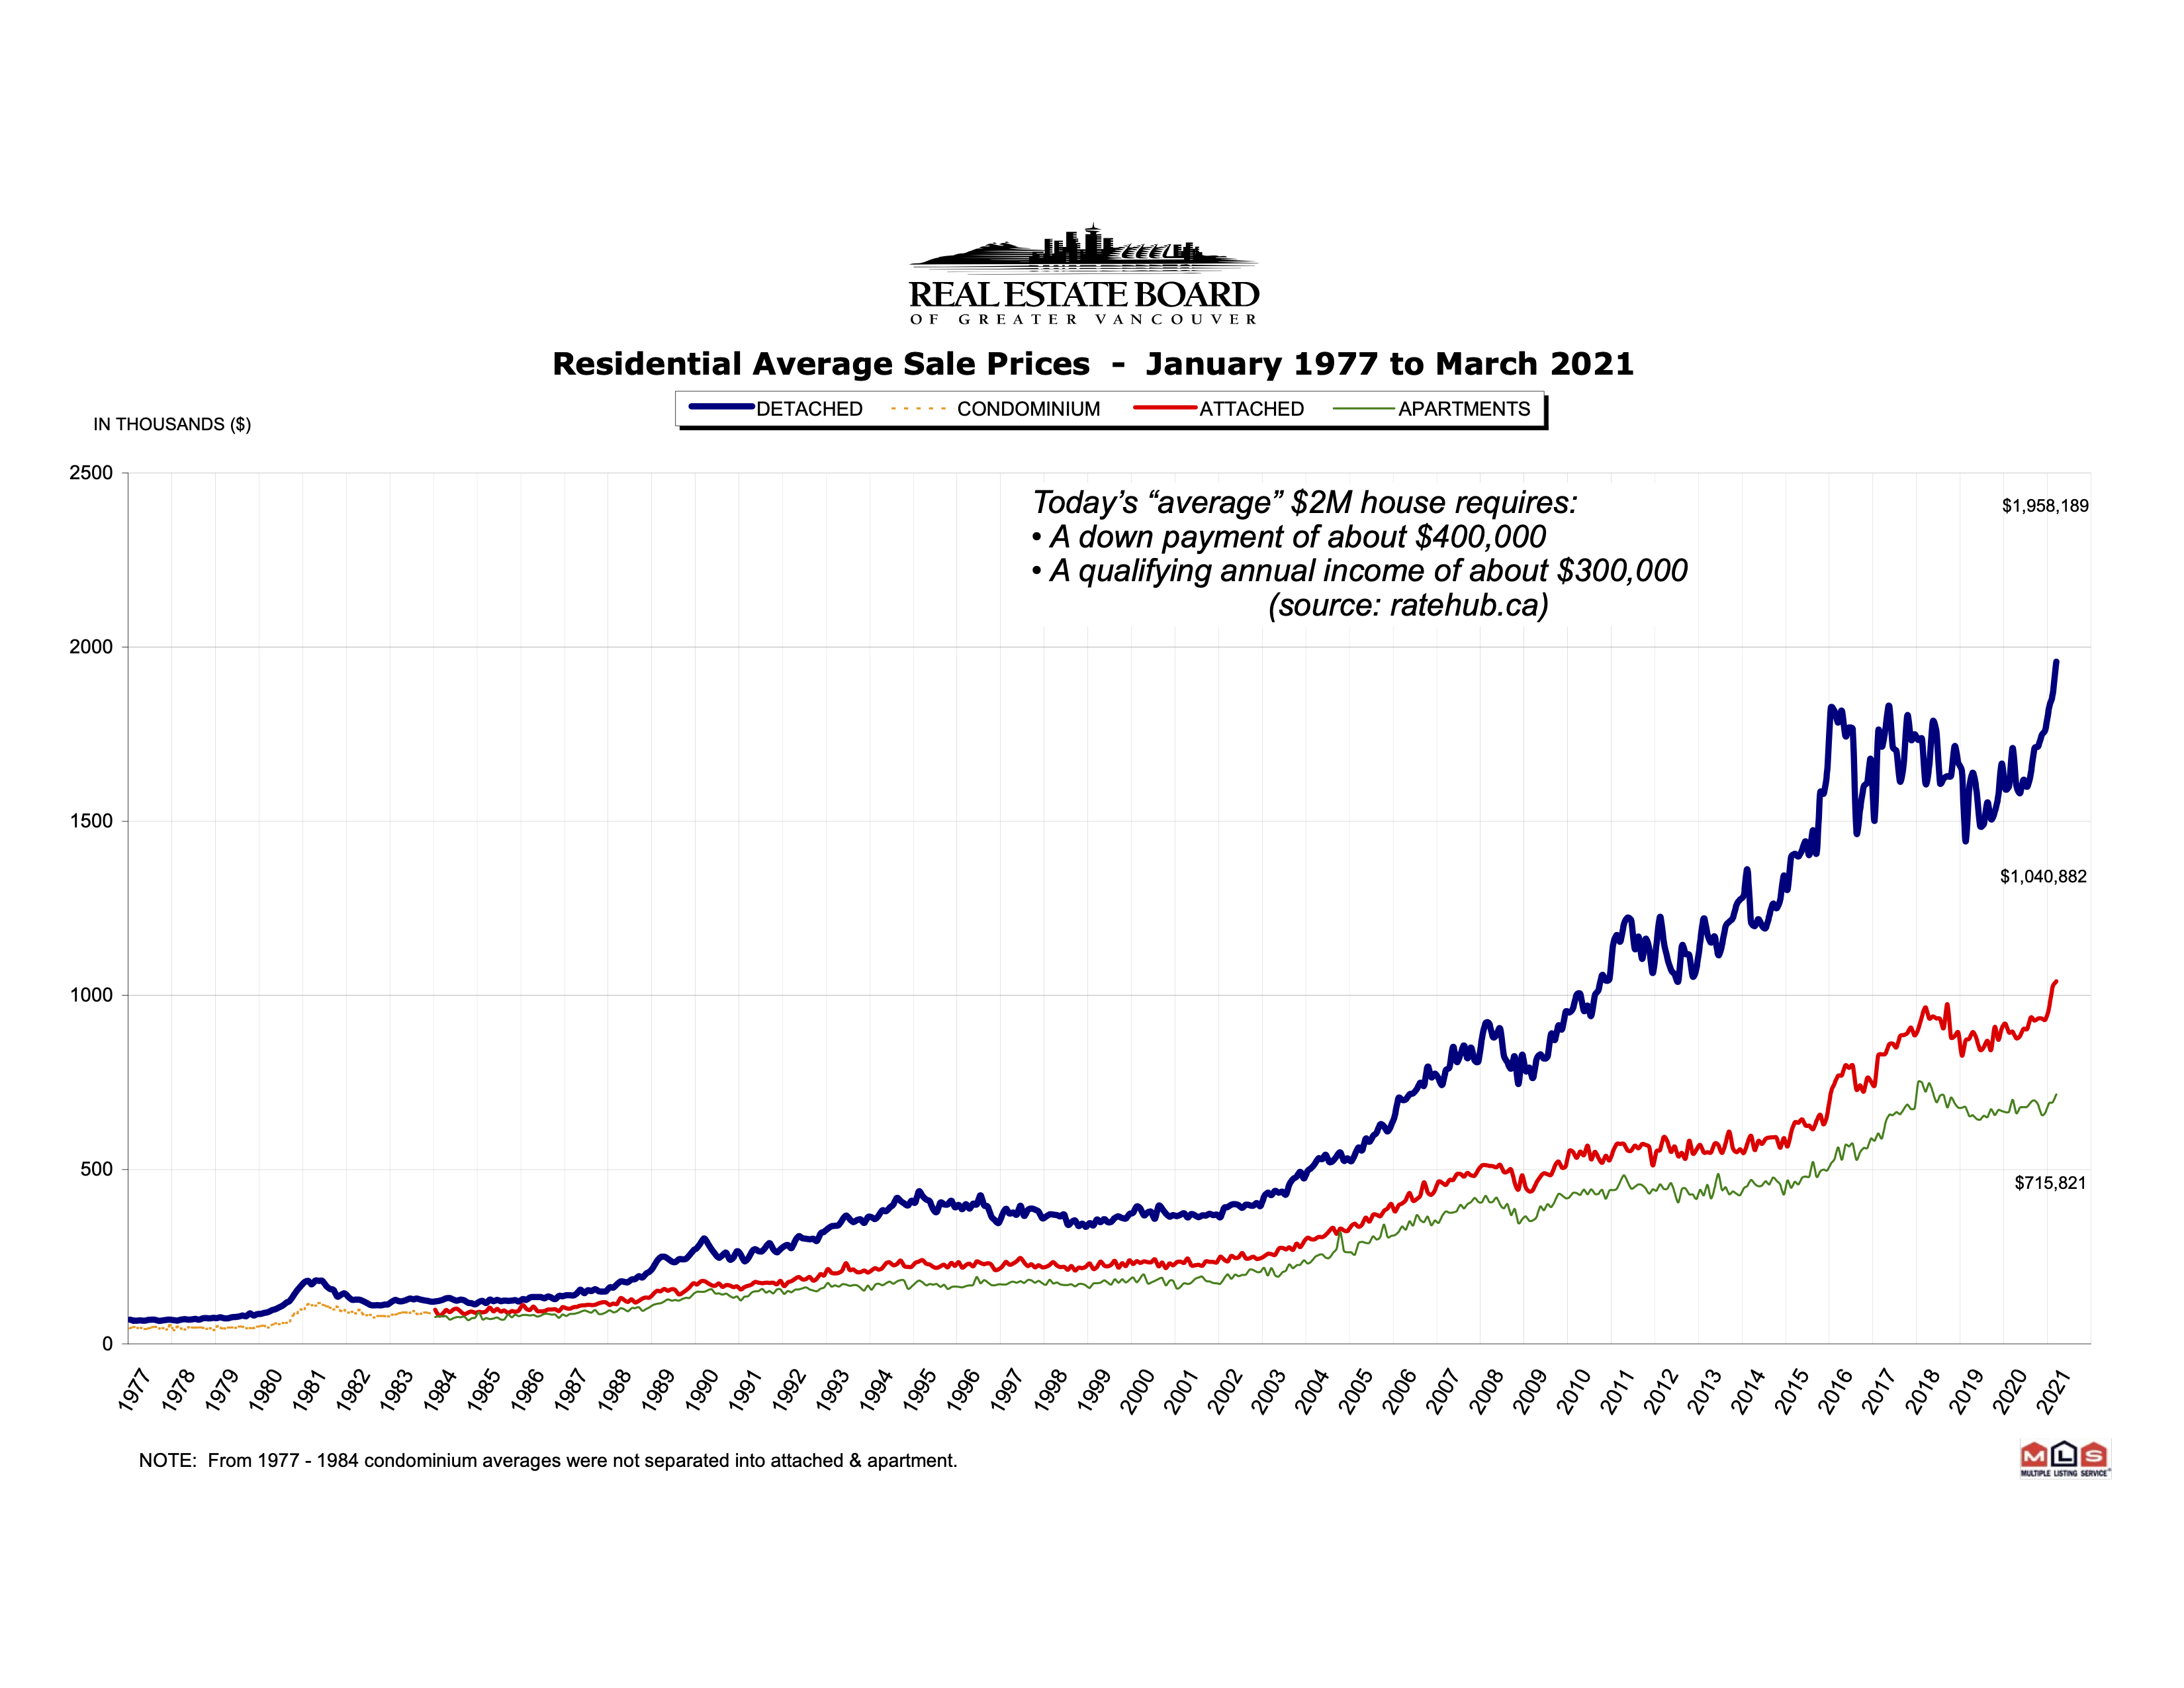
Average home prices in Greater Vancouver. Detached homes now “average” $2M in price. Chart from Real Estate Board of Greater Vancouver.

I wasn’t going to write about this — my departure from Bowen — because I was concerned it would come across as sour grapes. I’m only one of many Bowen Islanders who’ve been forced to leave the island due to a lack of rental accommodations, despite the fact hundreds of ‘vacation homes’ here sit empty much of the year.

I had a good run — nearly 12 years before my luck recently ran out. I’ve been heavily involved in volunteer activities on the island since the very first day I arrived — Chris Corrigan invited me to a “future of Bowen” session he was facilitating that day, where I met Mayor Bob and many of the Bowen peeps who have subsequently become good friends.

I want to stress that what is happening here — haphazard development, housing problems, lack of good local jobs, growing and unmet infrastructure needs, and management by crisis — is happening in the ‘exurbs’ near most of the world’s most desirable cities. And Vancouver is regularly in the top 5 lists of the world’s most desirable cities.

I left Brampton Ontario, a suburb of Toronto, in the 1990s because it had changed in just ten years from a city with 40% of its land in Agricultural Land Reserve (and a mayor and council determined to keep it that way), to a city with no agricultural land at all, an endless, sprawling, ‘discount’ suburban bedroom community with no real industrial/commercial base and hence inadequate budget for sensible urban planning or infrastructure maintenance.

Most of its people were there of necessity — it was the closest place to Toronto, where they worked, that they could afford to live. Many had no real ties to the community, no interest in seeing it flourish, just a determination to keep property taxes as low as possible so they could continue to afford to pay their mortgages and live there. A similar tale has played out closer to home, in the relentless development of urban communities like Richmond, Burnaby and White Rock.


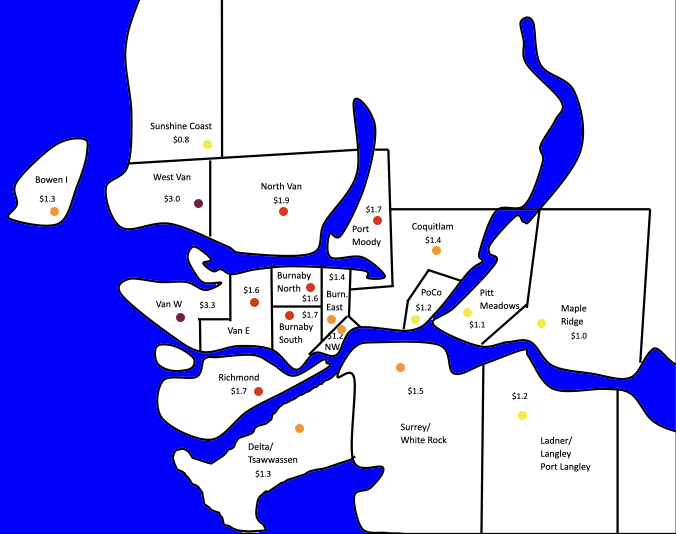
Current “average” detached house price in Greater Vancouver municipalities, in millions of dollars. Purple denotes $3M+, red $1.6-3M, orange $1.3-1.5M, yellow <$1.3M.  Data from from Real Estate Board of Greater Vancouver. 


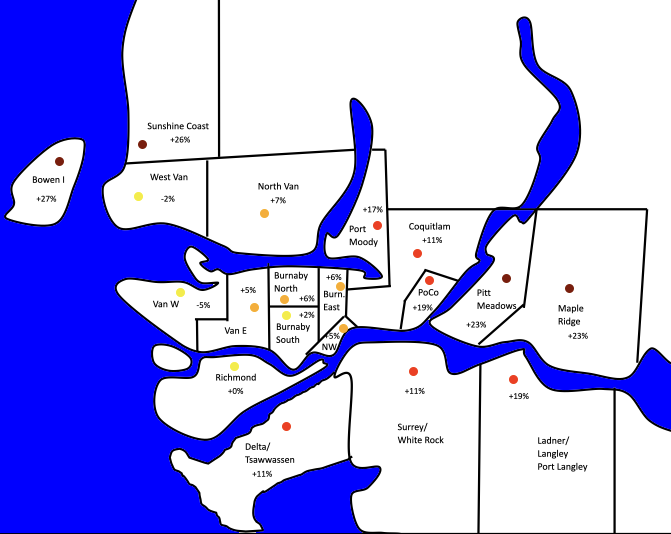
Percent increase 2018-2021 in “average” detached home. Purple denotes increase of >20%, red 11-20%, orange 5-10%, yellow <10% increase over the past three years.  Data from from Real Estate Board of Greater Vancouver.

It’s not that bad on Bowen — yet. But look at the map of housing prices and affordability in Metro Vancouver and the signs are not good — prices in the exurban areas like Bowen and the Sunshine Coast are rising at twice the rate of the rest of the city, catching up to the city in sheer unaffordability for most of the people who work here. There are already signs that those Bowen Islanders whose health and work allows them to live farther from the city are moving ever farther afield, to the Cowichan Valley on Vancouver Island, and to the more distant Gulf Islands.

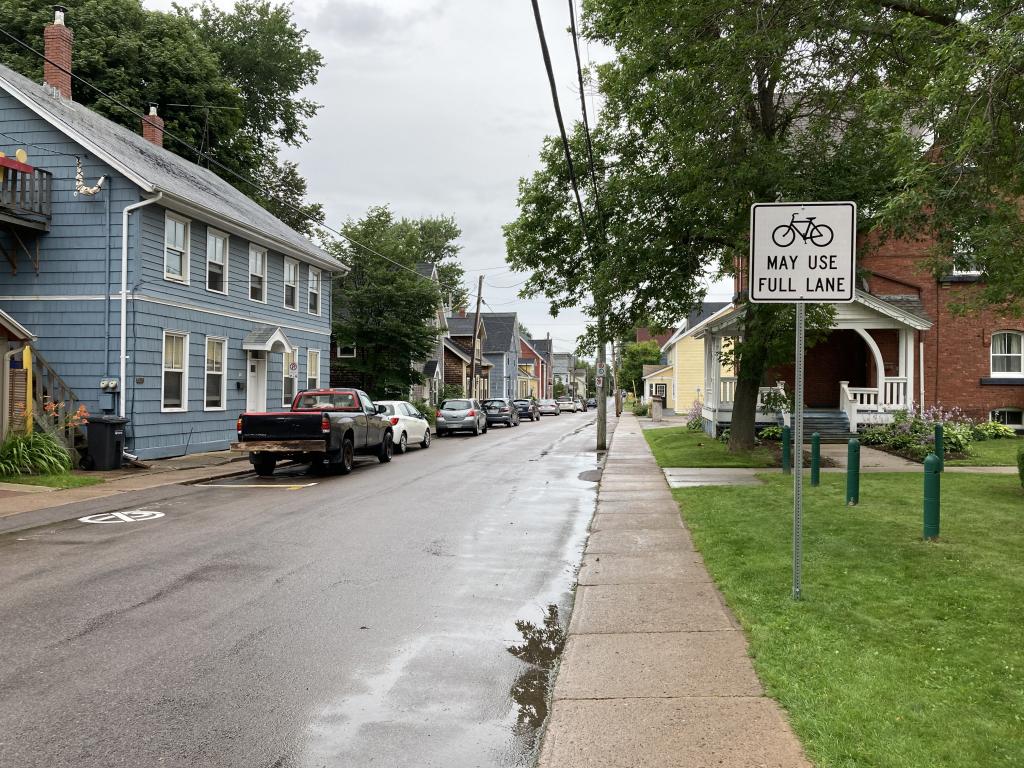
Adding to the challenges of living on Bowen is that the list of needed infrastructure projects for our sprawled-out island, with a total cost that can’t be absorbed by our small population’s residential property taxes, is growing to scary levels, making us more and more dependent on federal and provincial government grants to make up the difference, and adding to the island’s precarity. Water is becoming a critical resource, and there is no money for bike lanes on the roads (cycling on the island is downright dangerous), so the island is increasingly dependent on cars, and of course the ferry to the mainland.

Like many exurbs before us, we are becoming a three-tier community: Here, the top tier consists of the ultra-wealthy with their multi-million-dollar (often second-home) mansions. The middle tier are the exhausted commuters preoccupied with preparing for their next ferry trip, and salvaging the rest of their precious time with their often-young families. And the third tier are the largely-subsistence working class and artists, the ones who spend the most time on-island, and who want to support and expand community amenities, but can least afford to do so financially.

A recent study indicated that Bowen Islanders, compared to our North Shore mainland neighbours, suffer from higher levels of anxiety and stress, and are more likely to be dealing with problems of addiction and illegal substance use. They came, many of them, in search of sanctuary, and now so many are forced to leave.

It’s a recipe for failure, but it’s nobody’s fault, and attempts to blame the Muni government for not “fixing” the problem are ill-founded. The problem is worse, for example, in the SF Bay area, as modest exurban homes there are razed to construct monster homes, driving the working population father and farther out. The situation is similar in exurban Toronto, and in many world cities like London and Sydney.

Rents in Metro Vancouver, like housing prices, have doubled over the last ten years, and only an economic collapse will prevent them doubling again in the next ten, further widening the chasm of inequality that has become a hallmark of this century.

Home-owners who rode the market up, quite a few of whom invested in second and third properties with low-interest mortgages before prices soared, are now mostly renting those extra properties out not as single-family dwellings but as two- or three-family dwellings with newly-constructed separate entrances, to get a decent combined ROI from all their tenants. In the most desirable areas, single-family homes are now mostly rented as “executive homes”, often for $10,000-$50,000/month, to corporations who (unlike us) get to write off the rent as a business expense, and which allows them to provide a perk for their six-to-seven-figure-income visiting execs at the same time. Or rented out as AirBnbs for $350+/night.

This is, of course, an unsustainable situation. Those who have ridden the market up to the point they now own their homes outright will probably be able to stay here, but their new wealth is fragile and only on paper. Their kids won’t be so lucky, unless they move back in with the folks and wait to inherit the family home. But there is a lot of global money looking for beautiful cities to invest in, and that money will continue to push prices up, so that as residents leave or die, there will be only two choices for places like Bowen: Subdivide, turning most of the Cove into multi-family dwellings and possibly Horseshoe Bay-style highrise waterfront condos; or sell out to rich property owners and developers who will tear down the small homes and convert them to luxury accommodations for multi-millionaires.

In my early days on Bowen, I dreamt of a third alternative: The island being declared a model “eco-village”, with severe restrictions on development, the use of conservation development principles, and piloting of projects for local sustainable living that could then be copied by other communities. Or else I thought Bowen might evolve into an artists’ colony of sorts, a creative focal point where artists and crafters of all stripes could meet and collaborate, much as they did in the island’s Lieben days, and where a combination of large-scale public funding for cultural projects, initiatives by studios and arts foundations, philanthropic ventures and new-media arts and cultural institutions would make Bowen a hub for the creative industries, a kind of small-scale Silicon Valley for the right-brained.

But I no longer see these as real alternatives. The fiercely libertarian streak of some of our residents, expressed through their defeating the national park plan in a referendum, their opposition to the “controlled by outsiders” Islands Trust (regional ecological preservation governance body), and their resistance to zoning limitations, suggests we aren’t ready for such a radical vision, or for the sacrifices (both financial, and in the personal ‘freedom’ to do whatever we want with ‘our’ private land) that such a vision would entail.

So we are just kind of flopping up every which way, allowing the market and the zoning variance requests of the moment to dictate much of our dialogue on the future we want. We have a wonderful, aspirational Community Plan, but in the face of development demands it seems to me now a rather toothless document. Chain saws, logging trucks and construction vehicles straining up our hills now often drown out the natural sounds of the island. We can say how many people we’d like to have living on Bowen, the diversity we’d prefer, and the principles by which we’d like them to live, but we really have almost no control over it, and the development pressure will only get worse.

I think we, the citizens of Bowen, really tried to create a better vision, a better model of how to evolve a sustainable, human-scale, somewhat self-sufficient community. But the power ultimately rests with the property-owners and developers, and they have outgunned us at every step. To much of the development industry, ‘underdeveloped’ communities are viewed as just corporate enterprises to be clear-cut, liquidated, squeezed of as much cash as possible, and then, having been sold off to private landowners at the highest possible price, abandoned as attention shifts to the next ‘underdeveloped’ place.

And our backwards provincial government still aspires to log 40% of the island, which only a massive expression of outrage by our community has prevented so far; “we’ll be back in five years” the government timber corporation promised.

The residents of the island have limited power and money to realize any grandiose vision, and therefore I think Bowen will inexorably evolve into some combination of multi-millionaires’ playground, retirement sanctuary (for those pension- and property-rich enough to afford it), and grinding commuter bedroom community. The underclass of workers and artists will be slowly forced out, as mid-six-figure down payments and mid-six-figure qualifying incomes become the only ticket to becoming, and staying, a Bowen Islander. Like so many other exurban communities that are sitting on “the next closest available land for development”, our intentions and dreams will be noble but they are unlikely to be realized. That’s a shame, but no one is to blame — the market forces unwittingly smashing our dreams of exceptionality are relentless, indifferent, agnostic — and global.

What will be a small and bitter consolation for many of us is that, unlike the fools in the Joni Mitchell song, we really do know “what we’ve got”, even before “it’s gone”.

My new home, Coquitlam, has been largely paved already, and developers are now pushing new developments up the mountains and coveting the precious tidal lands to the east — including the world’s largest tidal freshwater lake, home to thousands of wild species. Property-owners in the hills leading up to the area’s gorgeous Crystal Falls have blockaded the trail leading to the falls, on the basis that, as it traverses private property, the public has no right accessing this natural wonder. The government is stymied, apparently hoping the problem will somehow go away.

So it’s the same all over, but at least, for now, there are still places for dreamers like me to rent there.

So I’m off, but I will continue to do volunteer work on Bowen as long as my Bowen peeps will have me. I already sense my continuing presence will be something of a constant nagging reminder of Bowen’s incapacity to hold on to some of its most passionate and diverse residents. But it will unfold as it does. I’m not angry, or surprised, at what has happened.

For nearly 20 years, I’ve been keeping a blog called, with tongue firmly in cheek, How to Save the World. Its subtitle is “chronicling civilization’s collapse”. It doesn’t propose any magical solutions, since I am increasingly convinced there are none. Yet I remain a self-proclaimed joyful pessimist, and I have no regrets. It’s an amazing time to be alive, and all we can do is our best, with what we have to offer, wherever we are.

I will be forever grateful to the people of Bowen Island for making me feel so at home this past twelve years. I salute you, and though I’m leaving, I’m not going away. See you around, my friends.


In Part Two of this “letter”, I want to talk about what it takes to be a real community, in an age when urban areas seem to have only disconnected and anonymous “neighbourhoods” instead. Most of what I’ve learned about community I learned from fellow Bowen Islanders.

04 Aug 00:01

"I’m for truth, no matter who tells it."

“I’m for truth, no matter who tells it.” - Malcolm X
04 Aug 00:01

Focus on what’s in your control

by Volker Weber
04 Aug 00:01

Why aren’t more girls in the UK choosing to study computing and technology? Guest blog post by Peter Kemp

by Mark Guzdial

The Guardian raised the question in the title in this article in June. Pat Yongpradit sent it to me and Peter Kemp, and Peter’s response was terrific — insightful and informed by data. I asked him if I could share it here as a guest post, and he graciously agreed.

We’ve just started a 3 year project, scaricomp, that aims to look at girls’ performance and participation in computer science in English schools. There’s not much to see at the moment, as we started in April, but we’re hoping to sample 5000+ students across schools with large numbers of students taking CS and/or high numbers of females in the CS cohorts. I’ll let you know when we have some analysis in hand.

You reference The Guardian article’s quote: “In 2019, 17,158 girls studied computer science, compared with the 20,577 girls who studied ICT in 2018”. It’s worth noting that the 2018 ICT figure was the end of the line for ICT, numbers in previous years were much higher, and the female figure was actually ~40% of the overall ICT entries, whilst it represents about 20% of the GCSE CS cohort, i.e. females were proportionally better represented in ICT than CS. For a fuller picture of the changing numbers and demographics in English computing, see slide 8 of this, or the video presentation). It’s also worth noting that since the curriculum change in 2012/13 we’ve lost the majority of time dedicated to teaching computing (including CS) at age 14-16, I’ve argued that this has had a disproportionate impact on girls and poorer students (page 45-48).

To add a bit of context from England: Students typically pick 8-10 subjects for GCSE, though their ‘options’ might be limited. Most schools will insist that students take Maths, English Language, English Literature, Physics, Chemistry, Biology, and often: French or German, and History or Geography. This leaves students with one or two actual ‘options’. Many schools are also imposing entry requirements on GCSE CS, only letting the high achieving students (often focusing on maths) onto the course; this will likely have an impact in access to the curriculum for poorer students who are less likely to achieve well in mathematics. Why don’t females pick CS in the same way they picked ICT? This might well be linked to curriculum, role models, contextualisation etc.

One of the reasons given for the curriculum change in 2012 was that students were being “bored to death” by ICT, with ICT generally being the application of software products to solve problems and the implication of technology on the world. The application of technology to the world lends itself to the contextualisation of the curriculum and the assessment materials. There was a lot of project-based assessment with real world scenarios for students to engage with, e.g. making marketing materials for businesses, using spreadsheets to organise holiday bookings etc https://web.archive.org/web/20161130183550if_/http://www.aqa.org.uk/subjects/computer-science-and-it/gcse/information-and-communication-technology-4520) . The GCSE CS is a different beast. It can be contextualised, but this is probably more difficult to do as there is an awful lot of material to cover and the assessment methodology is entirely exam based and on paper for the largest exam boards. Anecdotally we hear of schools cutting down on programming time on computers, as the exam is handwritten.

Data looking at what females ‘liked’ in the old ICT curriculum is quite limited, but what does exist places some of the ‘non-CS’ elements quite highly. So, the actual curriculum content might have a part to play here. Having taught ICT (and CS) for many years, most students I knew really enjoyed the ICT components. I’d argue that the pre-reform discourse around ICT being: “useless, boring, easy”, CS being: “useful, exciting, rigorous” was an easy political position to take, and not reflective of reality where schools had competent teachers. We now find ourselves in a position where we probably have a little too much CS, and not enough digital literacy / ICT for the general needs of students. I and people like Miles Berry (p49) have argued for more generalist qualification which maintains elements of CS. Though there appears to be little political will to make this happen.

To add another suggestions as to why we’re seeing females disengaging, within the English context, we see females substantially underachieving at GCSE in comparison to their other subjects and males of similar ‘abilities’ (ability here being similar grade profiles in other subjects). Why this is remains unclear, we see similar under achievement in Maths and Physics. My fear is that encouraging females to take CS might lead them to having their self-efficacy knocked and therefore make them less likely to pursue further study or a career in tech. We also found that females from poorer backgrounds were more likely to pick GCSE CS than their middle-class peers, we speculate that this might be the result of different cultural/family pressures and a keener engagement with the ’employability’ and ‘good pay’ discourse that often surrounds the representation of studying CS, however true this might be for these groups in reality. More research on the above coming soon through scaricomp.

Additionally, in terms of the UK picture, you’ll probably want to check in with Sue Sentance and the Gender Balance in Computing Project. One of their theories for the decline in computing is that CS is being timetabled at the same time as other (generally) more attractive subjects for females. I’m not sure if they’ve started this part of the research yet, but it’s worth checking in. They are running interventions across the country, but I don’t believe that they are trying to do a nationally representative survey.

03 Aug 23:59

Ch-ch-ch-ch-changes... (and a brief history of Drupal)

by webchick

What the what?!


A crying Druplicon
Sad Drupal is Sad. :'(

Well, might as well get right down to it... I've made the incredibly difficult decision to leave Acquia, and my employment there officially ended last week. :'(

Some important notes about this:

  • This is in no way a negative reflection on Acquia. I have worked with SO many amazing people there in the past 10 years(!), and have endless gratitude for all of the challenges, opportunities, learning, and laughs. The leadership team has a solid strategy, and the effort everyone there puts into achieving it every day is inspiring.
  • This is in no way a negative reflection on Drupal. In my time here, I've seen Drupal through its youthful toddler years, to its surly teenage years, and now Drupal's all grown up, with a nice, stable apartment downtown. :) Drupal is and remains an amazingly powerful, flexible solution for building every single type of application one can dream of, with an incredibly strong and vibrant community behind it.
  • What this is about is about an opportunity that came up to take lessons learned from Drupal and apply them more broadly to (hopefully) make an even bigger impact (more on that below).
  • Also, I'm not leaving the Drupal community (more on that below too), and will stay on as Core Committer/Product Manager, albeit with less time than I used to have to dedicate to it, for rather obvious reasons. (This is ultimately a good thing, as it'll direct that time towards more strategic/impactful endeavours.)

10 years sure is a long time…

It sure is! Here are some fun Drupal facts that help illustrate key achievements of Acquia's Drupal Acceleration Team [DAT] (née Office of the CTO [OCTO]) over the years, and hopefully provide some insight into the areas of investment Acquia has made and continues to make in Drupal.

IMPORTANT NOTE: The folks explicitly called out below are former co-workers who work / have worked at Acquia, since this post is in some ways a "farewell" to them, and an opportunity to celebrate their often unsung efforts. This is unfortunately NOT able to be a comprehensive list of ALL of the amazing people working on various initiatives, because that list would be far, far too long and I'd invariably miss someone. :( Suffice it to say, however, that none of the items listed below would be possible without hard work, input, funding, and help from literally thousands of other people across the wider Drupal community!

Did you know? Back in 2011:

Authoring Experience and Strategic Initiatives


A blog post with hand-typed HTML
Eat your heart out, WordPress! :D

Eas[y|ier] Upgrades


A screenshot of the Drupal 7 contrib tracker website
Tale as old as tiiiiiiime...
  • Drupal 7 had just come out, and the first initiative of the day was to help the community get all of the modules ported to the new version. (Sound familiar? ;)) Drupal Gardens (R.I.P.) was key to this effort, with a world-class team focusing on the biggest, gnarliest modules first. We then repeated that initiative for Drupal 8, for Drupal 9, and, because @Gábor Hojtsy is such an *amazing* overachiever, have already started it for Drupal 10 as well! Ted Bowman (@tedbow) and Katherine Druckman (@katherined) deserve shout-outs for doing a huge ton of Drupal 7 > 8 and Drupal 8 > 9 (respectively) porting in their initial Acquia assignments!
    • To assist with these efforts, OCTO/DAT has also developed numerous pieces of tooling over the years to help make upgrades easier, including:
      • Drupal Module Upgrader (originally an Acquia Hackathon project!), an automated code analysis/porting tool for Drupal 7 -> D8/9 code which @phenaproxima rocked the crap out of as an intern back in the day!
      • Upgrade Status, a dashboard of your contributed modules' porting status that gives you a dynamic "todo" list for major upgrades, which the team has shepherded over the years from Daniel Kudwien (@sun)'s original efforts back in the day!

    Predictability/Reliability


    A troll face that says 'when it's ready'
    Three words to strike fear into any Drupal site admin.
    • In 2011, Drupal releases took the philosophy of "it's ready when it's ready," which made them basically impossible to plan around. Even security releases came out on an unpredictable, as-needed basis, so running a Drupal site required CONSTANT VIGILANCE. :P OCTO/DAT worked with the Drupal Security Team to develop the Wednesday security release windows system we all know today, and also with core contributors to develop the predictable semantic versioning release approach that Drupal 8+ uses. Major kudos go to Jess (@xjm) for making sure those trains run on time, and that they start any fires when they reach the station! :D
    • Another Drupal release philosophy from 2011 was "we'll break your code, not your data". OCTO/DAT has done extensive work, alongside other major community contributors, to enact various policies that ensure Drupal upgrades are easy from Drupal 8 onward.

      Governance


      If you want to go quickly, go alone. If you want to go far, go together.
      I don't have a pithy caption here; this is actually sound advice.
      • Back in 2011, Drupal was very much a "do-ocracy" which meant that it pretended it didn't have a governance structure, which mostly meant that if you weren't already neck-deep in the community to know who everyone was, you were completely in the dark as to which people held key decision making powers. :P We held a Governance Sprint alongside OSCON with mindful community members, as well as various luminaries from other open source projects, and developed an explicit, scalable governance framework for the Drupal Association, for Drupal Core, and for the Drupal Community. Much of that framework exists to this day, and others have evolved as project needs have changed. Alex Bronstein (@effulgentsia) deserves some props here as he's always incredibly thoughtful of structural changes within Drupal and their longer term ramifications.

      Sustainability


      A scale showing one red block balancing three grey blocks.
      The delicate balance...
      • Back in 2011, if you needed a Drupal 7 committer, it was down to either @Dries or me. Over the years, we've built this up to a team of 14 committers, including different specializations in Product Management, Framework Management, Frontend Framework Management, and Release Management. We've also brought onboard a Core Team Facilitator (Pamela Barone (@pameela)) to help with coordinating efforts of the team itself.
        • Another major initiative that falls under this is the Drupal.org contribution credit system, to encourage organizations to donate time back to the project and create more makers than takers.
        • In partnership with the Drupal Association, we created the Drupal 8 Accelerate grants program to bash through the final critical bugs holding Drupal 8.0 from release. The core committer team was in charge of disbursing $125,000 in the form of bug bounties, and directly resulted in Drupal 8.0 shipping in 2015 (without it, who knows :\).

      I'm sure I'm forgetting a million and a half other things that happened over the years, but hopefully this helps paint a picture for those who are newer to the company of how far Drupal has come, and the role Acquia has helped play in that growth.

      What's next?


      MongoDB Logo.
      Webchick is going Web Scale! ;)

      Starting today, I'm going back to my community building roots at MongoDB as Principal Community Manager on the Community Team, focusing on initiatives such as building out an open source contributor program and further awesome-ifying the MongoDB Champions program.

      What drew me to this opportunity is:

      • MongoDB has focused from the outset on stellar developer experience, which is a value I believe in strongly, even since before my time in Drupal. I really appreciate that they take a strong, developer-centered view of how databases ought to work, and that they've tackled so many of the hard problems up-front.
      • Because MongoDB is a technology that is used by tons of other projects, languages, frameworks, etc. it seems like a really great opportunity to both take some of the lessons learned from Drupal over the years and apply them to other communities, while also being able to get a broader perspective from other communities and bring those back into Drupal!
      • The people. While it's really (really!) scary to think about starting out in a new place with new faces, I had the opportunity to interview with folks from a wide cross-section of the company. Every single person I spoke with fully embodied their core values. Every single person was passionate, genuine, kind, and determined to make a huge difference. In a lot of cases speaking to folks felt like speaking to a friend you've had for years.
      • MongoDB has also been a tremendous ally to Drupal (speaking of 10+ years :)), putting funding and time into efforts such as Drupal 7's database abstraction layer, the Views in Drupal Core initiative, and more.
      • From being prompted for pronouns on the initial application form, to a variety of queer/trans-inclusive benefits, to dedicated LGBTQIA+ inclusive initiatives, MongoDB takes their commitment to Diversity and Inclusion more seriously than just about any other tech company I've seen. Colour me impressed!
      • AND, to top it off, they're going to continue to give me dedicated time to work on Drupal as well! :O


      An adorable chihuahua puppy wrapped in a multicoloured scarf.
      Our new chihuahua puppy Arthur wearing the MongoDB Pride bandana, more or less like a cape. :D

      So, fret not! I'll still be around in the Drupal community, hopefully with a broadened perspective and bringing in some new ideas and energy along the way! :)

      Sheesh, what's the TL;DR here?!

      So, in short:

      • I no longer work at Acquia, but want to sincerely thank everyone there for 10+ years of important work, learning opportunities, amazing friends, and of course laughs.
      • A LOT has changed in Drupal over the last 10+ years, and up above you can view a tiny sampling of it.
      • I'm starting a new position at MongoDB today as Principal Community Manager, and am really excited! (And also nervous, but hey. ;))
      • I'll still see you Drupal folk around in Drupal Slack and the issue queue and will still be committing patches. :)
      • MOST importantly, we now have a puppy. ;)

      One last thing: If we've worked together over the years in a Drupal community capacity and if you're up for it, I would be hugely appreciative of a LinkedIn recommendation. And I'll do my best to reciprocate! :)

03 Aug 23:57

The platitude pledge

by Josh Bernoff

Stop imagining that meaningless platitudes are content. Stop sharing them. And stop following or admiring people who use them. What is a meaningless platitude? It is a “truth” so obvious that everyone knows it. When you share one, not only are you failing to generate any insight for your reader, you are communicating that you, … Continued

The post The platitude pledge appeared first on without bullshit.