Rolandt
Shared posts
Questions About TidyBlocks
Project History
Apple TV+ releases first teaser trailer for season 2 of ‘For All Mankind’

Apple TV+ has released the first teaser trailer for the upcoming second season of its original TV show ‘For All Mankind.’
The second season of the alternate history sci-fi series imagines a reality where the Soviet Union beat the United States to the moon, and that the space race never ended.
The trailer indicates that the season is going to pick up right where it left off in the first season, which premiered last year in November. The teaser features a narration of an actual speech made by former U.S. president Ronald Reagan.
It teases conflict between the two countries as they prepare to race to the moon. The trailer does not reveal a release date for the second season, but it’s possible that it will air sometime this year.
An Apple TV+ subscription costs $5.99 CAD/month in Canada.
The post Apple TV+ releases first teaser trailer for season 2 of ‘For All Mankind’ appeared first on MobileSyrup.
HOWTO: Create radically smaller images for your minimalist blog
Inspired by Low-tech magazine’s solar powered website, I searched the web to find out how to create a ‘stippled’ effect for images. This reduced the size of an 2.2MB image to a mere 30.6KB, which if I’m not mistaken, is a reduction in filesize of over 95%! Here’s how to do it, using free and open source software.

0. Download and install GIMP (GNU Image Manipulation Program)
1. Open the image you want to convert in GIMP
2. Resize the image to the maximum width of your blog (~600px in my case) by going to the Image menu and then to ‘Scale Image…’
3. Convert the image to greyscale by going back to the Image menu then Mode and selecting ‘Greyscale’
(optional step: wash out the image by going to the Colours menu then Levels and change the number in the box under ‘Output levels’ to 180)
4. Convert the image to indexed colours by again going to the Image menu then Mode and this time selecting ‘Indexed…’
In the box that appears:
- Under Colourmap choose ‘Use black and white (1-bit) palette’
- Ensure box ‘Remove unused and duplicate colours from colourmap’ is checked
- From the drop-down Colour dithering option choose ‘Floyd-Steinberg (normal)’
- Press the Convert button
5. Export the image by going to the File menu and selecting ‘Export As…’ In the box that appears, type in a filename that ends in ‘png’ (e.g. image.png)
This post is Day 16 of my #100DaysToOffload challenge. Want to get involved? Find out more at 100daystooffload.com
Your Mid-Year Leadership Check-in
A satisfying aspect of the new book was I achieved the intended goal of providing actionable advice. After a brief introduction, I list the 30 specific practices you can start with today to improve different aspects of leadership. I then go onto to tell the story of how I discovered or refined that practice.
The reason this is satisfying is so much leadership advice is “it depends” advice. I’ve learned this during the Q&A sessions after a talk. I’ve just finished a 30-minute speech, and you stand up in front of 499 audience members and ask me a zinger. It’s a good synthesized question. It’s on topic. It’s specific, and about ten words in, I can tell it’s an “it depends” question.
The types of situations you’ll encounter as a leader are as varied as the humans who build them. Yes, your question strikes a familiar chord with me, but with that familiarity comes the experience that informs me that unless I understand the specifics of the situation, the value of my advice is suspect.
But I have to say something, so my advice moves to the abstract with the hope that if I describe the general problem space with equally general approaches that you’ll take those generalizations, combine them with your knowledge of the specifics of the situation, apply good judgment, and find a productive path forward.
High-level hard-earned advice and well-intentioned generalizations threaded through a good story were the first two books’ approach. I wanted to get you thinking about a problem space, and with that in mind, let’s pivot to your mid-year check-in.
It’s halfway through the year. We remain in unknown territory for most leaders as many of us continue our month-long work-from-home pandemic set-up. For me, I spent months thinking, “This is temporary. Don’t get used to it.”
I’m used to it. This isn’t temporary. It’s time to start thinking of how you will move forward as a leader in these strange times. To get you thinking about this problem space, I present ten questions.
- Are you a manager, manager of managers, or manager of directors?
-
How long have you been in that role? The prior role?
-
When was your last promotion, and what was your internal headline for that promotion? (Example: “Reliable manager finally gets the promotion to a senior manager after the successful release of X.”)
-
Who are your credible sources of actionable feedback? What the most recent memorable feedback from one of these sources? Why was it memorable?
-
What are your areas of strength? How do you know that?
-
Where are you focusing on improving your leadership skills? Why?
-
Have you identified your next role? If so, what is it, and what’s your current plan to get there?
-
What’s your current most significant challenge with your direct reports? (A specific issue with one of your directs or an overall issue with all/many)
-
What’s your current most significant challenge with your manager?
-
What do you want to be when you grow up?
While I am intensely curious about your answers to these questions, that is not the point. These questions are designed to show you at least one essential truth about your current leadership role. What are you going to do with that truth?
It depends.
Twitter Favorites: [f3ndot] Strava ya did me dirty. Lakeshore Road from Toronto to Oakville is ridiculously not cyclist friendly 😭

Strava ya did me dirty. Lakeshore Road from Toronto to Oakville is ridiculously not cyclist friendly 😭
Week Notes 20#30
A pretty regular week, although my day rhythm wasn’t as steady as I wanted. Slept in a few times (meaning 7 or 8 am).
This week I
- Did part of the bookkeeping for Q2, as tax returns are to be submitted next week
- Looked into my company’s LimeSurvey instance, and wrote a document describing our information security measures around it, for a client
- Worked my way through some old presentations I gave, to take out the ideas and concepts and put them into notes
- Paid the salaries for our team
- Had an extended confcall discussing macro-economic effects of open data, for the EU study we’re invovled in.
- Worked with the director of an NGO I’m chairing to transfer their work as they leave for another position, and discussed a few applicants for the position
- Had an almost 2 hour conversation with Boris Mann, which we recorded to see if we want to publish it, discussing stuff that interests us both.
- Discussed how to bring in general change management notions, information ethics considerations, and a much broader view of data governance than usual into the process and vocabulary of the digital transformation team of a client
- Created some slides for a workshop next week, but found it harder to do the second part of those slides, so that’s the first thing for coming week
- Cycled into town with the three of us, just to see the city and people going about their own lives.
- Went out for dinner with the three of us Saturday evening.
This is a RSS only posting for regular readers. Not secret, just unlisted. Comments / webmention / pingback all ok.
Read more about RSS Club
Almost ICEd in O’Leary
Oliver and I went West today, and when my own foolishness resulted in a putative EV charge in Foxley River going awry, we fell back on Plan B, making it, with 18 km range to spare, to the new Efficiency PEI fast charger at the Tim Hortons in O’Leary.
All of the parking spaces with easy access to the charger were occupied by drivers of gasoline-powered cars who paid the EV charger no heed. Fortunately I was able to manoeuvre close enough on the back side to get the cable to reach and the day was saved.
 ,
, 
“I have killed the headlights and put it in neutral.”
Jessica Spengler, writing in her plague journal:
I’m just idling right now. I have killed the headlights and put it in neutral. I’m not looking ahead, not speculating, trying not to worry, trying not to get frustrated. I am making do, making the best of the situation, and making merry when I can. And I am not making plans.
That paragraph happens to come very close to describing what it was like supporting Catherine through 5 years of living with incurable cancer.
Which might explain why, relatively speaking, pandemic life, while not a walk in the park, hasn’t slayed me: I’ve developed mad skills in a realm of coping that’s conveniently become globally relevant.
What is software design?
I've never been satisfied with the standard definition of 'software design'. Is the term useful? What could it mean that is useful? In this episode, I talk about some definitions that I don't agree with and explain my definition.
The post What is software design? appeared first on LispCast.
How to Upload Your Bike Rides to Strava While Garmin Connect is Down
 Since early on 23 July, Garmin Connect has been down. This post explains how to continue to upload your bike rides to Strava while Garmin Connect is not working.
The post How to Upload Your Bike Rides to Strava While Garmin Connect is Down appeared first on Average Joe Cyclist.
Efron Updates breiman’s “two cultures” essay
The June 2020 issue of JASA features a highly insightful essay by Brad Efron, dean of the world’s statisticians. The article is accompanied by commentary by a number of statistical luminaries. Important, indeed central questions are raised. I would hope JASA runs more pieces of this nature.
The essay may be viewed as an update of the classic 2001 article by Leo Breiman, regarding two largely separate cultures, statistics and machine learning (ML), updating not only in the sense of progress made since 2001, but also in the divide between Prediction and Description (“Attribution”) goals of regression analysis. (I of course use the latter term to mean estimation of E(Y | X), whether parametrically or not.)
I’ll provide my own commentary here, and, this being a statistics/R blog, bring in some related comments on R. I’ll have two main themes:
- The gap between the two cultures is as wide today as ever.
- There are fundamental problems with both cultural approaches, with a lot of “the emperor has no clothes” issues.
Parametric vs. Nonparametric Methods
Note carefully that the cultural difference is NOT one of parametric vs. nonparametric methods. For instance, statisticians were working on k-Nearest Neighbors as far back as the 1950s, if not earlier. Tree-based methods, notably random forests, were developed largely by statisticians in the 1970s, and arguably the best implementations are in R, the statisticians’ language, rather than Python, the MLers’ language.
Sampling Variation
Instead, I believe the widest gap between the two cultures involves sampling variation. It forms the very core of statistics, while ML mostly ignores it. I’ve observed this over the years in writings and statements by ML people, and in conversation with them.
This was exemplified in a recent Twitter exchange I had with a prominent ML researcher. I’d lamented that ML people don’t care about sampling variation, and the ML person responded, “What about causal models? Sampling variation is not an issue there.” But of course it IS an issue, a major one. Is the causal effect one seems to have found real, or just a sampling accident?
By the way, this extends to the research level, resulting in statistical work often focusing on asymptotics, while in ML the focus is on proving finite inequalities about the data itself, no connection to a population.
Frankly, I find that ML people just don’t seem to find statistics relevant to their work, and often don’t know much about stat. For example, in a book written by another prominent MLer, he recommends standardizing data to mean-0, variance-1 form before performing neural network analysis. Indeed, for reasons that seem to be unknown, this is mandatory, as the method may not converge otherwise. But I was shocked to see the MLer write that standardization presumes a Gaussian distribution, which is certainly not true.
R vs. Python (and R vs. R)
As noted, statisticians tend to use R, while ML people almost universally use Python. This in turn stems from the fact that ML has basically become a computer science field. Python is common, virtually standard in CS coursework and much of the CS research, so it is natural for MLers to gravitate to that language. R, of course, has been the lingua franca of stat.
That’s all fine, but it is adding to the cultural gap, to the detriment of both camps. Years ago I wrote, “R is written by statisticians, for statisticians” and that R is Statistically Correct. Sadly, in my view the Python ML software doesn’t meet that standard, which again stems from the general lack of statistical expertise in ML. On the other hand, there are a number of “full pipeline” packages in Python, notably for image classification, with nothing comparable in R.
To their credit, JJ Allaire of RStudio and Wes McKinney of the Python world have worked on tools to “translate” between the two languages. But I’m told by a prominent R developer that there is resistance on the Python side. Hopefully this will change.
Meanwhile, R itself is undergoing its own cultural split(s). On the language level, there is the base-R vs. Tidyverse split. (I consider the latter to be taking R in the wrong direction). But beyond that, a large and growing segment of R users see the language only as a tool for data wrangling (e.g. case filtering) rather than statistics. It should be viewed as both, and the lack of such a view will be problematic for stat users in the coming years, I believe.
“The Emperor Has No Clothes”
There are serious problems within each of the two cultures. So far, analysts have succeeded in blithely ignoring them, but I worry that this can’t continue.
Heavy use of cross-validation:
Efron notes, “A crucial ingredient of modern prediction methods is the training/test set paradigm…” This is combined with grid search to find the “best” combination of tuning parameters. (Called hyperparameters in the ML field. ML has its own terminology, e.g. inference for what stat people call prediction. Yet another cultural divide.)
For some ML methods, the number of tuning parameters can be large, and when combined in Cartesian product with many values for each one, we have a very large search space. That in turn raises a simultaneous inference problem, colloquially known today as p-hacking. The parameter combination that appears best may be far from best.
The fineTuning() function in my regtools package computes Bonferroni (Dunn) intervals for the various combinations as a way to partially deal with the problem. It also features a graphical exploration tool.
Similarly, some of those dazzling results from ML methods in competitions need to be taken with a grain of salt. There presumably is a p-hacking problem here as well; different contestants keep trying various parameter values and algorithm tweaks until they get a better value — whether by genuinely better technique or by random accident. A probability record-values analysis would be interesting here. Also see the impressive empirical findings in Rebecca Roelofs’ dissertation.
Smoothness assumptions:
To me, the most interesting, thought-provoking part of Efron’s essay is the material on smoothness. But it brings to mind another “emperor has no clothes” issue.
The fact is that in real life, there is no such thing as smoothness, since all measurements are discrete rather than continuous. At best, human height is measured, say, only to 0.2 centimeter and air temperature to, say, 0.1 degree. Hence there are not even first derivatives, let alone higher-order ones. This calls into question stat theory (“Assume a continuous second derivative…”), and more importantly, any formulaic (as opposed to aesthetic) method for choosing the smoothness of a fitted curve.
Overfitting:
Classic parametric theory has results along the lines of needing p = o(sqrt(n)) to obtain consistent estimates. There are various nonparametric results of this nature. There are more recent results regarding p > n, but with conditions that are typically unverifiable.
On the ML side, adherents have shown a number of successes in which p >> n. A typical “optimal” neural network may, after all the dust clears, have tens of millions of parameters (hidden-layer weights) with n only in the tens of thousands. Some NN specialists have even said overfitting is actually desirable. Yet, to my knowledge, there is no theoretical justification for this. (Efron notes this too.) Is it true? Or is there something else going on?
Neural networks as black boxes:
For that matter, what makes NNs work anyway? Efron describes them as “essentially elaborate logistic regression programs.” With a sigmoid activation function, and with the understanding that logits are composed together rather than, say added, that is true. However, in our work we show something more basic: NNs are essentially performing good old-fashioned polynomial regression. This has practical implications, e.g. that multicollinearity among the layer outputs increases from layer to layer. (We also have a corresponding R package, polyreg.)
“Rectangular” data:
In recent years, it has been found that for most applications, NNs will not do especially well, unlike their succeses with image classification for instance. Out of this has come Conventional Wisdom statements like, “For rectangular data, you may do better with non-NN methods.”
But upon closer inspection, one sees this particular “emperor” to be especially unclothed. Consider the famous MNIST data, consisting of 65,000 28×28 images. One can store this is a 65000 x 784 matrix (2ix28 = 784). In other words, n = 65000 and p = 784. Isn’t that rectangular? One prominent MLer uses the term perceptive data instead. That is not a satisfying explanation at all, nor, as noted, is the “rectangular” one.
So, are image and natural language data, putative areas of excellence for NNs, really different from all other areas? This seems unlikely. Instead, the likely explanation is that enormous efforts were expended in these areas, and NNs happened to be the tool that was used. Indeed, some researchers have taken the outputs of convolutional layers (which are just classic image operations), and run them through SVMs, obtaining results equal to or better than NNs.
So, what do we have? This discussion brings to mind an old paper, delightfully titled “What’s Not What What in Statistics.” There is so much more than could be added today.
Proposal #2 to Change CS Education to Reduce Inequity: Make the highest grades achievable by all students
What does an “A” mean in your course? The answer likely depends on why you teach. Research on teacher beliefs suggests that grading practices are related to teachers’ reasons for teaching. Joe Feldman points out that our grading relates to who we are as teachers, and it is passionately held:
Conversations about grading weren’t like conversations about classroom management or assessment design, which teachers approached with openness and in deference to research. Instead, teachers talked about grading in a language of morals about the “real world” and beliefs about students; grading seemed to tap directly into the deepest sense of who teachers were in their classroom.
Feldman, Joe. Grading for Equity (pp. xix-xx). SAGE Publications. Kindle Edition.
I’ve used the Teacher Perspectives Inventory (TPI) (see link here) with dozens of CS teachers. The most common teaching perspective I see among CS teachers is “Apprenticeship.” CS faculty see themselves as preparing future software developers. They value demonstrating and modeling good software practices. An “A” for an apprenticeship teacher is likely to indicate that the student produces good code. An “A” is reserved for “excellence” (as one CS teacher told me recently). An “A” indicates that the student has risen above his or peers in producing “high quality products” (as another CS teacher posted on Facebook recently). An “A” means that, in this teacher’s opinion, the student is recommended to go on to a highly-desired software development job, perhaps at a place like Google or Amazon.
A student with less computing background is much less likely to earn an “A” in an Apprenticeship-oriented class. If you bring more experience to the table, you have a head start on producing higher-quality products than other students in the class. Their products are more likely to be marked as “excellent.”
In my opinion, the teacher attitude of “rugged individualism” defined in SIGCSE 2020 paper by Hovey, Lehmann, and Riggers-Piehl “Linking faculty attitudes to pedagogical choices” meshes with the TPI category of “Apprenticeship.” “Rugged individualism” teachers believe that “learning and success are the individual student’s responsibility.” (Hovey et al did not make this claim or compute the correlation — this is my prediction.) They showed that teachers who believe in “rugged individualism” are less likely to use student-centered teaching practices and more likely to lecture. Students with less computing background do better with student-centered teaching practices.
This is my third post in a series about how we have to change how we teach computing to reduce inequity (see last post). The series has several inspirations, but the concrete one that I want to reference back to each week is the statement from the University of Maryland’s CS department:
Creating a task force within the Education Committee for a full review of the computer science curriculum to ensure that classes are structured such that students starting out with less computing background can succeed, as well as reorienting the department teaching culture towards a growth mindset
The style of grading that means to identify “talent” or “excellence” is inherently inequitable. It presumes a fixed mindset. If you believe that there is a random distribution of “talent” or “ability” or “Geek Gene” in the course, and (critically), there’s nothing much that teaching can do to change that, then it makes sense to grade to the curve. There can be only a few “A” slots, more “B” slots, and so on. Empirical evidence suggests the opposite — good teaching can trump a lot of other factors. Belief in a growth mindset leads to better learning outcomes and better performance. If we value teaching, and believe that students can get better at computer science, then over time, we should teach better and students should learn more. If students learn more, they should get a higher grade It’s not a fixed-result game.
Measure learning or progress towards objectives, not code quality
My teacher perspective is that we are in the job of maximizing individual human development. It’s our job to help each student achieve as much as they can within our discipline. We should measure achievement in terms of learning, not product quality. I tend to align with the “nurturing” perspective on the TPI, but that’s not what I’m going to argue for here.
It is not at all the same thing to grade for excellence and to grade for learning. Writing code isn’t the same as learning. We have evidence that writing a given piece of code is not indicative of understanding that piece of code. The recent ITiCSE 2020 paper by Jean Sala and Diana Franklin showed that use of a given code construct was not correlated well with understanding of that code construct (see paper here).
I mentioned in the last post that I’m reading Grading for Equity by Joe Feldman (see his website here). He points out all the other factors that influence grades that have nothing to do with learning. Some of these extra-curricular factors — like the ability to meet deadlines that presume privileged, full-time student status without outside pressures — are less likely for Black, Hispanic, poorer, or first-generation college students. These factors influence the production of high-quality code even more than they influence learning. These pressures are going to be even greater during a time of a pandemic.
We should give grades depending how much is learned in a given course. That’s hard to do without measuring students as they enter the course and as they leave the course, and grading on the delta. There is a movement suggesting that “labor-based grading” leads to more compassionate and equitable grading (see article here). I’m not arguing for that.
State your criteria clearly and be objective in grading
I’m arguing that we aim for a Teaching Perspective most closely aligned with the one called “Transmission.” The goal of a Transmission teacher is for students to learn what is needed for the next course or to meet the course objectives. Assessments of understanding should be as objective as possible. Grades should represent achievement of the learning objectives and nothing else.
There is a lot in any given CS course that is not about preparing students for the next course in the sequence. We cover a lot of material. In some courses, we’re preparing students for the imagined technical interview with Google or Amazon. That’s not fair to require understanding and performance on standards that go beyond the course objectives.
I recommend setting the objectives clearly, announcing them on the first day, and grading to those. It’s okay to aim for the targeted average on each assignment to be low but passing (e.g., a “C”), as long as you’re clear and fair. In my classes, I rely heavily on weekly quizzes because those are more likely to lead to learning (see post here). I give points for writing code, but that’s to encourage the activity, not to make-or-break the students’ grade. Programming is for learning, and the quizzes, midterm, and final exam are assessments.
Go ahead and bore your best students
Students with a lot of computing background get an easy “A” in my courses. That’s fine. I expect that. I explicitly tell my students that I teach to the bottom third of the course. I want to move B and C students up into A’s and B’s. I give out a lot of A’s. In years past, I did a series of blog posts on “Boredom vs Failure” (here’s the first post in the series, and here’s the last one). The question is: which is worse, to bore and give easy A’s to the most privileged and most prepared students, or to fail (or discourage to the point that they drop) the students with less privilege and the least computing background? Think about the students who might fail or drop out in a system that makes sure that the most well prepared students are challenged. Each one of those students who continues on does more to change the status quo than does keeping the more privileged students from getting bored. Helping the students with less computing background succeed makes a much bigger difference for society long-term than does keeping entertained the most privileged students.
One response to this proposal is that I’m degrading the value of past A’s. The A’s don’t mean the same thing anymore. That’s true. I take a historical perspective. Those A’s were earned when the students with less computing background were not being taught with methods that helped them succeed (Proposal #1). Those A’s were earned in unfair competition, where the students with prior computing background were compared to students with less computing background. I’m proposing a more just system where the students with less computing background have a chance at the highest grades, where they’re taught in ways that meet their needs, and where their teachers believe that they can grow and improve. I’m not particularly concerned about preserving the past glories of those who won in an unjust system.
If we pre-allocate, ration, or otherwise curve “down” grades so that the top scores are a scarce resource in a competitive system, we are privileging the most prepared students and disadvantaging the least prepared students. I am proposing differentiated instruction. Teach explicitly for the least-prepared students. You will likely have to give up on pushing your top students to greater excellence — that’s the kind of privilege which we have to be willing to surrender. Aim to help every student achieve their potential, and if you have to make a choice, make choices in favor of the students with less privilege and less computing background.
You can now play the original Doom on Windows 95 in Minecraft

Minecraft is a game that’s all about letting you build virtually anything that you want.
Given that conceit, then, shouldn’t you be able to build a computer with Windows 95?
That’s the idea behind a new VM Computers mod for Minecraft through which players can order in-game computer parts to build a computer that can run, among other operating systems, Windows 95. What’s more, you can actually play the original Doom on said PC.
I played DOOM in Minecraft with VMComputers mod. from r/Minecraft
How it all works is that the mod leverages the free open-source virtual machine software, VirtualBox to run OSes. From there, place a PC case block and then use it to create virtual hard drives to install operating systems from ISO files.
With this mod, Minecraft fan DrunkMate has been able to get the classic first-person shooter up and running.
However, given time, it’s likely that even more games will become playable. The big question is: will people go full Xzibit and make Minecraft playable within Minecraft?
Via: Windows Central
The post You can now play the original Doom on Windows 95 in Minecraft appeared first on MobileSyrup.
Here’s what a revamped iPad Pro-like iPad mini with Face ID could look like

While Apple hasn’t yet revealed a new iPad mini, rumours indicate it could come later this year or early 2021.
In the meantime, designer Parker Ortolani has come up with a concept of what the new iPad mini could look like.
more of the teeny tiny iPad mini concept pic.twitter.com/cjPzIDLHo4
— Parker Ortolani (@ParkerOrtolani) July 24, 2020
Specifically, Ortolani’s iPad mini shrinks about 20 percent from the current model while adding the design language of the modern iPad Pro. Based on his version, the tablet would have the same 7.9-inch display but have significantly reduced bezel sizes and sport Face ID instead of Touch ID.
For context, often-accurate Apple analyst Ming-Chi Kuo has suggested that Apple’s new iPad mini would have a larger display than the current model and release in the first half of 2021. That said, Ortolani’s concept shows at least one other way the iPad mini could look.
In any case, it will be interesting to see what Apple ultimately goes with, given that the last iPad mini update came in 2019.
What do you think about Ortolani’s design? Sound off below.
Via: 9to5Mac
The post Here’s what a revamped iPad Pro-like iPad mini with Face ID could look like appeared first on MobileSyrup.

Doing Stupid Stuff with GitHub Actions
Doing Stupid Stuff with GitHub Actions
I love the idea here of running a scheduled action once a year that deliberately fails, causing GitHub to send you a "Happy New Year" failure email!
Via Hacker News
Boris Johnson tried to take a one year anniversary lap of honour yesterday. He moved house, his partner had a baby, he ‘delivered’ a Brexit he’s desperate to disown, he went on holiday just as the virus bit, he presided over tens of thousands of deaths. Swings & roundabouts, eh?
 |
mkalus
shared this story
from |
Boris Johnson tried to take a one year anniversary lap of honour yesterday. He moved house, his partner had a baby, he ‘delivered’ a Brexit he’s desperate to disown, he went on holiday just as the virus bit, he presided over tens of thousands of deaths.
Swings & roundabouts, eh?

3592 likes, 541 retweets
Being an Effective Engineering Leader
I often wonder if I’m being effective at my job. Might be related to my impostor syndrome, but in engineering management, the signals of effectiveness aren’t always clear. I have some basic, high level criteria I try to think about monthly, or so, to provide some insight.
Providing a clear direction
Lack of clear direction can sometimes be seen when teams are doing medium-term/quarterly planning. If the objectives aren’t aligned with upper management, it’s probably my fault for not creating clear direction and expected outcomes. Try not to be too prescriptive, but make sure the goals are clearly defined.
Try to have a good narrative for each of these levels:
- Vision: How the team(s) create impact
- Mission: Role the team(s) within the company
- Objectives: Think about the next year
Shipping what matters
Do the same problems keep coming up? Make sure we are prioritizing the right work. Make sure we are completing the work. Talk to senior engineers about problems that seem to be holding us back.
Focus on capabilities. Keep improving the operational capabilities of the company. Feature projects are built on capabilities.
Maintain a healthy mix of project sizes. Big projects can stall shipping momentum. Make sure big projects are broken into smaller milestones and iterations. Small projects might feel like low impact, but sometimes are just what people are asking to see.
Helping people grow
Have honest conversations about expectations and performance, and providing actionable feedback.
Make space for other people by getting out of the way. For projects and meetings where I’m getting invited as a point-of-contact, look for other people I can delegate the role to.
Surveys and Feedback Loops
Workplaces typically have company-wide engagement surveys to get feedback on many aspects. Those usually have a management section, and this feedback can be a gift. Interpreting feedback in a positive a way and not a personal attack might be a learned skill, but worth learning.
Thanks to Nick DiStefano for a reminder that manager surveys are also a useful way to get regular feedback on how things are going. Manager surveys can happen more frequently than company-wide engagement surveys and are usually more focused at the team-level.
On Liberating My Smartwatch From Cloud Services
I’ve often said that if we convince ourselves that technology is magic, we risk becoming hostages to it. Just recently, I had a brush with this fate, but happily, I was saved by open source.
At the time of writing, Garmin is suffering from a massive ransomware attack. I also happen to be a user of the Garmin Instinct watch. I’m very happy with it, and in many ways, it’s magical how much capability is packed into such a tiny package.
I also happen to have a hobby of paddling the outrigger canoe:
Paddled around the island of Hong Kong in an outrigger canoe “change race” for the 2018 #RHKYCATIR event! Stunning coastline and an unbeatable harbor view. Impressed at how @RHKYC pulled it off even after the typhoon devastated a lot of their equipment.
Thanks for hosting! pic.twitter.com/ECh9nQHDVt
— bunnie (@bunniestudios) November 6, 2018
I consider the GPS watch to be an indispensable piece of safety gear, especially for the boat’s steer, because it’s hard to judge your water speed when you’re more than a few hundred meters from land. If you get stuck in a bad current, without situational awareness you could end up swept out to sea or worse.
The water currents around Singapore can be extreme. When the tides change, the South China Sea eventually finds its way to the Andaman Sea through the Singapore Strait, causing treacherous flows of current that shift over time. Thus, after every paddle, I upload my GPS data to the Garmin Connect cloud and review the route, in part to note dangerous changes in the ebb-and-flow patterns of currents.
While it’s a clear and present privacy risk to upload such data to the Garmin cloud, we’re all familiar with the trade-off: there’s only 24 hours in the day to worry about things, and the service just worked so well.
Until yesterday.
We had just wrapped up a paddle with particularly unusual currents, and my paddling partner wanted to know our speeds at a few of the tricky spots. I went to retrieve the data and…well, I found out that Garmin was under attack.
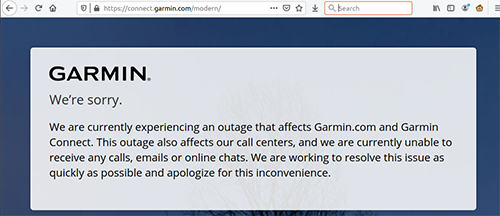
Garmin was being held hostage, and transitively, so was access to my paddling data: a small facet of my life had become a hostage to technology.
A bunch of my paddling friends recommended I try Strava. The good news is Garmin allows data files to be retrieved off of the Instinct watch, for upload to third-party services. All you have to do is plug the watch into a regular USB port, and it shows up as a mass storage device.
The bad news is as I tried to create an account on Strava, all sorts of warning bells went off. The website is full of dark patterns, and when I clicked to deny Strava access to my health-related data, I was met with this tricky series dialog boxes:
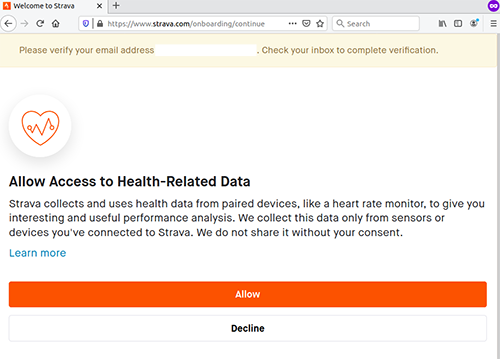
Click “Decline”…
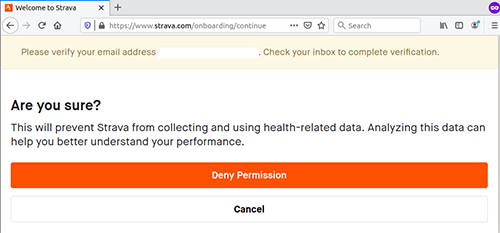
Click “Deny Permission”…
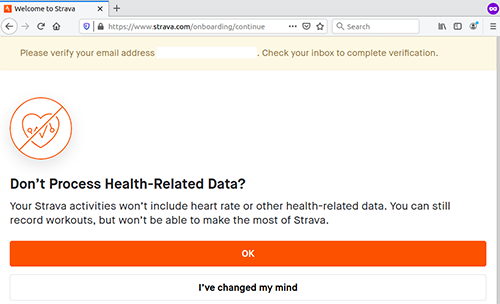
Click “OK”…
Three clicks to opt out, and if I wasn’t paying attention and just kept clicking the bottom box, I would have opted-in by accident. After this, I was greeted by a creepy list of people to follow (how do they know so much about me from just an email?), and then there’s a tricky dialog box that, if answered incorrectly, routes you to a spot to enter credit card information as part of your “free trial”.
Since Garmin at least made money by selling me a $200+ piece of hardware, collecting my health data is just icing on the cake; for Strava, my health data is the cake. It’s pretty clear to me that Strava made a pitch to its investors that they’ll make fat returns by monetizing my private data, including my health information.
This is a hard no for me. Instead of liberating myself from a hostage situation, going from Garmin to Strava would be like stepping out of the frying pan and directly into the fire.
So, even though this was a busy afternoon … I’m scheduled to paddle again the day after tomorrow, and it would be great to have my boat speed analytics before then. Plus, I was sufficiently miffed by the Strava experience that I couldn’t help but start searching around to see if I couldn’t cobble together my own privacy-protecting alternative.
I was very pleased to discovered an open-source utility called gpsbabel (thank you gpsbabel! I donated!) that can unpack Garmin’s semi-(?)proprietary “.FIT” file format into the interoperable “.GPX” format. From there, I was able to cobble together bits and pieces of XML parsing code and merge it with OpenStreetMaps via the Folium API to create custom maps of my data.
Even with getting “lost” on a detour of trying to use the Google Maps API that left an awful “for development only” watermark on all my map tiles, this only took an evening — it wasn’t the best possible use of my time all things considered, but it was mostly a matter of finding the right open-source pieces and gluing them together with Python (fwiw, Python is a great glue, but a terrible structural material. Do not build skyscrapers out of Python). The code quality is pretty crap, but Python allows that, and it gets the job done. Given those caveats, one could use it as a starting point for something better.
Now that I have full control over my data, I’m able to visualize it in ways that make sense to me. For example, I’ve plotted my speed as a heat map map over the course, with circles proportional to the speed at that moment, and a hover-text that shows my instantaneous speed and heart rate:

It’s exactly the data I need, in the format that I want; no more, and no less. Plus, the output is a single html file that I can share directly with nothing more than a simple link. No analytics, no cookies. Just the data I’ve chosen to share with you.
Here’s a snippet of the code that I use to plot the map data:
Like I said, not the best quality code, but it works, and it was quick to write.
Even better yet, I’m no longer uploading my position or fitness data to the cloud — there is a certain intangible satisfaction in “going dark” for yet another surveillance leakage point in my life, without any compromise in quality or convenience.
It’s also an interesting meta-story about how healthy and vibrant the open-source ecosystem is today. When the Garmin cloud fell, I was able to replace the most important functions of it in just an afternoon by cutting and pasting together various open source frameworks.
The point of open source is not to ritualistically compile our stuff from source. It’s the awareness that technology is not magic: that there is a trail of breadcrumbs any of us could follow to liberate our digital lives in case of a potential hostage situation. Should we so desire, open source empowers us to create and run our own essential tools and services.
Edits: added details on how to take data off the watch, and noted the watch’s price.
Six for Friday
📲 Are my days of dual carrying mobile devices about to start again? Looks like the Microsoft Surface Duo device is getting ready to launch. I’m really curious to see what it’ll feel like in hand.
📢 The Cascadia Code font now has multiple weights, as announced by Kayla in the Windows Terminal blog. I use it as my code font on Mac OS X via Homebrew.
📸 The AP is going to equip all of its visual journalists with Sony gear. That’s pretty massive, but and makes sense to be able to have all of their photojournalists using the same basic kit based around the E-mount, from stills to video.
😱 During the flights we took on Wednesday, I saw one person wearing a chef’s transparent saliva shield. Technically, I guess it is a covering of the nose and mouth, but I think the person was seriously missing the point.
😷 Delta has already banned 100 people for refusing to wear a mask. Delta CEO Ed Bastian: "If you board the plane and insist on not wearing a mask, we insist that you do not fly Delta into the future.“ That’s an airline policy I can support 100%.
👨⚕️ I can’t imagine how Antony Fauci manages to keep going to work day after day. This quote from Fauci’s interview with New York Times Opinion writer Jennifer Senior is downright depressing: "But Jennifer, would you want me to say something that’s directly contrary to what the president is doing? That’s not helpful. Then all of a sudden you don’t hear from me for a while.” I couldn’t do it, myself.
Wearing masks and infection rate
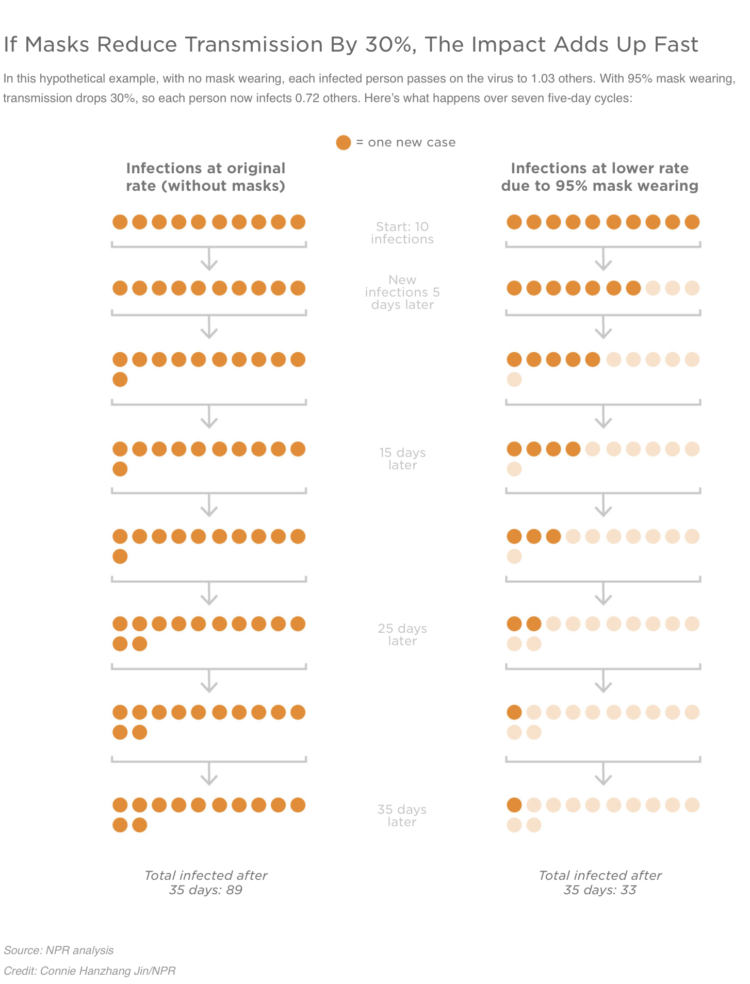
Studies suggest that wide adoption of masks can reduce the spread of the coronavirus. A meta-analysis by Ali Mokdad and his research group at the Institute for Health Metrics and Evaluation estimates at least a 30% reduction and up to 50%, which can lead to a big difference, as illustrated by Connie Jin for NPR:
Wear the mask.
Tags: Connie Jin, coronavirus, mask, NPR
Using Breakout Rooms to Jazz Up Family Zooms
Now that we’re 56 years into the COVID social contraction, you may be finding yourself in need of a way to jazz up the weekly Family Zoom.
We’ve been at it ourselves since almost the first turn of the deadbolt, gathering Rukavina and affiliated from PEI, Quebec, Ontario and California together for everything from Zoom Pictionary to Zoom Trivia to Zoom Scattergories every Friday night. Oh how much we’ve learned about the promise, curse, and opportunities of family video-conferencing; it makes our early-aughts cacophonous Skype Christmas gatherings look primitive by compare.
But, if you’re anything like us, you’re looking for something new to inject life into the proceedings, and I’m here to recommend Breakout Rooms.
You might not even know that Breakout Rooms exist in Zoom because they’re not enabled by default: the person organizing the Zoom needs to enable them following these incantations.
Once enabled, the organizer can, at any time in the proceedings, manually or automatically, assign people to breakout rooms, which are like mini-Zooms-within-a-Zoom. And, the organizer can later, in turn, call everyone back to the Mother Zoom.
Here’s how we used this feature tonight on the Rukavina Zoom:
Oliver decided, for reasons too complex for typical people to possibly understand, that tonight’s overarching theme would involve veneration of Ethan the Dog, of December, and of Christmas. It was generously left to me to work out the details.
I came up with three small-group-friendly activities:
- Come up with as many names of people or animals starting with “E” as you can in 2 minutes. Ethan, Enzo, etc.
- A short 12-question Christmas Trivia quiz (“In which modern-day country was St. Nicholas born?”, for example).
- Using any means at your disposal, name as many events other than Christmas that took place, or take place, in December.
For every round I let Zoom come up with random breakout rooms; as Oliver and I were the overlords, there remained 5 people to breakout, so one room had 3 people and the other 2 people, and the rooms were different every time.
In addition to being simply a breakout from the everyday, this format allowed people short bursts of one-on-one interaction that the usual mass family chaos doesn’t. I think those who got paired up with young Montreal nephew, flying solo, particularly appreciated the chance.
I suspect we’ll try it again.
Do you have unique Family Zoom ideas to share?
The CFRT (citizens for rapid transit) Petition...


The CFRT (citizens for rapid transit) Petitioning for LRT in Vancouver, summer 1980. From the Fraser Wilson collection of ephemera (heading to SFU). From Tom Hawthorne on Twitter: “[CFRT was a] Group led by Carole Walker and A.D. (Des) Turner. They were opposed to SkyTrain, arguing it was too expensive and ineffectual.”
Twitter Favorites: [Stv] N - Ólafsvík, Iceland (N64.5) S - Rotarua , NZ (S38.8) E - Sydney, AU (E151) W - Honolulu, US (W157) https://t.co/viSg2OabTl

N - Ólafsvík, Iceland (N64.5) S - Rotarua , NZ (S38.8) E - Sydney, AU (E151) W - Honolulu, US (W157) twitter.com/AnthonyFloyd/s…
Twitter Favorites: [Planta] This photo is from 33 years ago. It’s an old passport photo from July 25th 1987. #NewProfilePic https://t.co/3A5zDY3Xo9

This photo is from 33 years ago. It’s an old passport photo from July 25th 1987. #NewProfilePic pic.twitter.com/3A5zDY3Xo9

The 48 Laws of PowerPoint
At least two people in the past week have noticed my lack of blogging and wondered if I'm OK. So, before social services are alerted, I thought I should explain myself.
I'm good thanks.
I've not been blogging because I'm trying to write a book about PowerPoint.
Long-time readers will point out that I've been, sort of, doing that for about 20 years but this time I've got to put it all in one place and actually check the spelling because I've got a proper contract.
And, most excitingly of all, Stef is going to design it. ie it's legit, it's a proper thing.
Even just typing this now makes me realise that I should share more of my progress on here. That'll make it better. I'm going to do that.
In the meantime, here's an outtake. I assumed someone would already have done 'The 48 Laws of PowerPoint' based on, but it seems they haven't.
So here's one:
The 48 Laws of PowerPoint
1. Don’t read the screen
2. Lists
3. Use lists
4. Lots of lists
5. But 48 items is way too many - who thought this was a good idea?
6. Start with a story
7. End with an ask
8. Fill up the rest with ideas and images
9. Repeat the important things
10. Remove the word ‘key’
11. Make it shorter
12. Repeat the important things
13. Don’t read the screen
14. Arrive early
15. Respect the AV people
16. Be a bit bigger
17. Make it clear, concise and catchy
18. Or freewheeling, unpredictable and magical
19. Just be sure which one you’re doing
20. Repeat the important things
21. Arrive early
22. Double-check the tech
23. What will you do if your slides don’t work?
24. Press B
25. Make something very big
26. Make something very small
27. Make something rhyme
28. Finish on time
29. Actually, finish early
30. Never outshine the master
31. Sorry, wrong list
32. One hour of prep per one minute of talk
33. Repeat the important things
34. Demand change
35. Make it readable
36. Make it accessible
37. Make it memorable
38. Make it bigger
39. Remove the word ‘holistic’
40. No 3D
41. No pies
42. Slow down
43. Speed up
44. Repeat the important things.
45. Start with a story
46. End with a bang
47. Don’t read the screen
48. BANG
Phone makers with aggressive battery management can delay contact tracing notifications

As Canada’s COVID Alert app moves through beta testing, reports have surfaced that some Android manufacturers that use aggressive battery saving techniques are making problems for contact tracing apps.
A German website called Bild (via WinFuture) claims that Germany’s contact tracing app doesn’t receive COVID-19 exposure notifications on time, if at all, on many Samsung and Huawei phones. The publication blames battery management tweaks for delaying notifications.
It’s important to note that battery management tweaks only affect notifications and not the contact tracing itself. On Android, Google incorporated the Exposure Notification API into Play Services, which integrates deeply into the operating system. This allows Bluetooth contact tracing to run smoothly in the background.
The result of this is that some Germans must open the contact tracing app to receive notifications, which is counter to how the system was intended to work. Further, since missed notifications could mean missed warnings about infection, the problem could lead to people spreading COVID-19.
Android Police notes that many manufacturers modify how Android handles background tasks and apps, often aggressively pausing or killing those tasks to preserve battery life. Many developers have complained about the behaviour, which can interfere with how their apps work. Android VP Dave Burke recently acknowledged that the Android team was monitoring the situation.
However, Google will eventually need to set a standard for how Android handles background tasks and battery management. The problem with the current system is that manufacturers tweak it. Since developers can’t always test for every available device, app behaviour can break if a device doesn’t follow the standard battery management tool.
As for the German contact tracing app, Germany added a toggle to the app that lets it always run in the background to bypass the issue. Additionally, the developers have asked manufacturers to ease background restrictions, noting that Huawei has already confirmed it would do so for the app.
Considering Canada’s COVID Alert app could launch soon, people must be aware of the possible issues. Website ‘dontkillmyapp.com‘ lists some of the worst offenders, including OnePlus, Huawei, Samsung and Asus (some other top offenders aren’t available in Canada). If you have one of these phones and download the COVID Alert app when it becomes available, make sure to periodically check the app so you don’t miss any notifications.
Source: Bild Via: WinFuture, Android Police
The post Phone makers with aggressive battery management can delay contact tracing notifications appeared first on MobileSyrup.
How To: Create an Architecture of Participation for your Open Source project
Doug Belshaw may be limiting his discussion to open source projects, but I see this as a blueprint for how to create learning environments that maximize learner autonomy and engagement. The architecture he describes has eight components, but what brings them together (in my mind) is that each represents an element of an open-ended negotiation between the participants. The rest of this post details some of the practical aspects of cooperative organization - knowing who is participating, clearly identifying a project home, pathways to participation, signposting and orientation, recognition, and more.
Web: [Direct Link] [This Post]From Long-distance Entanglement to Building a Nationwide QuantumInternet
This is a report for the U.S. Department of Energy outlining development toward the Quantum Internet (QI). The QI depends on a phenomenon known as quantum entanglement, whereby a change of state in one particle is mirrored by a second particle, no matter how far distant. Einstein called it "spooky action at a distance". So it's a means of instantaneous information transmission. The speed would be limited only by how fast we can generate and read changes of state. This report (38 page PDF) is fairly technical, but the first 11 pages are accessible and will give you the general idea. Via Protocol.
Web: [Direct Link] [This Post]