Shared posts

08 Aug 17:10

How to replace a pie chart

by David Robinson

Yesterday a family member forwarded me a Wall Street Journal interview titled What Data Scientists Do All Day At Work. The title intrigued me immediately, partly because I find myself explaining that same topic somewhat regularly.

I wasn’t disappointed in the interview: General Electric’s Dr. Narasimhan gave insightful and well-communicated answers, and I both recognized familiar opinions and learned new perspectives. But I was disappointed that in an article about data scientists (!) they would include a chart this terrible:
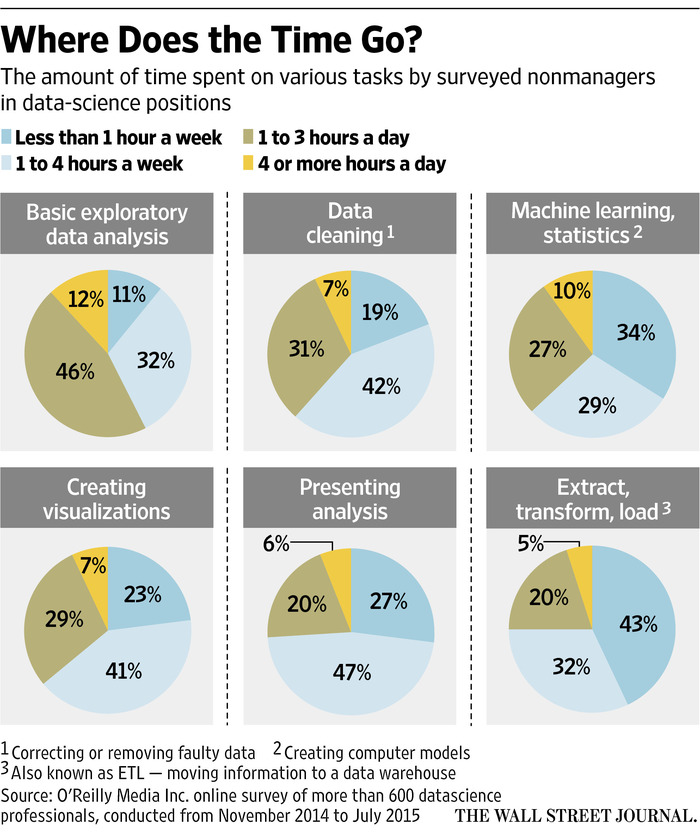
WSJ Pie Chart

Pie charts have a bad reputation among statisticians and data scientists, with good reason (see here for more). But this is an especially unfortunate example. We’re meant to compare and contrast these six tasks. But at a glance, do you have any idea whether more time is spent “Presenting Analysis” or “Data cleaning”?

The problem with a lot of pie-chart bashing (and most “chart-shaming,” in fact) is that people don’t follow up with a better alternative. So here I’ll show how I would have created a different graph (using R and ggplot2) to communicate the same information. This also serves as an example of the thought process I go through in creating a data visualization.

(I’d note that this post is appropriate for Pi Day, but I’m more of a Tau Day observer anyway).

Setup

I start by transcribing the data directly from the plot into R. readr::read_csv is useful for constructing a table on the fly:

library(readr)

d <- read_csv("Task,< 1 a week,1-4 a week,1-3 a day,>4 a day
Basic exploratory data analysis,11,32,46,12
Data cleaning,19,42,31,7
Machine learning/statistics,34,29,27,10
Creating visualizations,23,41,29,7
Presenting analysis,27,47,20,6
Extract/transform/load,43,32,20,5")

# reorganize
library(tidyr)
d <- gather(d, Hours, Percentage, -Task)

This constructs our data in the form:1

Task Hours Percentage
Basic exploratory data analysis < 1 a week 11
Data cleaning < 1 a week 19
Machine learning/statistics < 1 a week 34
Creating visualizations < 1 a week 23
Presenting analysis < 1 a week 27
Extract/transform/load < 1 a week 43
Basic exploratory data analysis 1-4 a week 32
Data cleaning 1-4 a week 42
Machine learning/statistics 1-4 a week 29

Bar plot

The most common way a pie chart can be improved is by turning it into a bar chart, with categories on the x axis and percentages on the y-axis.

This doesn’t apply to all plots, but it does to this one.

library(ggplot2)
theme_set(theme_bw())

ggplot(d, aes(Hours, Percentage)) +
  geom_bar(stat = "identity") +
  facet_wrap(~Task)

center

Note that much like the original pie chart, we “faceted” (divided into sub-plots) based on the Task.

This graph is not yet polished, but notice that it’s already easier to tell how the distribution of responses differs between tasks. This is because the x-axis is ordered from left to right as “spend a little time” to “spend a lot of time”- therefore, the more “right shifted” each graph is, the more time is spent on it. Notice also that we were able to drop the legend, which makes the plot both take up less space and require less looking back and forth.

Alternative plots

This was one of a few alternatives I considered when I first imagined creating the plot. When you’ve made a lot of plots, you’ll learn to guess in advance which you will be worth trying, but often it’s worth visualizing a few just to check.

We have three attributes in our data: Hours, Task, and Percentage. We chose to use x, y, and facet to communicate those respectively, but we could have chosen other arrangements. For example, we could have had Task represented by color, and represented it with a line plot:

ggplot(d, aes(Hours, Percentage, color = Task, group = Task)) +
  geom_line()

center

This has some advantages over the above bar chart. For starters, it makes it trivially easy to compare two tasks. (For example, we learn that “Creating visualizations” and “Data cleaning” take about the same distribution of time). I also like how obvious it makes it that “Basic exploratory data analysis” takes up more time than the others. But the graph makes it harder to focus just one one task, you have to look back and forth from the legend, and there’s almost no way we could annotate it with text like the original plot was.

Here’s another combination we could try:

ggplot(d, aes(Hours, Task, fill = Percentage)) +
  geom_tile(show.legend = FALSE) +
  geom_text(aes(label = paste0(Percentage, "%")), color = "white")

center

This approach is more of a “table”. This communicates a bit less than the bar and line plots since it gives up the y/size aesthetic for communicating Percentage. But notice that it’s still about as easy to interpret as the pie chart, simply because it is able to communicate the “left-to-right” ordering of “less time to more time”.

Improving our graph

How can our bar plot be improved?

The first problem that jumps out is that the x-axis overlaps so the labels are nearly unreadable. This can be fixed with this solution.

ggplot(d, aes(Hours, Percentage)) +
  geom_bar(stat = "identity") +
  facet_wrap(~Task) +
  theme(axis.text.x = element_text(angle = 90,  hjust = 1))

center

Next, note that the original pie chart showed the percentages as text right on the graph. This was necessary in the pie chart simply because it’s so difficult to guess a percentage out of a pie chart- we could afford to lose it here, when the y-axis communicates the same information. But it can still be useful when you want to pick out a specific number to report (“Visualization is important: 7% of data scientists spend >4 hours a day on it!”) So I add a geom_text layer.

ggplot(d, aes(Hours, Percentage)) +
  geom_bar(stat = "identity") +
  facet_wrap(~Task) +
  geom_text(aes(label = paste0(Percentage, "%"), y = Percentage),
            vjust = 1.4, size = 5, color = "white")

center

The ordering of task facets is arbitrary (alphabetical in this plot). I like to give them an order that makes them easier to browse- something along the lines of. A simple proxy for this is to order by “% who spend < 1 hour a week.”2

library(dplyr)

d %>%
  mutate(Task = reorder(Task, Percentage, function(e) e[1])) %>%
  ggplot(aes(Hours, Percentage)) +
  geom_bar(stat = "identity") +
  facet_wrap(~Task) +
  geom_text(aes(label = paste0(Percentage, "%"), y = Percentage),
            vjust = 1.4, size = 5, color = "white") +
  theme(axis.text.x = element_text(angle = 90,  hjust = 1)) +
  xlab("Hours spent per week")

center

Graph design

From here, the last step would be to adjust the colors, fonts, and other “design” choices.

I don’t have terribly strong opinions about these choices (I’m pretty happy with ggplot2’s theme_bw()). But some prefer Edward Tufte’s approach of maximizing the “Data/Ink Ratio”- that is, dropping borders, grids, and axis lines. This can be achieved with theme_tufte:

library(ggthemes)

d %>%
  mutate(Task = reorder(Task, Percentage, function(e) e[1])) %>%
  ggplot(aes(Hours, Percentage)) +
  geom_bar(stat = "identity") +
  facet_wrap(~Task) +
  geom_text(aes(label = paste0(Percentage, "%"), y = Percentage),
            vjust = 1.4, size = 5, color = "white") +
  theme_tufte() +
  theme(axis.text.x = element_text(angle = 90,  hjust = 1))

center

Some people take this philosophy even further, and drop the y-axis altogether (since we do already have those percentages annotated on the bars).

library(ggthemes)

d %>%
  mutate(Task = reorder(Task, Percentage, function(e) e[1])) %>%
  ggplot(aes(Hours, Percentage)) +
  geom_bar(stat = "identity") +
  facet_wrap(~Task) +
  geom_text(aes(label = paste0(Percentage, "%"), y = Percentage),
            vjust = 1.4, size = 5, color = "white") +
  theme_tufte() +
  theme(axis.text.x = element_text(angle = 90,  hjust = 1),
        axis.ticks = element_blank(),
        axis.text.y = element_blank()) +
  ylab("")

center

(See here for an animated version of this “Less is more” philosophy).

So take a look at the two versions:

center

Which communicates more to you? And can you think of a plot that communicates this data even more clearly?

Postscript: How would I do this in base R plotting?

I wouldn’t.

Footnotes

  1. Why did I choose to represent it in this “gathered” format, rather than one row per task and one column per hour? Because using tidy data makes it easier to plot!

  2. This isn’t actually going to tell us which tasks data scientists spend the most time on: we should do some kind of weighted measure to estimate the mean. But for visualization purposes this is enough.

20 Mar 06:34

Handsome B&W Filters with Black

by John Voorhees

There was a time when I would download just about any photo editing app and give it a try. But like many things, I found that having too many tools led to paralysis of choice. I would want to edit a photo, but I couldn't decide which app had just the right filters I was looking for.

These days I use the built-in Photos app for most of my photo editing, but I keep a handful of other apps around, and periodically add one or two to the mix on a trial basis. Not many of those trial photos apps stick, but recently I've been trying Black by Peter Stojanowski, which features ten attractive black and white filters based on classic film types and a few manual controls, and it's stuck with me.

What I appreciate most about Black, is its simplicity and focus on my photos. Import any photo from your Camera Roll into Black using the '+' button at the bottom of the Collection screen. Black immediately opens your image in its editing view, displaying a greyscale version of your photo. You can apply any of the ten black and white film filters by simply swiping back and forth among them. The names of the filters are overlaid across the top of the photo you are editing in a way that maximizes the size of the photo during editing and I didn't find distracting. When you reach the end of the list, it cycles back to where you started in an endless loop. With only ten filters, it is easy to quickly compare them and decide on one you like best.

After you save any edits or cancel out of editing mode, you are taken back to the Collection view that includes thumbnails of each photo you have imported. In a nice touch, Black uses one of the photos from your collection to create a handsome header for Collection view. Selecting an image in the Collection view gives you the option to reopen it in editing mode or share it to a variety of built-in services or via the system share sheet. Selecting more than one image eliminates the editing option, but lets you share multiple images.

From the top left: Marina City Tower filter: GP3 100 Shanghai; Michigan Avenue Bridge filter: Tura Expired 2002; and Sears Tower filter: GP3 100 Shanghai

From the top left: Marina City Tower filter: GP3 100 Shanghai; Michigan Avenue Bridge filter: Tura Expired 2002; and Sears Tower filter: GP3 100 Shanghai

Black also has 'Fade,' 'Curves,' and 'Vignette' manual controls for fine-grained adjustments. The three parameters can be adjusted all you want, but saving a photo with manual adjustments requires a $0.99 in-app purchase. The pricing and placement of Black's in-app purchase is fair. You can do a lot using just the free filters. Each of the photos in this review were taken with my iPhone 6s Plus and edited using Black's free filters with no manual adjustments. If you do want to do some fine tuning of your photos, however, the manual tools are excellent.

Manual controls like Fade and Curves require an in-app purchase.

Manual controls like Fade and Curves require an in-app purchase.

It is a shame that Black is iPhone-only. I might be more understanding of this decision if Black took photos too, but it doesn't. Black is for post-processing only and an iPad version would do a better job of showing off your photo collection and editing. Yet, despite the lack of an iPad version, Black has quickly become one of my go-to photos apps for the speed and ease with which I can create good looking black and white versions of my photos.

Black is free on the App Store with a $0.99 in-app purchase that unlocks the saving of edits made with its Fade, Curves, and Vignette manual controls.

20 Mar 06:33

Twitter Favorites: [ccg] We do not discuss how many years ago OK Computer came out in this house. Yes, lad, these are Oldies.

Crystal R Williams @ccg
We do not discuss how many years ago OK Computer came out in this house. Yes, lad, these are Oldies.
20 Mar 06:33

Recommended on Medium: "VR will be Mobile" in H U M A N

Projecting Sales of Millions of Desktop Headsets, 10s of Millions on Mobile

Continue reading on Medium »

20 Mar 06:31

Twitter Favorites: [thewaywardrose] Can we make @JSadikKhan's book mandatory read for TTC board & TO city council? She outlined their main job criteria: https://t.co/y8wqQwCYFF

Rose D'souza @thewaywardrose
Can we make @JSadikKhan's book mandatory read for TTC board & TO city council? She outlined their main job criteria: pic.twitter.com/y8wqQwCYFF
16 Mar 06:20

Subatomic units

by Jonathan Libov

I like to think about consumer internet in terms of atomic units. Google was about that lone spare box, the native interaction model for seeking information on the web. Twitter’s short burst of text was the right atomic unit for the thought, Instagram’s simple photo for a glossy slice of life, Snapchat's timebombs for the things you're seeing in the world that don't need to persist. And of course all the messengers' what-I-type-in-chat-bubbles-on-the-right-and-you-in-chat-bubbles-on-the-left for basic communication.

This is highly reductive, of course, and you could object that Facebook was never really about an atomic unit, at least in form if not function. You might then reduce it further (this blog post was written on #ReductiveMonday) and say that the atomic unit of all internet services, consumer or otherwise, was the post. You could define a "post" as a set of metadata — i.e., the user who posted, a timestamp of when they posted, and who they posted to — alongside some blob of media: a photo, a string of text, a video, an audio clip.

Posts = Metadata + Blob The formula for "the post": Metadata + Blob

Looking back, you could also say the data model for posts has primarily been oriented around the metadata for each post, and less so the blob of media—the actual data—that comprises it. When I post a Kanye West video to Facebook and @-mention my friend in it. Facebook could reasonably glean from their own metadata (<posted-by>Jonathan Libov</posted-by>) that I have an ongoing relationship with this person (<mentioned>Jane Doe</mentioned>). Facebook could also glean from the YouTube metadata, which has "Kanye West" listed explicitly in the title, that we both have strong feelings about Kanye West.

Likewise, Google's PageRank was initially oriented around the metadata of a webpage — which pages were linked to which other pages — than the content of the page itself.

Of course Google and Facebook and others eventually got very good at analyzing text to make insights—sentiment analysis, information extraction and so forth. More recently, we've seen remarkable advances in machine vision, speech to meaning, and other forms of machine intelligence. This means that Google and Facebook (as well as startups like Clarifai) can now see photos and videos, Diffbot can see webpages the way humans do (using implicit visual signals in addition to explicit data signals to extract meaning) and products like Siri, Google Now, api.ai, and Houndify can hear audio and have some idea what they're all about.

Suddenly all those bits that comprise the blobs — blobs of photos and video and audio — we're all posting to the internet are now inspectable. As a crude illustration, you could say that images on the internet have historically looked like this:

img src

And moving forward will look a lot more like this:

svg code

It's as if we were living in a world of atoms and just discovered that there are quarks.

This is much more meaningful than what it implies for Facebook and Google understanding every aspect of every thing we post. In a world of subatomic units on the internet, many of the metaphors we've built up over centuries no longer make sense. A photo, for example, has always been a rectangle with fine-grained hues and tints that in and of themselves mean nothing. But in a world where objects can be lifted from photos, maybe it will soon make more sense to think of a photo as a collection of (networked?) objects? Similarly, a song has always been a recorded audio track that gets replicated in its original form, but when something like Jukedeck can adjust the length of a song without changing its basic integrity, or create and destroy a song with no sentimentality, one wonders how long the notion of a song as a discreet, recorded audio track will remain fully intact.

Seeing the internet Seeing the internet (Source)

Much as physics appears to have gotten quite a bit more complicated since we acquired an understanding of subatomic particles, I suppose our notion of all media may become quite a bit more complex over the coming years. We think of photos as natural, impenetrable blobs, videos as a series of impenetrable images paired with impenetrable audio tracks, and songs as layers of impenetrable words and music. But if you grow up with an internet that doesn't make those distinctions, those metaphorical blobs may no longer seem all that atomic or natural.

Moreover, if it’s dizzying to imagine how subatomic units — objects in photos and videos, words in audio, and ideas in text — will so vastly increase the volume of the world’s data points, it’s flat out stupefying to imagine the networks that will be built between them.

16 Mar 06:18

Learning machine learning

by Benedict Evans

In August 2001, I was a telecoms analyst visiting investors in Tokyo. In one of these meetings, a portfolio manager at a Very Large Fund asked me what would happen now that GPRS meant that all mobile voice calls would be packet-switched and that therefore mobile operators’ voice revenue would disappear within the next 18 months or so. 

This was a surprisingly hard question to answer well. It was nonsense, but to explain why it was nonsense you had to work out quite which things the person asking it didn’t know, and what completely incorrect narrative he’d arrived at to think that this was going to happen. He’d heard ‘packet’ and 'mobile' and added 2+2 to get 22. 

I’m reminded of this now, after not thinking of it in 15 years, because as AI explodes in some senses I risk being exactly that guy. 

As has happened with many technologies before, AI is bursting out of universities and research labs and turning into product, often led by those researchers as they turn entrepreneur and create companies. Lots of things started working, the two most obvious illustrations being the progress for ImageNet and of course AlphaGo. And in parallel, many of these capabilities are being abstracted - they’re being turned into open source frameworks that people can pick up (almost) off the shelf. So, one could argue that AI is undergoing a take-off in practicality and scale that’s going to transform tech just as, in different ways, packets, mobile, or open source did. 

This also means, though, that there’s a sort of tech Tourettes' around - people shout ‘AI!’ or ‘MACHINE LEARNING!’ where people once shouted ‘OPEN!’ or ‘PACKETS!’. This stuff is changing the world, yes, but we need context and understanding. 'AI', really, is lots of different things, at lots of different stages. Have you built HAL 9000 or have you written a thousand IF statements?  

Back in 2000 and 2001 (and ever since) I spent a lot of my time reading PDFs about mobile - specifications and engineers' conference presentations and technical papers - around all the layers of UMTS, WCDMA, J2ME, MEXE, WML, iAppli, cHTML, FeliCa, ISDB-T and many other things besides, some of which ended up mattering and some of which didn’t. (My long-dormant del.icio.us account has plenty of examples of both). I didn’t spend very much time learning about processor roadmaps, which in hindsight was only partially the right decision - if I had, I might have been more aware of what might start becoming possible around 2007. But none the less, I got to a pretty good understanding of what was going on. More precisely, I got to the point that I knew what I was talking about when I talked about the things I was interested in, and also knew what things I really didn’t know anything about. I knew what I didn’t know. 

The same process will happen now with AI within a lot of the tech industry, and indeed all the broader industries that are affected by it. AI brings a blizzard of highly specialist terms and ideas, layered upon each other, that previously only really mattered to people in the field (mostly, in universities and research labs) and people who took a personal interest, and now, suddenly, this starts affecting everyone in technology. So, everyone who hasn't been following AI for the last decade has to catch up.  

What strikes me here particularly about AI as opposed to mobile is both that it is actually many different ideas, concepts and capabilities, often quite different, and also it has many different applications. For almost as long as there’s been science fiction people have talked about machines that were as intelligent as people (indeed that’s what the layman would probably understand by ‘artificial intelligence’) and in some senses we would see that with, say, fully autonomous vehicles. But there is also the old line that ‘a computer should never ask something that it should be able to work out’ - a lot of AI will mean that a computer is less stupid, in invisible and inhuman ways. That makes it very broad indeed - over time you will encounter ‘AI’ in some senses in a huge range of things that you can’t talk to or put on YouTube. 

16 Mar 06:16

The 4 kinds of bullshitters (and where Trump fits)

by Josh Bernoff

Donald Trump rates high in polls on “tells it like it is.” And yet he seems to just make stuff up on the fly. How is this possible? Based on my extensive study of bullshit, I think I’ve got a handle on why: he’s a type of bullshitter we haven’t seen much of in America. … Continue reading The 4 kinds of bullshitters (and where Trump fits) →

The post The 4 kinds of bullshitters (and where Trump fits) appeared first on without bullshit.

16 Mar 06:13

The future of the Arbutus Corridor

by michaelkluckner

arbutuscorridor2

Is anyone else having a “here we go again” moment about the Arbutus Corridor? Not about the value of having it as a city asset, but about the aspirational language that was built into the Mayor’s announcement and subsequent statements on the radio, when he talked about it being Vancouver’s High-line, about it having public art along it, about it being wonderful for family outings etc. etc.

All the images, both verbal and graphic, are recreational. I know this city image below is just a sketch, but it is an inspirational one of mixed uses happily coexisting. It creates expectations….

arbutuscorridor

Take the city scene off the left-hand side and what do you have:

arbutuscorridorwhiterock

White Rock Beach, with the BNSF line running through it. Anybody who knows White Rock knows how poorly the train and the unseparated walking/cycling area work together; trains amble along the beach at little more than a walking pace, occasionally wiping out pedestrians wearing earbuds – hardly the recipe for a transit line. Even the Arbutus bus goes faster than that. (BNSF has been lobbied heavily to move its tracks inland, but has shown little interest due to the reported cost of a half-billion.)

Is this a tacit admission by the city that the west side will never be densified to the extent that a rapid-transit line will be feasible? Is it another nod to Resort City?

transportation2040

This graphic from the Transportation 2040 report makes no mention at all of the corridor, but the text suggests that both transit and recreation scenarios are possible.

arbutuscorridor3

From my point of view, although I’m perfectly happy with bikeways such as Cypress two blocks away from the corridor, I would enjoy a narrow paved path through the brambles so I could get to the Kerrisdale area; however, I would hate to see anything done on that expensive corridor that will make it politically impossible to run fast rail. Of course, it could always become what the Millennium Line is through East Van – a Skytrain guideway providing some rain shelter for cyclists and pedestrians below. Not likely!

If the gorilla of public opinion is given this banana by city council, it’s going to be awfully difficult to take it away. Anybody agree?


16 Mar 06:11

Why Build So Much So Fast?

by michaelkluckner

keepcalm

Blogger and Grandview activist Jak King analyzed the city’s breakneck construction pace in a recent post.

He notes the projections in the 2013 Regional Context Statement which show the Vancouver population increasing from about 650,000 now to 765,000 by 2041 – a need for 97,500 housing units. However,

Vancouver City Council has approved a net increase from 2006-February 2016 totaling 32,849 housing units.

Now, a little math (can’t be avoided, I’m afraid).  For the period 2006-2041, the official projection was for an increase of 97,500 units.  With 32,849 already approved, that leaves 64,651 to approve in the period 2016-2041 – a requirement of 2,586 per year for the next 25 years.

However, we are approving far more than 2,586 a year.  The average over the last five years is 5,068 per year, and that rate is increasing so fast that the average for the last two full years (2014, 2015) is 5,984 building units per year – just about double what we actually need according to the City’s own estimates.

Are the population projections so wrong, or is this another example of capital seeking the relatively safe haven of Vancouver real-estate?

Clearly we need to slow down the approval process.  However, the graph of housing approvals from 2006 to 2016 indicates that the rate of approvals is actually accelerating rapidly, with 2016 already rushing towards another 6,000+ total.

In theory, this supply ought to exceed the demand and drive prices down, cropping the profits of developers to a razor-thin slice. Condo prices have been more or less flat until very recently. I’ve always believed that developers are the smartest guys in the room; are they setting themselves up for a price crash?


16 Mar 06:10

How the iPad Pro Made Me Love the iPhone 6s Plus

by Steven Aquino

People talk about how an Apple product such as the iPhone having a halo effect on customers. If you buy an iPhone and like it, the theory goes, you're more inclined to buy another Apple device, like a MacBook. This theory has certainly proven true in my experience – since buying my first iPhone (my first Apple product) in 2007, I've bought numerous other Apple products and subscribed to numerous Apple services in the subsequent years. Put another way, I was entrenched in the Apple ecosystem long before I started covering the company for a living.

Recently, a different kind of halo effect has settled on me. I've been using an iPad Pro for the past several weeks, and absolutely love it. Like Federico, the iPad is my computer of choice because of my deep familiarity with iOS and the ways in which working from a touchscreen device makes computing more easily accessible.1 Coming from my old iPad Air 1, iPad Pro has intensified my affinity for the iPad and iOS in general. It has impressed not merely by its technical or software merits, but by one seemingly obvious thing: its screen.

At 12.9 inches, the iPad Pro's display is the best thing to happen to my vision in a long time. Its effects aren't only about pixel density or color accuracy; it's about sheer size. The iPad Pro's screen is huge and has completely transformed how I work. Everything I see on the iPad is better simply by virtue of the big screen, from managing email to browsing the Web to typing on the virtual keyboard. Throw in iOS 9's multitasking features – the app switcher notwithstanding – and I think it's fair to say iPad Pro is the most accessible computer Apple's ever built.

Which brings us to the iPad Pro's halo effect. Using the tablet daily over the past couple of months has taught me that bigger truly is better for me. My eyes love big screens, so much so that I started wondering if I should reconsider my stance on the 5.5-inch iPhone 6s Plus. "If the iPad Pro's screen is so great and the device itself not too cumbersome to handle," I thought, "why couldn't that same logic apply to the iPhone?"

As time went on, I found myself increasingly wanting an iPhone 6s Plus. I wanted it for the same reason I love the iPad Pro: it's so big. My gut said I was going to love it, so I decided to go for it. It turns out the "monster" iPhone is the iPhone I've always wanted, maybe even needed, despite telling myself otherwise.

Why the Change of Heart?

In my review of the iPhone 6s, I said this about the 6s Plus:

Though I may revisit the Plus in the future, its main problem for me today is the Faustian bargain it presents. Yes, the Plus offers me the larger screen and other advantages, but I get an unwieldy phone as a consequence. If my vision were the only disability I needed to accommodate, the choice would be simple. The thing is, I have physical motor issues to consider, too. The Plus is a beast that’s difficult for my hands to tame. Put together, these factors make the question of which trade-offs I’m willing to accept more complicated — agonizingly so, since my eyes love the Plus’s screen.

Right now, the regular 6s is the better choice all around. While I do miss the Plus’s bigger, higher resolution screen, better battery, and optical image stabilization, the regular 6s remains good enough. It’s easier to use one-handed and carry around. Most of all, it still feels like an iPhone, as opposed to the “iPad Nano” feel of its big brother.

In hindsight, that critique wasn't wrong as much as it was myopic.

The problem with my statement was that it was based on longstanding preconceptions of what I wanted out of an iPhone, as well as how those expectations fit with my needs as a person with disabilities. I didn't allow for flexibility in my mindset because I was convinced I needed a phone that allowed for one-handed use and pocketability with a screen that was "good enough" (read: big enough) that I could see. In other words, I wanted nothing but a "Goldilocks iPhone" whose attributes presented the "just right" overall package for myself.

Yet, for as much truth there is in the holistic approach to hardware accessibility, it isn't the only way. It took using the iPad Pro to fully realize it. The fact of the matter is, despite having multiple disabilities, my primary disability has been and always will be my vision impairment. The eyes are a person's window to the world, and mine need all the help they can get. Why shouldn't I make life easier on myself whenever possible? The iPhone 6s is good on my eyes; the 6s Plus is great. Full stop.

While the 6s Plus remains unwieldy relative to its smaller sibling, I've been able to adjust how I use it so that its size isn't detrimental to the point of being insurmountable. Take one-handed usage, for example. I upgraded from my old iPhone 5s to the 4.7-inch iPhone 6 in 2014 partly because I valued using my phone with one hand. The truth is, however, I've hardly ever used my phone that way since then. Most of the time, I hold my phone in my right hand as I interact with the screen with my left. I do the same with the 6s Plus, but now I have a giant screen to boot.

I can say with confidence that I don't think I'd like a bigger iPhone Plus, assuming Apple ever makes an even larger one. That said, the Plus of today suits me well. It's still a beast of a phone, but unlike before, I now know that gaining its huge screen is a trade-off worth making.

What's Great About the iPhone 6s Plus?

The screen is huge, of course, but there's more to it than that.

What makes the 6s Plus so appealing to me involves two things. First, the Plus's large canvas gives me the ability to see more content at a glance. It saves on scrolling, but in accessibility terms, it saves on eye strain and fatigue. I find that my eyes don't work as hard using the Plus because its screen is so large. I can even hold my phone a bit farther away from my face because my eyes are comfortable with the large space.

Secondly, it feels as if iOS is "enlarged" on the 6s Plus. This is due to being presented on a big screen, but what I mean is iOS feels easier to navigate, even in Standard View.2 Anything that I can see on screen – text, UI elements, photos, emoji, whatever – is more visually accessible. 3D Touch in Mail is a good example. "Peeking" into a message on the Plus feels better than it does on the regular 6s because of the big screen. The preview is easier to read, and I'm more efficient at checking my email. Likewise, looking at Instagram photos is easier because not only are the images larger, but I'm able to see more of an image's details.3 As a bonus, the 6s Plus makes it easier for me to make on-the-fly edits to works in progress in iA Writer, and well as watching Netflix or YouTube. I typically shied away from these tasks on the 6s.

In practice, using the 6s Plus reminds me of the large-print textbooks I had in school. These books were the same titles my classmates were using, only mine were much thicker and heavier.4 In a similar vein, the 6s Plus is a "large print" version of the iPhone. I did fine with the regular 6s, just as I likely could've done with a normal-sized textbook and a high-powered magnifier as a kid, but the 6s Plus is more conducive to my visual needs. As with the large-print textbooks being necessary despite their gargantuan size, the Plus's upside in readability trumps any concerns over its gargantuan size.

Sitting On Opposite Ends of the iPhone Spectrum

An interesting aspect of my journey toward iPhone 6s Plus enlightenment are the disparate perspectives me and my girlfriend have when it comes to our respective iPhones.

As I've learned to embrace the Plus, my girlfriend has repeatedly said she prefers a small phone. She's been using my old iPhone 5s for a long time, having inherited it from me when I upgraded to the iPhone 6. As happy as she is with the 4-inch form factor, she asked if she could try out my iPhone 6 to see what the bigger screen is like. I obliged, and helped her set up the new device.

As of this writing, it's been roughly two weeks since she switched phones, and her feedback is mixed. She likes that the 6 shows her more stuff and likes the longer battery, but isn't thrilled with the phone's overall size. She often complains that the 6 is harder to hold, especially when using it one-handed. I told her about the reports that Apple is planning to release a modernized version of her old 5s, and her eyes lit up like a kid on Christmas morning. Suffice it to say, the "iPhone SE" will, in all likelihood, be her new phone whenever it comes out.

I mention this anecdote because my girlfriend's views were mine not long ago. There were moments during the year that I used my 6 when I thought about going back to a 4-inch phone, as I longed for the Goldilocks scenario I wrote of earlier. It's fascinating, then, to see us on polar ends of the iPhone spectrum. I've changed my beliefs on giant phones, while she remains steadfast in her beliefs on smaller ones after jumping over the fence for a bit.

As the saying goes, the grass isn't always greener on the other side.

Final Thoughts

Though I put up strong resistance, I've transitioned to the Dark Side Plus Club.

This process of giving the iPhone 6s Plus another chance has been rewarding in a couple of ways. It's not only revealing in terms of appreciating the device, it's also taught me a lot about myself. The key lesson has been to be more honest with myself about which disabilities I should prioritize. My vision impairment and cerebral palsy both affect me every second of every day, but my low vision is the one that is arguably most important. As I wrote earlier, the eyes are how I view the world, and I should accommodate them the best I can. The 6s Plus does that. I've been able to use both phones for a good period, and after careful consideration, I've decided that the 6s Plus is the better phone for me.

As with the 42mm Apple Watch, from now on I can see myself opting for the Plus model iPhone. I'm so glad I decided to give it a second look, because it really is a fantastic device. Moreover, this experience is proof that the iPad Pro is transformative in more ways than one.

As my pal Stephen Hackett put it, Myke was right.


  1. There's a directness inherent to iOS that isn't present in a "legacy" OS like OS X. The former was designed around touch input, whereas the latter was built around keyboard-and-mouse input. Multitouch is the clear accessibility win for myriad reasons, and it's why iOS devices are loved by people of all ages and abilities. It's simply easier to tap and swipe than it is to point and click. That isn't to say someone like me can't use or doesn't like the Mac, just that I prefer an iPad most days. 
  2. Introduced with the iPhone 6 and 6 Plus, iOS has two display options: Standard and Zoom. Standard is the default choice; choosing Zoom will enlarge the entire system. iOS prompts users to select a view during setup, but you can change it at any time by going to Display & Brightness > Display Zoom. (The iPad Pro has this too.) 
  3. I'd be able to see even more detail if the app supported pinch-to-zoom. 
  4. And I had to carry several of them in my backpack to and from school every day. Imagine that. 
16 Mar 06:08

Kevin Williamson, The Father-Führer

Kevin Williamson, The Father-Führer:

Williamson adroitly blames the pro-Trump, downtrodden, poor whites who are one of the most obvious victims of globalization as the source of their own problems. And his solution? People should move away from those hollowed-out communities in rural areas or the former rust belt cities to places where there is work. Just read this:

If you spend time in hardscrabble, white upstate New York, or eastern Kentucky, or my own native West Texas, and you take an honest look at the welfare dependency, the drug and alcohol addiction, the family anarchy — which is to say, the whelping of human children with all the respect and wisdom of a stray dog — you will come to an awful realization. It wasn’t Beijing. It wasn’t even Washington, as bad as Washington can be. It wasn’t immigrants from Mexico, excessive and problematic as our current immigration levels are. It wasn’t any of that. 

Nothing happened to them. There wasn’t some awful disaster. There wasn’t a war or a famine or a plague or a foreign occupation. Even the economic changes of the past few decades do very little to explain the dysfunction and negligence — and the incomprehensible malice — of poor white America. So the gypsum business in Garbutt ain’t what it used to be. There is more to life in the 21st century than wallboard and cheap sentimentality about how the Man closed the factories down. 

The truth about these dysfunctional, downscale communities is that they deserve to die. Economically, they are negative assets. Morally, they are indefensible. Forget all your cheap theatrical Bruce Springsteen crap. Forget your sanctimony about struggling Rust Belt factory towns and your conspiracy theories about the wily Orientals stealing our jobs. Forget your goddamned gypsum, and, if he has a problem with that, forget Ed Burke, too. The white American underclass is in thrall to a vicious, selfish culture whose main products are misery and used heroin needles. Donald Trump’s speeches make them feel good. So does OxyContin. What they need isn’t analgesics, literal or political. They need real opportunity, which means that they need real change, which means that they need U-Haul. 

If you want to live, get out of Garbutt.

His words are cutting – ‘the whelping of human children with all the respect and wisdom of a stray dog’ – but to me this great writing is a front, a façade behind which lies the contempt of the deep conservatives for the poor. 

The poor whites he is spitting on have been severed from the Democratic party, their natural home, by the fissure that the civil rights movement of the ‘60s started and which continues to this day with the intransigent belief in the illegitimacy of Obama and the hatred of the #blacklivesmatter movement. 

We are witnessing the whipsawing of a number of forces, all concentrating in the downward spiral of poor, unassimilated whites, and the rise of Trump’s populist nativism. 

16 Mar 06:06

Access your tax information on the go this year with MyCRA web app

by Rob Attrell

It’s springtime in most of Canada, which means tax season is back again for another year. As more people use mobile phones, mobile tax solutions continue to become increasingly important.

This year, the CRA is debuting a mobile web app, called MyCRA, designed to allow users to access their tax return status, benefit and contribution information, and notices of assessment, with the same level of security (and same password) they use on a desktop computer. According to CRA, over ten thousand returns have been filed with mobile software, a large portion of the two million electronically filed tax returns that occur every year in Canada.

The CRA also certifies third-party tax software for public use, and several iPad apps already qualify, including: TurboTax, SimpleTax, and TaxFreeway. This year, in addition to these apps, the Canada Revenue Agency also certified a new TurboTax iPhone app, as well as the free Fastneasytax and TurboTax for Android.

About 14 percent of TurboTax users accessed their return via mobile last year, and the ability to start a return on your smartphone, and finish later on a tablet or laptop means simple returns can be completed without significant effort, even on the go.

Using the MyCRA app means that any tax owing at the end of the day can be paid online by credit card or even via PayPal, and tax refunds are directly to users’ bank accounts.

The MyCRA app is accessible through mobile smartphone browsers.

SourceMyCRA
ViaCBC
16 Mar 06:06

What’s in My Bag, 2016 edition

by Matt

Many people have been requesting an update to my what’s in my bag post from last year. Almost every single item in the bag has changed, this year has had particularly high turnover. We’re still in a weird teenage period of USB-C adoption, and I hope by next year to have many fewer non-USB-C or Lightning cables. Things with a asterisk * are the same from last year. Without further ado:

  1. This is my favorite item of the new year, a Lululemon Cruiser backpack that has a million pockets both inside and outside, and allows me to carry more stuff, more comfortably, and access it faster. Lululemon updates their products and designs every few months, but if you ever spot something like this online or in the store check it out. Hat tip on this one to Rose.
  2. A short Lightning + micro USB cable, which is great for pairing with a battery pack. I sometimes carry a few of these around and give them away all the time, as “do you have a light?” has evolved to “do you have a charge?” in the new millenium.
  3. Short regular USB to USB-C cable.
  4. Belkin Retractable Ethernet. *
  5. Anker USB-C to USB-C cable. Make sure to read the reviews when you buy these to get the ones that do the proper voltage. I can charge a Macbook with this, and the new Nexus 5x, directly from the battery pack or the #43 wall charger.
  6. Mini-USB cable, which I use for the odd older device (like a Nikon camera) that still does mini-USB (that older big one). Would love to get rid of this one.
  7. A charge cable for #45, the Fitbit Charge HR. You can buy these cheap on Amazon, and if you lose it you’re out of luck, so I usually keep a few at home and one in my bag.
  8. This is my goldilocks regular lightning cable, not too long and not too short, 0.5m.
  9. A retractable micro-USB.
  10. Apple Magic Mouse 2, the new one that charges via Lightning, natch.
  11. Way over to the right, a small Muji notebook.
  12. This is a weird but cool cable, basically bridges USB to Norelco shavers. I use a Norelco beard trimmer and for some reason all of these companies think we want to carry around proprietary chargers, this is a slightly unwieldy cable but better than carrying around the big Norelco power brick.
  13. Lockpick set. *
  14. Lavender mint organic lip balm from Honest Co, which I think I got for free somewhere.
  15. Aesop rosehip seed lip cream, which I bought mostly for the smell, when it’s done I’ll probably switch to their lip balm. (I should do a cosmetics version of this for my dopp kit, it’s had lots of trial and error as well.) I love Aesop, especially their Resurrection line.
  16. Aveda Blue Oil that I find relaxing. *
  17. Short thunderbolt to thunderbolt cable, which is great for transferring between computers. *
  18. Muji international power adapter, much simpler, lighter, and cooler than what I used before.
  19. Way on the top right, this is probably the least-travel-friendly thing I travel with, but the utility is so great I put up with it. It’s the Sennheiser Culture Series Wideband Headset, which I use for podcasts, Skype, Facetime, Zoom, and Google Hangout calls with external folks and teams inside of Automattic. Light, comfortable, great sound quality, and great at blocking out background noise so you don’t annoy other people on the call. Worth the hassle.
  20. A customized Macbook Pro 15″, in space grey, with the WordPress logo that shines through.
  21. Belkin car mount, which is great for rentals. *
  22. A USB 3.0 SD / CompactFlash / etc reader.
  23. microSD to SD adapter, with a 64gb micro SD in it. Good for cameras, phones, and occasionally transferring files. Can be paired with the card reader if the computer has a USB port but not a SD reader. When you get a microSD card it usually comes with this.
  24. One of my new favorite things: DxO One camera. It’s a SLR-quality camera that plugs in directly to the lightning port on your iPhone, and can store the photos directly on your phone. Photo quality is surprisingly good, the only problem I’ve had with it is the lightning port pop-up will no longer close. The other similar device I tried but wasn’t as good was the Olympus Air A01, so I just carry around the DxO now.
  25. TP-LINK TL-WR702N Wireless N150 Travel Router, which works so-so. Not sure why I still carry this, haven’t used it in a while. *
  26. Aukey car 49.5W 3-port USB adapter, which has two high-powered USB ports and a Quick Charge 3.0 USB-C port.
  27. My favorite external battery right now, the RAVPower 20100mAh Portable Charger, also with Quick Charge 3.0 and a USB-C port. This thing is a beast, can charge a USB-C Macbook too.
  28. Kindle Voyage with the brown leather cover. *
  29. Macbook power adapter.
  30. Very cool Sennheiser Momentum Wireless headphones in ivory,customized with the WordPress logo. I’m testing this out as a possible gift for Automatticians when they reach a certain number of years at the company. For a fuller review, see this post.
  31. Cotopaxi water bottle that I got for free at the Summit at Sea conference. The backpack has a handy area to carry a water bottle, and I’ve become a guy who refills water bottles at the airport instead of always buying disposable ones.
  32. Special cord for the #30 Momentum headphones.
  33. Retractable 1/8th inch audio cable. *
  34. Powerbeats 2 Wireless headphones that I use for running, working out, or just going around the city.
  35. Belkin headphone splitter, for sharing audio when watching a movie on a plane. *
  36. Chromecast audio, which I’ve never used but it’s so small and light I carry it around just in case.
  37. Chromecast TV, which I’ve also never used but also small and light and I’m sure it’ll come in handy one of these days.
  38. Verizon iPhone 6s+, which is normal, but the new thing here is I’ve stopped carrying a wallet, and a separate phone case, and now carry this big ‘ol Sena Heritage Wallet Book. At first I felt utterly ridiculous doing this as it feels GINORMOUS at first, but after it wore in a little bit, and I got used to it, it’s so freeing to only have one thing to keep track of, and it’s also forced me to carry a lot less than I used to in my wallet.
  39. Maison Bonnet sunglasses. Hat tip to Tony.
  40. Stickers! Wapuu and Slack.
  41. Bucky eye shades, like an eye mask but has a curve so it doesn’t touch your eyes. I don’t use this often but when I do it’s a life-saver. *
  42. My favorite USB wall plug, after trying dozens, is this Aukey 30W / 6A travel wall charger. I love the foldable plug, and it’s really fast.
  43. I generally only have one wall charger, but temporarily carrying around this Tronsmart 33W USB-C + USB charger with Quick Charge 3.0, which can very quickly charge the battery or the Nexus, and a Macbook in a pinch. Hopefully will combine this and #42 sometime this year. One thing I really dislike about this item is the bright light on it, which I need to cover with tape.
  44. The only pill / vitamin / anything I take every day: Elysium Health Basis. I’m not an expert or a doctor, but read up on them and the research around it, pretty interesting stuff.
  45. Fitbit Charge HR. I gave up on my Apple Watch. I’ll probably try the Fitbit watch when it comes out. My favorite feature is the sleep tracking. Least favorite is the retro screen, and that it doesn’t always show the time.
  46. Double-sided sharpie (thick and thin point) and a Muji pen.
  47. Westone ES49 custom earplugs, for if I go to concerts or anyplace overly loud. *
  48. Some index cards, good for brainstorming.
  49. Passport. * As Mia Farrow said about Frank Sinatra, “I learned to bring my passport to dinner.”
  50. Jetpack notebook, I like to have a paper notebook to take notes, especially in group or product meetings, because there isn’t the distraction of a screen.
  51. Nexus 5x, which is definitely one of the better Android devices I’ve had, paired with Google Project Fi phone / data service, which has saved me thousands of dollars with its $10/gb overseas data pricing. Since my iPhone is so huge, I tried to go for a smaller Android device. I always travel with both in case something happens to one phone, for network diversity, and as I said this has better international data pricing than Verizon.
  52. Business card holder. *
  53. Post-it notes.

All in all 13 items stayed the same, the other 40 are new to this edition.

That’s a wrap, folks! If you have any questions or suggestions please drop them in the comments. Once my no-buying-things moratorium for Lent is over I can start trying new things out again.

Update 2016-03-26: A few people have asked how much the bag weighs with all of this stuff in it. I didn’t weigh it at the time of the photo, but at the airport the other day I put it on the luggage scale and it came in at 16 pounds, which is probably close enough. The pockets on the Lululemon backpack distribute the “stuff” pretty well and it doesn’t feel heavy at all, and doesn’t stick out too far on my back.

16 Mar 06:04

Mozilla Pushes the Web to New Levels as a Platform for Games

by David Bryant

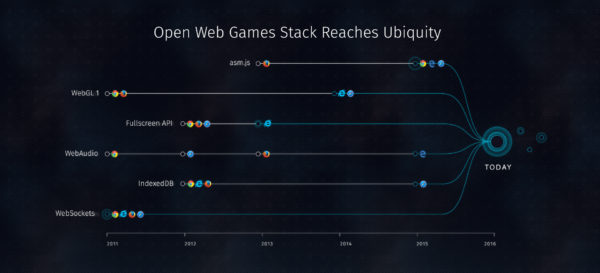
The Web is the platform for game development and we’ll be showing it in action at this year’s Game Developer Conference in San Francisco. Powerful new capabilities continue to emerge and gain mindshare with developers and gamers alike as the open Web games stack reaches ubiquity.

  • Technologies pioneered by Mozilla, such as WebGL, WebVR and asm.js are all gaining momentum.
  • Today, WebAssembly, the next evolution of asm.js, is available as an experiment for testing in Firefox Nightly.
  • Launching this week at GDC, Open Web Games is a site for developers and browser makers to demonstrate modern Web game technologies, stress-test browser implementations and collaborate on maintaining the stability and evolution of the Web games stack over time using a variety of real-world games and demos.
  • Next generation Web technologies such as WebGL 2, SIMD.js and Shared Array Buffer are also now available for anyone to explore in Firefox Nightly.
  • To advance WebVR, Mozilla recently announced version 1.0 of the WebVR API proposal.
  • Mozilla is investing in helping developers move titles based on plugins to Web technologies through the Mozilla Developer Network (MDN) and direct engineering support.

Over the last year the industry has continued to demonstrate its support for the open Web stack:

  • Unity, one of the largest and best-regarded game engines in the industry, showed that the Web stack is ready for prime time by removing the ‘Preview’ label from their amazing WebGL exporter which takes advantage of WebGL and asm.js.
  • Autodesk, a leader in 3D design and animation tools, is showing a tech preview of Web export support with its Stingray game engine.
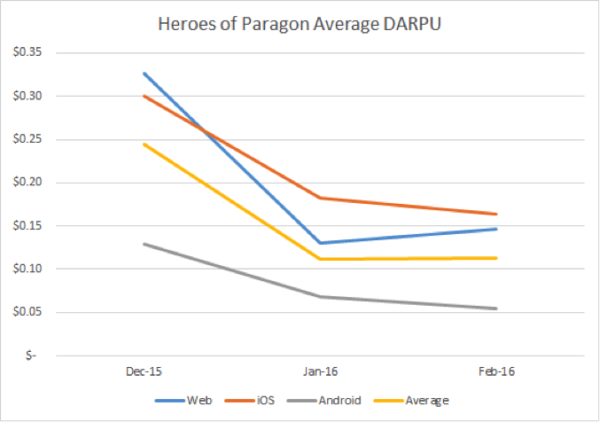
  • Indy mobile developers like EVERYDAYiPLAY are expanding their revenue streams by building for the Web with games like Heroes of Paragon. They report Daily Average Revenue per User (DARPU) numbers that are much better for the Web version of their game than the Android Play store and are very competitive, relative to iOS.

EVERYDAYiPLAY-DARPU

  • Major browsers have adopted more of the key APIs needed to enable the next generation of Web games. The industry’s top brands are coming out with growing support for the Web, making it easier than ever for developers to create for and succeed on the Web platform.

timelineFor more information:

  • If you’re at GDC, come see us at booth 936 on the Lower Level of the South Hall.
  • If you’re a member of the press and have a question, please email press@mozilla.com and we’ll help you out.
  • To learn more about what Mozilla is doing at GDC, read articles from developers or learn how to get involved, please visit games.mozilla.org.
16 Mar 06:03

A “wish you were here” video

by michaelkluckner

The Arbutus Corridor in 2040 … just kidding. A video from Facebook of the Beijing subway, linked here. 人太多了, as the Mandarin expression has it: “there are too many people.”

beijingsubway


16 Mar 06:03

The Amazon Tax

by Ben Thompson

Ten years ago yesterday Amazon evangelist Jeff Barr posted a 222-word post on the Amazon Web Services Blog1 that opened:

Earlier today we rolled out Amazon S3, our reliable, highly scalable, low-latency data storage service.

Until then Amazon Web Services had primarily been about providing developers with a way to tap into the Amazon retail store; S3, though, had nothing at all to do with retail,2 at least not directly.

The Origin of AWS

As Brad Stone detailed in The Everything Store, by the early 2000s Amazon was increasingly constrained by the fact the various teams in the company were all served by one monolithic technical team that had to authorize and spin up resources for every project. Stone wrote:

At the same time, Bezos became enamored with a book called Creation, by Steve Grand, the developer of a 1990s video game called Creatures that allowed players to guide and nurture a seemingly intelligent organism on their computer screens. Grand wrote that his approach to creating intelligent life was to focus on designing simple computational building blocks, called primitives, and then sit back and watch surprising behaviors emerge.

The book…helped to crystallize the debate over the problems with the company’s own infrastructure. If Amazon wanted to stimulate creativity among its developers, it shouldn’t try to guess what kind of services they might want; such guesses would be based on patterns of the past. Instead, it should be creating primitives — the building blocks of computing — and then getting out of the way. In other words, it needed to break its infrastructure down into the smallest, simplest atomic components and allow developers to freely access them with as much flexibility as possible.

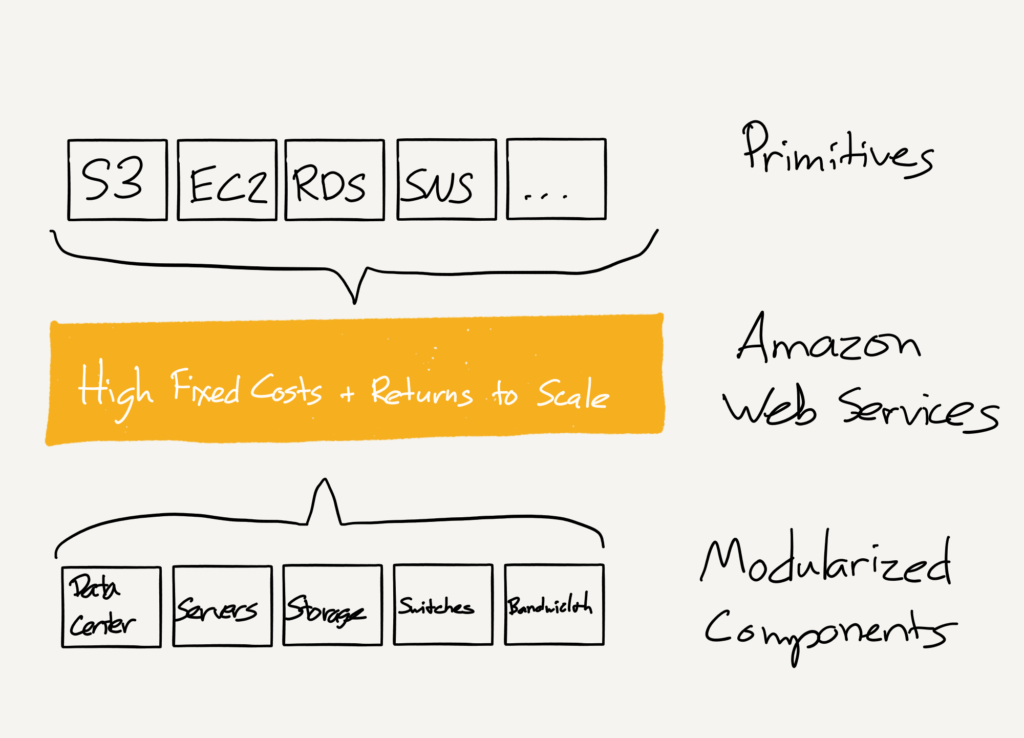
The “primitives” model modularized Amazon’s infrastructure, effectively transforming raw data center components into storage, computing, databases, etc. which could be used on an ad-hoc basis not only by Amazon’s internal teams but also outside developers:

stratechery Year One - 274

This AWS layer in the middle has several key characteristics:

  • AWS has massive fixed costs but benefits tremendously from economies of scale
  • The cost to build AWS was justified because the first and best customer is Amazon’s e-commerce business
  • AWS’s focus on “primitives” meant it could be sold as-is to developers beyond Amazon, increasing the returns to scale and, by extension, deepening AWS’ moat

This last point was a win-win: developers would have access to enterprise-level computing resources with zero up-front investment; Amazon, meanwhile, would get that much more scale for a set of products for which they would be the first and best customer.

The AWS Tax

To say that AWS succeeded in its mission is a wild understatement: the impact on developers is exactly what AWS head Andy Jassy wrote in his vision statement. Stone summarized thusly:

The paper laid out the expanded AWS mission: “to enable developers and companies to use Web services to build sophisticated and scalable applications”…

“We tried to imagine a student in a dorm room who would have at his or her disposal the same infrastructure as the largest companies in the world,” Jassy says. “We thought it was a great playing-field leveler for startups and smaller companies to have the same cost structure as big companies.”

It was, and nearly every startup of note to be founded in the last several years has started on AWS or one of its competitors. The true measure of AWS’ impact, though, was the way it transformed the ecosystem around developers, including venture capital.

The effect on Amazon has been equally significant: I detailed last year how the revelation of AWS’ financial results was effectively a Facebook-level IPO, and subsequent earnings reports in which AWS has demonstrated the power of scale — increased revenue plus increased margins — have only solidified the fact that AWS will be a substantial driver of Amazon’s revenue and (eventual!) profits for a long time to come. Social+Capital Founder Chamath Palihapitiya, when asked what company he would invest in if he could only choose one, responded on Quora:

AWS is a tax on the compute economy. So whether you care about mobile apps, consumer apps, IoT, SaaS etc, more companies than not will be using AWS vs building their own infrastructure. Ecommerce was AMZN’s way to dogfood AWS, and continue to do so so that it was mission grade. If you believe that over time the software industry is a multi, deca-trillion industry, then ask yourself how valuable a company would be who taxes the majority of that industry? 1%, 2%, 5% — it doesn’t matter because the numbers are so huge — the revenues, profits, profit margins etc. I don’t see any cleaner monopoly available to buy in the public markets right now.

The monopoly Palihapitiya is referring to is based on the scale effects I noted above: the larger AWS becomes, the greater advantage Amazon has in pricing AWS’ services, which means they can earn ever more business, which increases their advantage even more. The net result is that for all but the largest cloud-based companies3 this advantage, combined with the flexibility AWS affords (which is critical both operationally and financially), will lead to the inevitable conclusion that Amazon ought to service all their infrastructure needs; the payments they make for this service are Palihapitiya’s “tax”.

What is worth considering, though, is the possibility that just as AWS’ effect on developers spread out into the broader startup ecosystem, it increasingly seems that AWS’ impact on Amazon itself goes far beyond its already substantial contribution to the bottom line. Amazon may have started as, to use Stone’s title, “The Everything Store,” but its future is to be a tax collector for a whole host of industries that benefit from the economies of scale, and AWS is the model.

The Transformation of Amazon’s E-Commerce Business

Longtime readers will recall that I went through my Amazon bear phase4 back in 2014; it was AWS that led me to recant. Even when I recanted, though, I argued that my bearish analysis about Amazon’s e-commerce business had been sound:

  • Amazon’s “Media” business of books, CDs, DVDs, and video games was providing the vast majority of “profits”, but this business was shrinking as a percentage of Amazon’s total sales and, given secular trends in media, likely to continue to shrink on an absolute basis
  • “Electronics and General Merchandise”5 was growing rapidly, but the nature of goods being sold meant there was relatively little margin to be had

What, though, if Amazon is content with making no margin on the sale of “Electronics and General Merchandise”? I don’t mean this in the Mathew Yglesias sense, that Amazon “is a charitable organization being run by elements of the investment community for the benefit of consumers”; rather, what if the business model of Amazon’s e-commerce business has changed to “tax” collection?

Consider Costco: last year the wholesale retailer had net income of $2.3 billion on sales of $114 billion to its over 81 million members; the total sum of membership fees was $2.5 billion. In other words, Costco’s 11% gross margin didn’t even quite cover the cost of running the business; the difference, along with all of the profit, came from a “tax” levied on Costco customers.

I would contend Prime memberships play the same role for Amazon: the non-AWS parts of the business last year generated $2.6 billion in operating profit;6 meanwhile, Consumer Intelligent Research Partners (CIRP) estimates that Amazon now has 54 million Prime members, which at $99/member would generate $5.3 billion in revenue; the difference in profitability for Amazon’s e-commerce business, such as it is, comes from a “tax” levied on Amazon’s best customers.

In fact, though, I think even this analysis is too narrow: e-commerce is inexorably taking over more and more of the U.S. retail sector in particular, and Amazon is taking over 50% of that e-commerce growth. Combine this reality with the growth in Prime and Amazon is effectively on its way towards collecting a tax on all of retail.

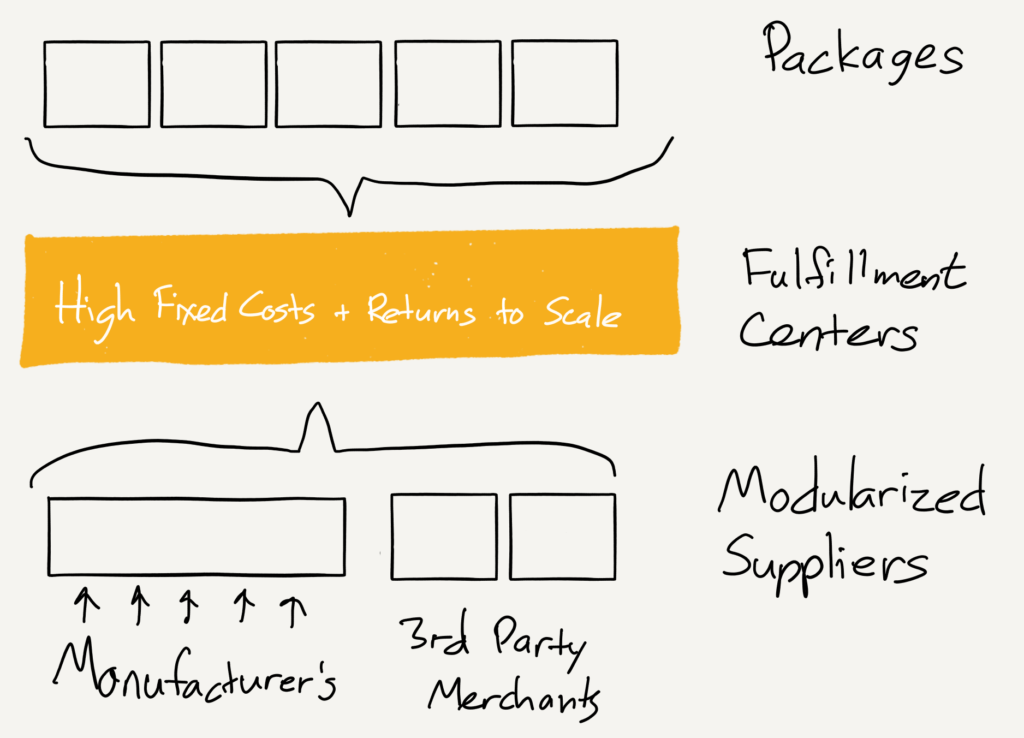
Again, though, just as is the case with AWS, this tax is one that consumers willingly embrace: Prime is a super experience with superior prices and superior selection, and it too feeds into a scale play. The result is a business that looks like this:

stratechery Year One - 275

That is, of course, the same structure as AWS — and it shares similar characteristics:

  • E-commerce distribution has massive fixed costs but benefits tremendously from economies of scale
  • The cost to build-out Amazon’s fulfillment centers was justified because the first and best customer is Amazon’s e-commerce business
  • That last bullet point may seem odd, but in fact 40% of Amazon’s sales (on a unit basis) are sold by 3rd-party merchants; most of these merchants leverage Fulfilled-by-Amazon, which means their goods are stored in Amazon’s fulfillment centers and covered by Prime. This increases the return to scale for Amazon’s fulfillment centers, increases the value of Prime, and deepens Amazon’s moat

The “tax” analogy extends beyond Prime; for example, Amazon is taking a portion of these 3rd-party sales, and a greater portion of revenue from goods they sell directly. The effect, though, is consistent: Amazon is collecting a “tax” on a massive industry and no one minds because Amazon’s scale ensures the best prices and the best experience.

Logistics and the Echo

It seems increasingly clear that Amazon intends to repeat the model when it comes to logistics: after experimenting with six planes last year the company recently leased 20 more to flesh out its private logistics network; this is on top of registering its China subsidiary as an ocean freight forwarder. No surprise that, as the Wall Street Journal noted:

In a securities filing, Amazon for the first time identified “companies that provide fulfillment and logistics services for themselves or for third parties, whether online or offline” as competition. And it referred to itself as a “transportation service provider.” In both cases, it marked the first time Amazon included such language in its annual report, known as a 10-K.

So how might this play out?

Well, start with the fact that Amazon itself would be this logistics network’s first-and-best customer, just as was the case with AWS. This justifies the massive expenditure necessary to build out a logistics network that competes with UPS, Fedex, et al, and most outlets are framing these moves as a way for Amazon to rein in shipping costs and improve reliability, especially around the holidays.

However, I think it is a mistake to think that Amazon will stop there: just as they have with AWS and e-commerce distribution I expect the company to offer its logistics network to third parties, which will increase the returns to scale, and, by extension, deepen Amazon’s eventual moat.7

The much-buzzed about Echo fits this model too: all of the usual suspects can build out the various pieces of the connected home; Amazon will simply provide the linchpin, the Echo’s cost a “tax” on the connected home.

A Primitive Organization

Bezos’ famed 1997 shareholder letter makes clear the roots of this model were in place from the beginning. Specifically, Bezos is very focused on the power of scale:

The stronger our market leadership, the more powerful our economic model. Market leadership can translate directly to higher revenue, higher profitability, greater capital velocity, and correspondingly stronger returns on invested capital…we choose to prioritize growth because we believe that scale is central to achieving the potential of our business model.

It’s equally clear, though, that Bezos didn’t then fully appreciate that his model would extend far beyond e-commerce; that, though, is why Amazon’s internal organization is such a strength. The company is organized with multiple relatively independent teams, each with their own P&L, accountabilities, and distributed decision-making. Stone explains an early Bezos initiative (emphasis mine):

The entire company, he said, would restructure itself around what he called “two-pizza teams.” Employees would be organized into autonomous groups of fewer than ten people — small enough that, when working late, the team members could be fed with two pizza pies. These teams would be independently set loose on Amazon’s biggest problems…Bezos was applying a kind of chaos theory to management, acknowledging the complexity of his organization by breaking it down to its most basic parts in the hopes that surprising results might emerge.

Stone later writes that two-pizza teams didn’t ultimately make sense everywhere, but as he noted in a follow-up article the company remains very flat with responsibility widely distributed. And there, in those “most basic parts”, are the primitives that lend themselves to both scale and experimentation. Remember the quote above describing how Bezos and team arrived at the idea for AWS:

If Amazon wanted to stimulate creativity among its developers, it shouldn’t try to guess what kind of services they might want; such guesses would be based on patterns of the past. Instead, it should be creating primitives — the building blocks of computing — and then getting out of the way.

Steven Sinofsky is fond of noting that organizations tend to ship their org chart, and while I began by suggesting Amazon was duplicating the AWS model, it turns out that the AWS model was in many respects a representation of Amazon itself (just as the iPhone in many respects reflects Apple’s unitary organization): create a bunch of primitives, get out of the way, and take a nice skim off the top.

  1. Hosted on Typepad
  2. Contrary to popular myth, Amazon was not selling excess capacity
  3. I will discuss Dropbox’s recent announcement that they are moving away from AWS in tomorrow’s Daily Update
  4. It’s like puberty for tech analysts
  5. This nomenclature is from Amazon’s financial reports
  6. This isn’t comparable to the Costco number which was net income
  7. To be sure, UPS, Fedex, et al have a big head start, but their networks and cost structures are focused on businesses; Amazon will focus on consumers
15 Mar 14:34

Samsung Galaxy S6 Is Still Solid But We’re Waiting To See the S7

by Jeb Brilliant

Samsung Galaxy S7 WaterproofWith the Samsung Galaxy S7 just being released there have been a ton of commercials online and on TV which have convinced me to do more than play with the S6. I used the AT&T Galaxy S6 all weekend and have been really enjoying the experience.

Samsung missed a few things with the S6 that have been covered to no end, lack of replaceable battery and memory. That being said everything else about the phone is right on. I’ve really enjoyed the feel of the phone but more than that I am in LOVE with the camera. This thing is quick and with the pro settings available to the user it is taking things to the next level. Some people believe it over corrects the color but many others appreciate not having to do any post production work on the shots.

As a whole, the S6 is still a solid camera and phone but everybody including myself is super excited to see what the S7 brings to the masses. With the Summer coming being water repellent is a BIG deal. Will it beat the iPhone 6S camera and it’s predecessor the Galaxy S6? We’ll have to wait and see.

15 Mar 14:33

Student Engagement

files/images/06GLu23S7qU24chy9.png


Kelly Christopherson, The Synapse, Mar 17, 2016


Interestimng discussion of student engagement. "Are we preparing students for today? Are we engaging them in a discussion about what is happening in the present? Too often the mantra is “ Prepare for the Future” . In some respects, today isn’ t even close to what I thought it was going to be 10 years ago. In other way, it is." Now there are aspects of this discussion I don't exactly agree with - including, for example, the observation that "The current focus on the state of education on a global scale is on what teachers do in the classroom." This is the sort of thinking we need to get away from. It's not what the teacher does that is important. It's what the student does.

[Link] [Comment]
15 Mar 14:33

The Tau Manifesto

files/images/pi-tau-02.jpg


Michael Hartl, Mar 17, 2016


OK, I'm no mathematician. But this article has me convinced. "Pi (π ) is a pedagogical disaster. Try explaining to a twelve-year-old (or to a thirty-year-old) why the angle measure for an eighth of a circle— one slice of pizza— is π /8. Wait, I meant π /4. See what I mean? It’ s madness— sheer, unadulterated madness." The author proposes instead that we use Tau (τ ) which has the value 2π , or 6.283185307179586… It creates a lot more symmetry in formulae across a range of mathematics. That, by the way, would make Tau Day (to Americans, at least) June 28.

[Link] [Comment]
15 Mar 14:33

Xiaomi Is Expanding Their Smart Transport Empire With Bicycles

by Cate Cadell

After tackling Segway-style smart transport last year, Xiaomi Inc. now has plans to expand further into smart bikes.

The company will release a new Xiaomi-brand smart bike in the coming months, according to sources who spoke to the Wall Street Journal. At the same time Xiaomi-backed smart bicycle company IRiding will also release a ‘smart’ bike called the ‘QiCycle’ this week, the same source revealed.

A Xiaomi spokesperson declined to confirm details about either upcoming project.

The IRiding project is aimed at the high-end consumer market, a departure from Xiaomi’s quality-on-a-budget marketing strength. The bicycle will retail for $3000 US, and will be assembled in Taiwan, the manufacturing centre for brand-name bicycles. The IRiding project will not carry the Xiaomi brand.

IRiding isn’t the only bicycle startup being groomed as part of Xiaomi’s investment machine. In October last year Xiaomi invested in an A Series for Hangzhou-based smart bike maker Yunmake. By December the partnership had unveiled their first smart electric bike, the YunBike C1, which featured a Xiaomi-like minimalist design. The model has a 180W gearbox can reach up to 25km/hour, according to the company.

“This new hybrid vehicle is intended to modify the concept of the electric bicycle,” said Xiaomi at the time.

It’s not clear which acquisition Xiaomi would potentially draw on for the release of their next smart bike model, though it is likely to be a design that is in keeping with the company’s budget-friendly branding philosophy.

In April 2015 Xiaomi-backed Ninebot acquired Segway, the brand synonymous with the two-wheeled personal transportation device. Xiaomi has since leveraged the design relationship to release the wallet-friendly Xiaomi Ninebot Mini, a $315 USD stripped-back Segway-style device with leg controls instead of a handle.

The smart bike, scooter and transportation device market in China is booming alongside other core hardware technologies including drones and VR headsets. A mass of startups have entered the space, however powerhouses like Xiaomi have driven down costs with high-level acquisitions supported by mass manufacturing.

Image Credit: The Xiaomi YunBike C1, released last December.


15 Mar 14:32

Online Gaming – Cat among pigeons

by windsorr

Reply to this post

RFM AvatarSmall


Microsoft cleverly puts Sony in a very difficult position.

  • Microsoft has announced that Xbox Live members will now be able to play games with members from other gaming networks such as the PC as well as other consoles.
  • This has been coming for some time as Windows 10 devices all share elements of commonality that makes enabling this feature much more straight forward.
  • Consequently multiplayer between PC and Xbox has been on the cards for a while but it is the possibility of multiplayer gaming between Xbox and PlayStation that has really set the cat among the pigeons.
  • Xbox Live and PlayStation Network have for years been fierce competitors as the console purchase decision has in part been driven by which multiplayer network the user’s friends are on.
  • With this change, Microsoft is offering to create a single huge gaming network so that any player can play with anyone else as long as they are running the same version of the same game.
  • From its current position, Microsoft has very little to lose and everything to gain as its missteps in marketing the Xbox One at launch cost it dear.
  • RFM estimates that the Xbox Live network has about 49m users while PlayStation Network has 93m.
  • A reason for this is that PlayStation 4 has substantially outsold Xbox One since its launch.
  • This gives a huge advantage to PlayStation as Metcalf’s law of networking states that there is an exponential relationship between the size of a network and the value that it can create.
  • Consequently, I estimate PlayStation Network is 4-5 times more valuable than Xbox Live.
  • This is why it makes perfect sense for Microsoft to extend this olive branch to Sony as it has far more to gain than Sony does.
  • However, the ones that benefit most of all will be the users of these networks which is why I expect Sony to come under intense pressure to take Microsoft up on its offer.
  • This puts Sony in a very difficult position because although the overall value of its network will increase with 50m more users, Microsoft’s will increase much more.
  • This is why I suspect that Sony will refuse to make PlayStation Network available to Xbox Live although I suspect that this is a mistake.
  • Sony has done very well in this generation of console but in the next generation I see it being at huge risk (see here)
  • This is because consoles are increasingly becoming part of the digital ecosystem where user experience, software and services matter.
  • This is something to which Sony has aid almost no attention as the user experience on the PlayStation 4 was clearly designed by an engineer.
  • The result is an awful user experience where the user simply wants to start playing the game as quickly as possible and has almost no interest in anything else that the console might have to offer.
  • By contrast, Microsoft has put a lot of effort into its user experience which actively encourages users to explore and see what else is available.
  • I think that in the next generation, this is going to be a major factor in the user’s purchase decision and consequently Sony is at great risk.
  • However, if Sony was to embrace global multiplayer gaming it might just signal that it has understood the importance of the ecosystem and will be fixing the shortcomings in its current product.
  • Unfortunately, Sony has a long history of losing commanding market share positions resulting from choosing to further its own ends against the interests of its customers.
  • I fear that very little has changed and that Sony may go the way of Sega in the next generation.
15 Mar 14:32

Safety in the Cloud

files/images/35315419_thumb5_690x400.gif


David Burg, Tom Archer, Strategy+Business, Mar 18, 2016


Instead of putting up a shield, argues this article, cybersecurity can be found in deep data analytics. "It would defend itself by monitoring activity across all its online systems, studying not just the moves of hackers but the actions of legitimate customers as well." The key to this, write the authors, is to put data into the cloud, and specifically "offerings such as Google Cloud Platform, Amazon Web Services, and Microsoft’ s Azure." These companies have made major investments in data monitoring and use analysis. They can watch every interaction, every keystroke, and detect intrusion before it happens using pattern recognition. All very good - but who watches the watchers?

[Link] [Comment]
15 Mar 14:32

Using Regular Expressions to Filter Tweets Based on the Number of Times a Pattern Appears Within Them

by Tony Hirst

Every so often, it’s good to get a little practice in  using regular expressions… Via the wonderful F1 Metrics blog, I noticed that the @f1debrief twitter account had been tweeting laptimes from the F1 testing sessions. The data wasn’t republished in the F1metrics blog (though I guess I could have tried to scrape it from the charts) but it still is viewable on the @f1debrief timeline, so I grabbed the relevant tweets using the Twitter API statuses/user_timeline call:

response1 = make_twitter_request(twitter_api.statuses.user_timeline, 
                                screen_name='f1debrief',count=200,exclude_replies='true',trim_user='true',
                               include_rts='false',max_id='705792403572178944')
response2 = make_twitter_request(twitter_api.statuses.user_timeline, 
                                screen_name='f1debrief',count=200,exclude_replies='true',trim_user='true',
                               include_rts='false',max_id=response1[-1]['id'])
tweets=response1+response2

The tweets I was interested in look like this (and variants thereof):

F1_Debrief___f1debrief____Twitter

The first thing I wanted to do was to limit the list of tweets I’d grabbed to just the ones that contained a list of laptimes. The way I opted to do this was to create a regular expression that spotted patterns of the form N.NN, and then select tweets that had three or more instances of this pattern. The regular expression .findall method will find all instances of the specified pattern in a string and return them in a list.

import re

regexp = re.compile(r'\d\.\d')

#reverse the order of the tweets so they are in ascending time order
for i in tweets[::-1]:
    if len(re.findall(regexp, i['text']))&amp;gt;=3:
        #...do something with the tweets containing 3 or more laptimes

Inspecting several of the timing related tweets, they generally conform to a pattern of:

  • first line: information about the driver and the tyres (in brackets)
  • a list of laptimes, each time on a separate line;
  • an optional final line that typically started with a hashtag

We can use a regular expression match to try to pull out the name of the driver and tyre compound based on a common text pattern:

#The driver name typically appears immediately after the word του
#The tyre compound appears in brackets
regexp3 = re.compile('^.* του (.*).*\s?\((.*)\).*')
#I could have tried to extract drivers more explicitly from a list of drivers names I knew to be participating

#split the tweet text by end of line character
lines=i['text'].split('\n')

#Try to pull out the driver name and tyre compound from the first line
m = re.match(regexp3, lines[0])
if m:
    print('',m.group(1).split(' ')[0],'..',m.group(2))
    #There is occasionally some text between the driver name and the bracketed tyre compound
    #So split on a space and select the first item
    dr=m.group(1).split(' ')[0]
    ty=m.group(2)
else:
    dr=lines[0]
    ty=''

For the timings, we need to do a little bit of tidying. Generally times were of the form N:NN.NN, but some were of the form NN.NN. In addition, there were occasional rogue spaces in the timings. In this case, we can use regular expressions to substitute on a particular pattern:

for j in lines[1:]:
            j=re.sub('^(\d+\.)','1:\\1',j)
            j=re.sub('^(\d)\s?:\s?(\d)','\\1:\\2',j)

The final code can be found in this gist and gives output of the form:

f1test2016__txt_and_notebooks

There are a few messed up lines, as the example shows, but these are easily handled by hand. (There is often a trade-off between fully automating and partially automating a scrape. Sometimes it can be quick just to do a final bit of tidying up in a text editor.) In the example output, I also put in an easily identified line (starting with == that shows the original first line of a tweet (it also has the benefit of making it easy to find the last line of the previous tweet, just in case that needs tidying too…) These marker lines can easily be removed from the file using a regular expression pattern as the basis of a search and replace (replacing with nothing to delete the line).

So that’s three ways of using regular expressions – to count the occurrences of a pattern and use that as the basis of a filter; to extract elements based on pattern matching in a string; and as the basis for a direct pattern based string replace/substitution.


15 Mar 14:31

Wind Mobile goes back to the year 2000 and releases the PCD Z219

by Ian Hardy

Wind is bringing back a blast from the past. While this phone is incredibly basic in its looks and features, it will probably sell like wildfire.

Wind Mobile has released an uber entry level candy bar phone called the PCD Z219. This device runs Necleus OS and has large buttons, features a 1.77-inch QQVGA display, can hold up to 16GB of memory with a microSD card, features an 800 mAh battery, and a camera with dual front and rear 0.3 MP shooters.

The PCD Z219 is priced affordably at $49 outright.

Source Wind Mobile
15 Mar 14:31

Greater access to clean water

by Nathan Yau

Access to clean water

National Geographic, in collaboration with Bestiario, looks at the improving accessibility to clean water around the world.

In 1990, as part of the Millennium Development Goals, the UN set a target to halve the proportion of people without access to safe drinking water. The world hit this goal in 2010, and as of 2015, some 90 percent of the world’s people now have access to “improved” water—water from sources such as pipes or wells that are protected from contamination, primarily fecal matter.

There’s still a lot of work to do though. In some places, such as Haiti and Mongolia, conditions worsened from a percentage perspective and about of third of the populations still don’t have access.

Tags: bestiario, National Geographic, water

15 Mar 14:24

Dropbox’s Exodus From the Amazon Cloud Empire

by Federico Viticci

Cade Metz published a Dropbox profile for Wired, detailing how the company migrated to their own storage infrastructure:

Cowling and crew started work on the Magic Pocket software in the summer of 2013 and spent about six months building the initial code. But this was a comparatively small step. Once the system was built, they had to make sure it worked. They had to get it onto thousands of machines inside multiple data centers. They had to tailor the software to their new hardware. And, yes, they had to get all that data off of Amazon.

The whole process took two years. A project like this, needless to say, is a technical challenge. But it’s also a logistical challenge. Moving that much data across the Internet is one thing. Moving that many machines into data centers is another. And they had to do both, as Dropbox continued to serve hundreds of millions of people. “It’s like a moving car,” says Dan Williams, a former Facebook network engineer who oversaw much of the physical expansion, “and you want to be able to change a tire while still driving.” In other words, while making all these changes, Dropbox couldn’t very well shut itself down. It couldn’t tell the hundreds of millions of users who relied on Dropbox that their files were temporarily unavailable. Ironically, one of the best measures of success for this massive undertaking would be that users wouldn’t notice it had happened at all.

People who are really serious about cloud storage should make their own hardware and software, I guess.

15 Mar 14:24

Google’s internal name for Android N is New York Cheesecake

by Igor Bonifacic

It will be another couple of months before we know the official name of Android N, but in the meantime there’s one name you can cross off the list of potential candidates: New York Cheesecake.

On the Android Open Source Project (AOSP), an online repository for Android source code, developers from Google can be seen calling the latest version of the company’s operating system “nyc-dev”. According to Android Police, NYC is an abbreviation for New York Cheesecake.

As in the past, Google has decided to use a treat with three words in its name as a codename for the latest version of its mobile OS. Most recently, Android Marshmallow was referred to as Macadamia Nut Cookie (MNC) within the company. Prior to that, the Android’s software engineers called Lollipop Lemon Meringue Pie (LMP) and KitKat Key Lime Pie (KLP) between themselves. It’s also the company’s practice to change an internal name before final release.

The developer preview of Android N can be downloaded right now — either via a factory image or an over-the-air update after joining the Android Beta Program.

Check out our video overview of the latest and greatest version of Android.

Lead image courtesy of Flickr user vnysia.

14 Mar 17:48

Deals: The Moto X Pure Edition is down to $300 (from $400)

by WC Staff

Best Deals: The customizable Android phablet pick in our guide on the best Android smartphones, the Moto X Pure Edition, is down to $300 (from $400). [Motorola]

14 Mar 17:48

Let Rapper Lil Wayne convince you to buy a Galaxy S7

by Igor Bonifacic

When it comes to selling smartphones, celebrity endorsements are a tricky proposition. Take HTC, for example. The company likely spent a significant amount of money in 2015 to hire Robert Downey Jr to promote the launch of the One M9. Like so many things related to the M9, those commercials were more or less a complete dud.

The latest smartphone maker to hire a celebrity to promote its new phones is Samsung. Surprisingly, the result is a set of commercials that are actually pretty good. Not laugh out loud funny maybe, but definitely clever.

The Korean company tapped Lil Wayne, as well as Wesley Snipes, to star in a number of ads devoted to the recently released Galaxy S7 and S7 edge. In the first spot, titled “Champagne Calls”, the rapper pours sparkly on his new S7 and boasts to his buddies that their phones can’t survive the same punishment. Of course, if you watch the video carefully, you’ll notice it says “do not attempt.” Still, the ad gets the point across well enough: the S7 and S7 edge can survive accidentally spills.

The company has so far released there commercial featuring Lil Wayne, as well as a set of ads that focus more on the functional aspects of the phone, mainly its impressive lowlight camera performance and curved form factor. My personal favourite is the one titled “The Dark,” which highlight’s the S7 superb camera.

Check out the rest of the ads on Samsung’s YouTube channel.

What do you think of the commercials? Tell us in the comments.

Related reading: Samsung Galaxy S7 and S7 edge review: An act of refinement