Demonstrators walk to the Idaho Capitol carrying anti-abortion signs on April 5, 2023.
Photo: Sarah A. Miller/Idaho Statesman/Tribune News Service via Getty Images
The dream of many far-right pro-natalists came true on Wednesday, when Idaho became the first state to restrict interstate travel for abortion. Abortion is already almost entirely prohibited in Idaho; the new law makes it illegal to help minors travel out of state to receive abortion care without parental consent.
The legislation sits at the intersection of many of Republicans’ preferred sites of oppression today: the criminalization of pregnancy, extreme attacks on bodily autonomy, and the total decimation of young people’s liberty, all under the manufactured pretext of so-called parental rights.
Idaho’s new law sets yet another grim precedent by bringing a whole new category of crime into being: “abortion trafficking.” The law defines “abortion trafficking” as anyone “recruiting, harboring, or transporting the pregnant minor within this state” to obtain an abortion without parental permission. That could mean driving a minor across state lines to receive an abortion, but it also criminalizes any adult who helps a minor access abortion medication within the state, like taking a pregnant teen to the post office to pick up abortion pills ordered online. A person found guilty of the newly fashioned crime could spend up to five years in prison.
Idaho Republicans were sure to borrow from other states’ cruelest strategies for attacking bodily autonomy. Echoing the vigilante-enforced abortion ban first introduced in Texas in 2021, the new Idaho law allows any family member of the fetus or any man who impregnates someone, including by rape, to sue abortion providers. Lawmakers explicitly agreed on an amendment to remove a preexisting exemption that prevented rapists from filing such suits.
Of course, banning interstate travel directly would raise major constitutional issues. But just as the bounty-hunter laws were deviously designed to evade federal court challenges, the “abortion trafficking” law only criminalizes the time spent traveling with a pregnant minor within the state of Idaho, thus invoking a de facto ban on obtaining an abortion in neighboring states like Oregon, Washington, and Montana. Planned Parenthood already announced that it would challenge the ban in court.
The law puts at immediate risk many thousands of teenagers who might become pregnant and lack supportive parents or legal guardians. Any adults who would help them are now deemed criminals. And while Idaho’s extremely strict abortion ban does have a technical exception for incest and rape, it only applies if the crime is reported to law enforcement. For a vast array of reasons, many victims of rape and incest do not report their assaults to the police; this is especially the case when it comes to child victims, whose abusers may in fact be their own parents. Thanks to the new “abortion trafficking” law, it is now a crime to assist such a child, impregnated by rape or incest, in ending that pregnancy.
Like the GOP’s obscene, eliminationist attacks on trans youth nationwide, the Idaho law is framed as in the interest of protecting children and the rights of their parents. In practice, these laws clarify the Republican vision of what children should be: devoid of autonomy and reduced to the status of parental property, if, and only if, that parent is deemed the appropriate political subject. The supportive parents of trans children, for example, are considered to be unfit bearers of parental rights, as Texas policy dictates they be investigated as potential child abusers. Meanwhile, the rights of parents who refuse to help their child access an abortion — that is, parents who force a child to carry a pregnancy to term and give birth — are explicitly protected by Idaho’s new law.
What the bill in fact does is ensure that right-wing parents are able to enforce the conservative state’s political will on their children’s bodies.
Idaho Republican State Rep. Barbara Ehardt, who sponsored the “abortion trafficking” bill, told reporters that it “gives us the tools to go after those who would subvert a parent’s right to be able to make those decisions in conjunction with their child.”
What the bill in fact does is ensure that right-wing parents are able to enforce the conservative state’s political will on their children’s bodies. And while it’s true that parents who support their child’s right to an abortion will be able to act on this, if they have the resources to organize out-of-state travel, the structural problem is the same: Public, communal care for reproductive health and freedom is criminalized.
Insistence on highly selective, white-supremacist parental rights is a cynical Republican base-baiting strategy. But it also expresses a deadly serious commitment to the logic of austerity when it comes to stripping away health care provisions and crushing the possibility of robust communities of care, in which bodily autonomy and sovereignty — including that of children — is respected. Such insistence on parental rights entails that the only permissible care is privatized within the atomized, legally sanctioned family. And in the name of that family, great harm is done.
Their images are synonymous with 19th century America and the men behind the evocative lithographs were both laid to rest in an iconic landscape of the time, Green-Wood Cemetery.
Currier & Ives, founded in 1834 by Nathaniel Currier and expanded in 1857 to include partner James Merritt Ives, produced millions… Read More >
East 9th Street between First Avenue and Avenue A.
Retail vacancy rates do appear to be growing in New York City, but the reasons why rents stay high even in the face of a supply glut are complicated
Even in an East Village littered with “For Rent” signs in store windows, East Ninth Street between First Avenue and Avenue A stands out.
At the east end of the block sits a six-story brick edifice, freshly painted white, that was bought by the real estate firmIcon Realty in 2014. The following year, the businesses that had occupied the building’s seven adjoining storefronts for years—an antiques store, a vintage clothing store, a coffee shop—were either not offered lease renewals or presented with massive rent hikes, as the new owners prepared to renovate and revitalize the 127-year-old building.
It hasn’t exactly worked out that way. Five years later, only one storefront is currently occupied, by a poke shop. Another two have papered-over windows, with possible signs of work within; the rest are vacant, but for a few stray Ikea bags and what looks like a sculpture of a balloon animal.
Isiah Michael was one of the retail tenants who arrived after the renovation, renting out a pair of storefronts that had been the home of the Upper Rust antique store since 2002. He says he was attracted to the East Village by the neighborhood feel; “there’s no major train,” he notes, so residents tend to patronize their local stores more. He and his partner decided the freshly renovated space was the ideal spot to open a “barber lounge,” offering free drinks with each haircut. To land the property, Michael and his business partner negotiated a10-year lease with Icon for just under $12 per square foot each month. They spent three months (and $200,000) to equip their Classic Man Barber Lounge with sinks, barber chairs, andother accoutrements.
A little over a year later, the barbershop was gone, along with most of its neighbors. “All of those tenants closed within six to 12 months, and now there’s a row of vacant spaces,” says Abigail Ellman, director of planning and development for the Cooper Square Committee, which has advised residential tenants of the building in their ongoing battles with Icon.
When people talk about the retail vacancy or “luxury blight” crisis in New York, they usually have in mind storefronts like these: small neighborhood shops cleared out for upscale stores that never came, or that closed as soon as they opened. The image of greedy landlords so eager to cash in on rising rents that they’re willing to destroy a thriving urban streetscape has launched entire websites, not to mention legislation like the Small Business Jobs Survival Act (first proposed in 1986) and City Council member Stephen Levin’s proposed Commercial Rent Stabilization Act, which would subject storefronts to residential-style rent regulations.
But while there’s some germ of truth to that image—nobody would argue that landlords don’t want to maximize their profits—the reality is more complex. What data is available shows that retail vacancy rates do appear to be growing, especially in areas where rents are on the rise. But the reasons why rents stay high even in the face of a supply glut—why New York appears to be littered with neighborhoods nobody goes to because they’re too crowded—reveal some stubborn facts about the ways that retail landlords and tenants interact that new legislation may not be able to touch.
One major difficulty in diagnosing the causes of retail vacancies is that there’s so little hard data on how many there are, where they’re occurring, or how long they last. Unlike residential property owners, commercial landlords are under no obligation to report how many storefronts they have available, or how much those spaces are renting for.
”Unfortunately, the city has very limited data on small businesses at all,” says Lena Afridi, director of policy at the Association for Neighborhood and Housing Development. The city’s Department of Small Business Services, she notes, doesn’t even know how many retail storefronts the city has, let alone how many are vacant.
The reasons why retail rents stay high even in the face of a supply glut reveal stubborn facts about the ways that landlords and tenants interact.
”It’s very challenging to actually keep track of retail vacancies since space gets turned over and filled and changes, and stores go out of business, and restaurants close and restaurants reopen on a daily basis,” says Steven Soutendijk, executive managing director of retail services for the commercial real estate giant Cushman and Wakefield. “We do not track it; we do not have the 1,000 people it would require to go out on a day-to-day basis.”
The best attempt so far at quantifying storefront vacancies came last September, when Comptroller Scott Stringer’s office used a clever workaround to get at those figures. Commercial landowners, it turns out, must report retail occupancy and lease data to the city’s Department of Finance. And while those figures are confidential in the case of particular buildings, Stringer’s office was able to use data aggregated by ZIP code to issue a report that painted a broad-strokes picture of the retail landscape.
That picture was one of both rising rents—up 22 percent on average citywide between 2007 and 2017—and rising vacancies, which had increased from 4 percent to 5.8 percent over that same 10-year period. But the effect varied from neighborhood to neighborhood: Staten Island (11 percent, up from 4.3 percent) and Manhattan (5.2 percent, up from 3.3 percent) both saw jumps, but other boroughs saw vacancies peak in the early ’10s.
While the report indicates that Staten Island and other far-outer-borough neighborhoods have been the victim of hollowed-out malls, Manhattan has been hit by the opposite effect: Where rents were rising the fastest, so were vacancies. (Controlling for other factors, the report found, each 1 percent increase in rents resulted in a 0.33 percent rise in vacant retail square footage.)
The East Village certainly qualifies as a site of both rising rents and growing numbers of empty storefronts, with a vacancy rate of just under 9 percent, more than 50 percent above the citywide average, according to the comptroller’s report. Other studies have come up with even higher estimates: A recent survey by the Cooper Square Committee, says Ellman, found an overall vacancy rate of 15 percent that went as high as 23 percent on blocks along Avenue C.
By the time Michael came along in 2017, what had been a busy if somewhat ramshackle string of stores along East Ninth Street (preserved for posterity in a Google Street View image from 2013) had been replaced by freshly vacated spaces. An investment banker who’d gone to barbering school, Michael thought he could make a go of it in the paired storefronts, even if the rent was a bit higher than he’d anticipated.
“What we didn’t expect was the Icon variable,” he says. A series of mishaps—malfunctioning air conditioning, a continually flooding basement, and an unannounced electrical upgrade that Michael claims cost him and his partner $30,000 in lost equipment and inventory—led to legal battles with his landlord, and ultimately an eviction notice last February.
When Michael offered to bring over a lease payment he had been withholding in a dispute over repair costs, he says, Icon “responded saying they were terminating the lease.” Of the five other businesses in the building, says Michael, all but the poke shop moved out around the same time.
Icon declined to answer questions about specific properties, but according to leasing director Zach Levine, all of the currently vacant storefronts are now rented, except for one of the two storefronts at 441 East Ninth Street, where a lease is still being finalized. Though an open listing remains on the Icon website for 443 East Ninth Street, Levine says that’s no longer actually available: “I leave those up to get more calls.”
Across the street, meanwhile, things aren’t looking much better. A jewelry store sits empty, a torn campaign poster in the window displaying the visage of Congressional candidate Suraj Patel alongside the quote, “When I see an empty storefront, it’s personal.” It’s just one of five vacant retail spaces on the south side of the block, ranging from a shuttered wine shop to a storefront adorned only by a sign reading “POPUP HERE.”
Walk around the corner, meanwhile, and the scene is very different: First Avenue has few vacancies, but is wall-to-wall laundromats, liquor stores, and restaurants, bars, and other food shops (including ice cream and “stuffed ice cream” within a few doors of each other).
Another series of vacant storefronts on the south side of East Ninth Street.
While this kind of monoculture may feel like planned gentrification, Soutendijk notes that there’s another reason why food and drink are so resilient in the face of retail blight: Restaurants may behugely volatile, with high labor costs and thin margins, and likely to go out of business at the drop of a hat—but they’re “also the business that’s least disruptable by Amazon.”
Fifteen years ago, he notes, New Yorkers would stop by a local pharmacy “to get toilet paper or get a light bulb, because you knew you were running out. Now when you’re down to that last light bulb, you go on Prime and you have it delivered the next day, and it’s generally 20 percent less than it would be if you went to Duane Reade. But you can’t do that with the restaurant business.”
Stringer’s findings back up this claim. While clothing stores and “general merchandise” both saw a dip in retail locations in New York City from 2012 to 2018, “specialty food,” laundry services, and grocery stores all nearly doubled their number of locations, at least according to the number of stores that take Mastercard, which provided the data the comptroller’s office used to estimate types of businesses.
”Stores that sell stuff have really flattened out, while places that sell experiences have continued to rise very rapidly,” says Stringer.
Even so, says Ellman, a building like the one on East Ninth Street shows signs of being plagued by more than just competition from online retailing. “Given the commercial speculative bubble that Manhattan saw in the 2015 to 2018 period,” she says, “landlords saw that maybe they could get higher rent in the less-developed areas of the East Village. And because there’s no right to lease renewal for commercial properties, they may have taken a risk and not renewed a lease and then allowed the property to sit and wait for a higher-value tenant.”
Shrima Pandey, small business program manager for the Chhaya Community Development Corporation in Jackson Heights, agrees. “I definitely think some landlords are taking a risk and holding out, but some of them can afford to take that risk,” she says, citing a former bank building at 72nd Street and Broadway that’s sat vacant since it was purchased in December 2018 by Da Bronx LLC, a limited liability company based in Great Neck. “If they have other properties that are doing well, or do other things that help them make profit, then they’re able to wait until they find somebody that will pay the rent that they’re looking to have for that space.”
This is increasingly the case, says Ellman, as real estate is ever more dominated by large landholders, including those controlled by private equity firms. “If you’re just looking at it as an item on a spreadsheet, then it might make sense to hold out for two or three years while you wait for someone who can sign that five- or 10-year lease,” she says. “If you have a bar or a restaurant, you can definitely make more per square foot. However, what that does create is an oversaturation—and also an unrealistic expectation on the part of some property owners.”
Soutendijk says that it would be foolish for landlords to drive out good tenants just in hopes of scoring a payday. But even he admits that in a changing market where no one is certain what “market rent” is, landlords will sometimes find themselves asking more for rents than shopkeepers can afford: “It’s a really slow ship, and to turn it around takes 36 months, 48 months, maybe even more.”
That timeframe is only being lengthened by the popup trend, which enables landlords to fill space (and their revenue ledgers) by renting to short-term retail establishments at a lower price, but with the ability to swiftly replace them if a long-term lease comes through at their asking price. “Owners are saying, ‘I don’t know what pricing is, and there don’t seem to be a lot of tenants even if I drop the rent by 20 or 30 percent, so let’s do popups,’” says Soutendijk.
All this makes for a bit of a moving target for the City Council as it prepares legislation to address the retail vacancy trend, whatever is causing it. The SBJSA would require landlords to offer current tenants 10-year lease renewals, and submit to binding arbitration if lease terms can’t be agreed on. Soutendijk, who insists that eviction of long-term retail tenants isn’t a widespread problem, calls the bill “a piece of legislation that is solving a problem that does not exist”; Pandey says SBJSA “could potentially be a strong bill,” but is nonetheless concerned that because it relies on enforcing lease renewals, it could end up being useless for many immigrant-run stores in Jackson Heights that don’t have formal leases.
Levin’s commercial rent stabilization bill, which would limit how much landlords could charge based on the last recorded rent of the space itself, would seemingly protect no-lease shopkeepers. But Soutendijk worries that if commercial rent control means landlords can no longer charge a premium to mom-and-pop shops to account for their higher risk, they’d only be more likely to hold out for renters like banks or chain stores that are less likely to go under in the middle of a lease.
Soutendijkalso points to city red tape as a reason for long-term vacancies, and Stringer’s report backs that up: A 1 percent increase in Department of Buildings alteration permits unapproved after 30 days leads to a 3.28 percent increase in vacant retail square footage, according to the comptroller’s numbers.
And there remains the lurking issue of online retail’s growing dominance. For East Ninth Street, the surrounding retail ecosystem suggests that regardless of how Icon dealt with its tenants, change was likely to come solely because of shifts in how New Yorkers shop. No one, it seems, has a proposal for new laws that could make a jewelry store more viable in the era of Etsy. (The vintage store formerly in the Icon building has now switched to selling products via its Instagram.)
Restaurants occupy many of the storefronts along First Avenue, thanks to the fact that they’re not “disruptable” by online retail.
For now, Stringer counsels patience, at least until more data has been collected, though he acknowledges that “it’s hard not to walk down your street and see new vacancies and not feel urgency to do something.” His report’s recommendations mostly focus on bureaucratic reforms to ease burdens on retail establishments and landlords alike—splitting the Department of Buildings into separate inspection and remediation agencies, and educating store owners on city rules and regulations—as well as possibly providing tax subsidies for small businesses in high-vacancy areas.
Meanwhile, the council has so far mostly limited itself to low-hanging fruit, hiking fines for harassment of commercial tenants and passing a storefront tracker law that should help supplement Stringer’s findings with a publicly accessible database; retail property owners must report lease and rent information starting this year, though a launch date for the database itself hasn’t yet been announced.
Ellman believes it will take “three or four or five different interlocking policies to really address this situation,” including possibly a tax of vacant storefronts, something that has won the endorsement of Mayor Bill de Blasio, if not of the state legislators who would need to approve it.Even the council database, she hopes, has the potential to convince retail landlords that if their storefront is sitting empty, it’s probably because their asking price is too high.
“There’s a lot of things that could be done to help,” says Michael, even if that means just standardized lease terms or limits on how quickly rents can increase over time. “If you’re a baker and you’re passionate about making cupcakes, you don’t want to spend too much time thinking about lease terms. And you don’t have the power or clout behind you to push back with a landlord on negotiating terms.”
If nothing is done, Michael worries, there will be too much incentive for landlords to let their retail properties lie fallow in hopes of a grab at a brass ring. “What they lose out in terms of the rent these months, they’re going to make it back once they find somebody else who’s willing to sign a ridiculous lease,” he says. “They can wait and find the next sucker who will invest so much money, abandon their property right before an eviction notice, and leave them with a gold mine.”
About 50 million people in the United States don’t have access to enough food to support a healthy lifestyle. The technical term for this is food insecurity, and over 40% of people in the United States will experience it during their adult lives. This pervasive problem has a lot of associated health effects, too.
The reddened areas in the map below, showing the most damage, are found mostly across the Gulf South, in states where some of the poorest black, Latino, Asian, and Native American communities are located. Many of these places have already sustained huge tolls from climate-related disasters.
It would be wise, then, to ensure that the people who live in the most climate-imperiled parts of the country would have a substantial say in what the “Green New Deal” means for them.
Total direct economic damage integrated over agriculture, crime, coastal storms, energy, human mortality, and labor in 2080 to 2099, under a scenario of continued high emissions. (Left) Damages in the median scenario for each county. Negative damages indicate benefits. (Right) Range of economic damages per year for groupings of U.S. counties, on the basis of income (white lines, median; boxes, inner 66% of possible outcomes; outer whiskers, inner 90% of possible outcomes). (Science)
With all the brouhaha over the Green New Deal resolution introduced on February 7 by Representative Alexandria Ocasio-Cortez and Senator Ed Markey—Does it go too far? Not far enough?—what matters to advocates for racial and environmental justice is power. They’re invested in both the kind of power that heats where we live and fuels how we travel, and the kind that decides policies and enforces laws. The Green New Deal presents an opportunity for distributing both kinds of power more equitably, to improve the lives of the nation’s most vulnerable families.
The resolution emphasizes “frontline communities” in various passages, and this is one of the most critically important parts of it, according to Cecil Corbin-Mark, the director of policy initiatives for the New York City-based organization WE ACT for Environmental Justice.
“There can’t be a solution without communities from the front lines,” said Corbin-Mark. “The days of fashioning policy and solving problems in ways that say, ‘We, mainstream green organizations or politicians in Washington, know best,’ those days are way behind us.”
Perhaps not entirely, though. The Markey who introduced the Green New Deal with Ocasio-Cortez last week is the same politician who introduced Green New Deal-ish climate legislation 10 years ago—the ill-fated Waxman-Markey bill. Corbin-Mark was in D.C. for that ride, as were other environmental-justice activists and lobbyists, but they were ignored in the bill’s markup. Back then, these EJ lobbyists were not on board with the bill’s accommodation of fossil-fuel energy sources and some of its climate-pollution mitigation measures. The bill ultimately failed, in no small part because it did not garner the support of frontline communities and their advocates.
The Green New Deal would correct the failed Waxman-Markey attempt by prioritizing frontline-community families, although it has yet to lay out specifics on how to deal with carbon pollution. In some ways, that’s by design. It is only a resolution with no binding power to force Congress to act on anything. It provides the framework for future legislation should it later emerge. The resolution mostly asks if Congress will get behind the Green New Deal in principle. For Corbin-Mark, that framework needs to at least set time-specific goals for what future legislation should achieve—namely, phasing out the fossil fuels that cause climate change.
“Some of the compromises that are taking place are troubling,” said Corbin-Mark, “especially when it does not squarely establish a timeline for when we turn off the tap on fossil fuels, and that’s at the … crux of the problem, in terms of the climate crisis. How we do that is at the heart of addressing the equity issue.”
The Green New Deal resolution does call for reaching net-zero greenhouse-gas emissions and eliminating air pollution “as much as technologically feasible” within a 10-year span. An accompanying fact sheet (which has been retracted in parts) does call for a “full transition off fossil fuels and zero greenhouse gases,” but hedges that “simply banning fossil fuels immediately” won’t provide the kind of economic benefits for disadvantaged communities the resolution calls for.
In 2009, the most widely accepted measure for dealing with carbon emissions was cap and trade, a market-based mechanism by which companies can buy and/or trade allowances to emit carbon-dioxide emissions under a cap that will gradually drop to zero over time. That ended up being a reason why the Waxman-Markey bill failed. Corbin-Mark, along with advocates and lobbyists from groups such as the New Jersey Environmental Justice Alliance, opposed the cap-and-trade provisions. Instead, they pushed for a carbon tax or fee, and were castigated for it by lawmakers and mainstream environmental organizations that believed a new tax would never work. Today, economists, politicians, and environmentalists alike are rallying around putting a price on carbon emissions in the form of a fee or tax.
California ended up becoming a major laboratory for examining whether a cap-and-trade scheme could work. It installed its own self-styled program in 2013, with the promise that environmental-justice communities would benefit from the revenue collected from it. Those communities may have gotten some of the windfall, but they also continued to get the pollution. According to a 2018 study that tracked pollution in the first years of the cap-and-trade program’s implementation, “the majority (52%) of regulated facilities reported higher annual average local GHG emissions since the initiation of trading”—most of those facilities being in neighborhoods with “higher proportions of people of color and poor, less educated, and linguistically isolated residents.”
The Green New Deal resolution rules out neither a carbon tax nor cap and trade, but says neither is a full solution for the elimination of the nation’s carbon-pollution load. The resolution mostly focuses on shoring up renewable-energy sources, increasing energy efficiency in buildings, expanding public transit, and widening the market of electric or non-gasoline-fueled vehicles. The transportation sector is the largest greenhouse-gas polluter right now (though beating out the electricity sector only by a smidgen), so it makes sense that it would focus on this.
However, some critics charge that the resolution focuses too much on transportation. They argue that the nation should be reducing car travel altogether rather than merely electrifying cars. As my colleague Laura Bliss reported, a recent study shows that limiting car use or access would further economically burden families that are already struggling financially. The Green New Deal framers seem to agree with this; Ocasio-Cortez’s fact sheet states, “We cannot simply tax gas and expect workers to figure out another way to get to work unless we’ve first created a better, more affordable option.”
Most cities in the South do not have robust public-transit systems. And if you recall the map at the beginning of the story, it’s counties in the South that will suffer the most damage from climate change. These are also the counties and states with some the largest concentrations of black and Latino families, many of whom live in poor and/or rural communities. Which means that having access to a car or truck in a disaster event will be critically important for evacuation.
“It’s important that we don’t minimize this historical legacy and assume that all regions of the country are equal, or that we can somehow have a standard format to apply across the country,” said Robert Bullard, a long-time environmental justice scholar and activist. “The resistance that will be met will come from the very states that birthed the civil-rights and the environmental-justice movements. It’s not by accident that these Southern states have a disproportionate share of governors and attorneys general who are climate denialists and are trying to roll back voting and civil rights.”
The Green New Deal calls for “community-defined projects and strategies” in several parts of the text, meaning it is not subscribed to a one-size-fits-all strategy. Instead, it seeks to empower the people who face the most harm from climate change to come up with environmentally and racially just solutions tailored to where they live. And it’s because of that inclusion of frontline communities that Corbin-Mark says his allies in the environmental-justice community are sticking with the Green New Deal framework, despite its current shortcomings.
But he offered a caveat: “If we get to net-zero, but the way we get there is based on false narratives, and technologies with no proven record of dealing with the scale of what we have to deal with, then that is not a solution,” said Corbin-Mark. “That is just politics as usual.”
But one Brooklyn school district is trying something different. District 15—which includes Boerum Hill, Carroll Gardens, Cobble Hill, Fort Greene, Gowanus, Kensington, Park Slope, Sunset Park, Red Hook, and Windsor Terrace—is implementing a new integration strategy, going into effect for sixth graders in the 2019-2020 academic years, for its 11 middle schools. It incorporates school choice (a program that lets parents pick where they want to send their children), a lottery system, and setting aside a certain percentage of seats for students in need. The new approach does away with “screens”—like the number of tardies, absences, and test scores—that are currently used as admissions criteria. Additionally, there are recommendations for making classrooms more inclusive for students from different racial, ethnic, and economic backgrounds, and for students with special needs.
What makes this strategy significantly different from previous integration efforts is how it was developed: by parents, school administrators, teachers, community groups, and advocacy groups. In the past, there hasn’t been as much engagement with the public. The Department of Education (DOE) decided to take a bottom-up approach to desegregation in District 15. It enlisted the architecture and urban planning firm WXY—which works frequently with New York City officials, and has both education policy expertise and experience facilitating community engagement—to design a process that would yield the recommendations, which were presented in August and adopted September 20.
“The District 15 work is unique in how it engaged the community around [school integration] in a way that hasn’t been done so intentionally,” says Christopher Rice, a senior urban planner at WXY. “If we’re going to try to engage people around school diversity, who needs to be at the table? How are we going to frame those conversations? Who is going to help us think through framing those conversations? To my knowledge, it hasn’t been done before.”
But can a plan developed for just one of dozens of school districts in New York City actually make a difference?
Segregation in the era of systemic bias
Studies show that integrated schools help minority students growing up in poverty achieve greater academic performance, earn more money as adults, and have better health outcomes. All students benefit by learning from one another and could potentially become less prejudiced. But despite this knowledge, schools remain segregated.
Over the past decade, District 15’s demographics have changed dramatically. The number of white students in District 15 doubled between 2007 and 2017. Additionally, New York City schools began applying screens in the 2000s to influence enrollment, which further impacted the demographics of individual schools.
“In essence, you had three middle schools that went through a lot of change in a fairly short amount of time,” Adam Lubinsky, a principal and managing director of WXY, says. “The schools have wound up being majority white students in a 10-year period. And so that is coupled with a lot of white students coming back into the district. It’s a complicated story, but it also speaks to the displacement that has occured in those schools.”
WXY
District 15’s neighborhoods are still segregated, but it’s diverse as a whole, which opened it up to new strategies to integrate its 11 middle schools.
Courtesy WXY
The Dissimilarity Index measures how different the demographics of schools are compared to their surrounding areas.
Today in District 15, 12 percent of middle-school students in are Asian, 12 percent are black, 42 percent are Latino, 32 percent are white, and two percent are classified as “some other race.” Nine percent of students are English Language Learners. About 50 percent of middle school students in the district are low-income, using the metric of who qualifies for a free or reduced-price lunch.
But when the DOE examined District 15, it found troubling data about school segregation. While the district as a whole—which includes about 6,000 students in grades 6–8—is diverse, the middle schools were highly segregated. Schools in District 15 have the city’s fourth highest dissimilarity index for poverty, a measure of how different the demographic composition of a school is compared to the entire district. The student body at some of the district’s middle schools was 80, 96, and 97 percent low income; meanwhile, other schools were just 20 or 29 percent low income.
Segregation persists in District 15’s schools for complex reasons, as WXY’s quantitative research and interviews with parents and community groups revealed. Some systemic policy practices lead to stratified schools as did parent choices.
Let’s start with the screens, which are used to weight a student’s application to a school. District 15 screen students on their report card grades; whether or not they have fewer than six tardies; if they have math and language arts test scores of three or above; and suspensions. The screens in place disproportionately remove Latino and black students from the middle school applicant pool and pose a significant barrier to access. While 42 percent of white students and 62 percent of Asian students passed the screen for test scores, absences, and tardies, just 17 percent of black and 16 percent of Latino students did.
These screens, and competition, made applications a grueling process. “There were certain middle schools where you may have 1,300 applications for 120 spots,” Lubinsky says. “We’re talking fierce, fierce competition in a way that parents feel like it’s affecting children. There’s a perception that who they are depends on what school they get into.”
Courtesy WXY
Screens, which are used to weight a student’s application to a school, disproportionately remove black and Latino kids.
Parents were concerned about discrimination, which impacted where they sent their children. Residential housing segregation also reinforced homogenous schools.
“I don’t want to send my kids to school in a predominantly white neighborhood,” one respondent to a community survey wrote. “My kids get racially profiled and stopped by the police.”
Another community member wrote: “Historically, students of color have always had to travel when integration initiatives are implemented. How do we ensure we don’t place that burden on students of color in District 15?”
To make sure the Diversity plan yielded recommendations that would advance integration and satisfy parents, students, and educators, the DOE decided to go straight to them for suggestions and enlisted WXY to develop the process.
Designing an inclusive policy-making process
A longstanding frustration with public policy is that it often happens behind closed doors with little transparency or input from the people who will be most affected by it. In the context of school placement, parents and students were frustrated with opacity around how the process worked.
From the outset, the DOE envisioned the diversity plan to be public facing—a choice informed by Mayor Bill de Blasio’s belief in grassroots policy efforts and his own work as a parent in the district. (During a press conference about the plan he mentioned receiving “the coldest shoulder you’ve ever seen” when a parents’ group brought their integration proposal to the DOE 15 years ago.) To create a new grassroots policy-making process, WXY used strategies often found in the design world: user-driven research and participatory design.
Courtesy WXY
WXY hosted a series of public workshops during which District 15 parents, students, and advocates developed the integration plan.
“A lot of these connections didn’t exist,” Rice says about the working group members, who had all been working to advance integration and equity but not always in coalitions. “The Sunset Park groups felt disconnected from the conversations happening in the other part of the district, and we wanted to be intentional about bringing folks together.”
To help make the collaborative process more productive, all members of the working group completed anti-bias training from the Center for Racial Justice In Education before beginning their work. Some of the meetings were held bilingually with simultaneous translation.
Using information from the surveys and three public workshops, the working group created six different options for its recommendations that involved lotteries, weighted preferences, removing all screens, keeping some screens, and letting DOE make assignments.
The community felt very strongly about retaining choice. Additionally, they overwhelmingly approved of giving priority placement to low-income students, English language learners, and students in temporary housing. The issue of using screens varied from neighborhood to neighborhood: 62 percent of Park Slope residents favored them compared to 42 percent of Sunset Park.
“Some people really have a notion of hard work and merit and people on the other side of the argument will talk about the access to information and privilege that many people have,” Lubinsky says. “That was a clear fault line in this discussion.”
Ultimately, the working group recommended setting aside a certain number of seats at each school for low-income students and using a lottery for all seats. Screens will no longer be used.
Courtesy WXY
The new application process for District 15 sets aside seats in each middle school for students with priority criteria (like being low-income or an English language learner) and uses a lottery system.
In the new process, students will rank their top three school choices and enter into a lottery. If there’s a spot, they’ll be accepted. If there isn’t a spot, then they’re entered into the lottery for their second choice and so on down the list until they’re placed.
At every middle school, 52 percent of seats will be set aside for English Language Learners, students receiving free and reduced lunch, and students in temporary housing. If there are more priority students that apply to a school than there are seats, the students who do not receive a priority seat will automatically be entered into the general lottery for the school. If there aren’t enough priority applicants at a particular school, the remaining seats are entered into the general lottery.
Applying District 15’s lessons elsewhere
Changing the composition of of the student body at each middle school is only part of the challenge for District 15. Inclusion—or how welcoming and accommodating a school is to students from different backgrounds and abilities—is the other half. While the lottery-based integration plan is only possible in District 15, the inclusion recommendations are applicable everywhere.
“You can have diverse schools, but the classrooms in that school can still be segregated,” Neal Zephyrin, a member of the District 15 Community Education Council said in the report. “Lunchrooms can still be segregated. Curriculum and content can still not be inclusive.”
Some of the key challenges are addressing higher discipline rates for Latino and black students: While black students represent 13 percent of the student body, they account for 33 percent of suspensions. Bridging the gap between teacher demographics and student demographics is another concern: 67 percent of teachers in the district are white compared to 32 percent of students, and 12 percent of teachers are Latino compared to 42 percent of students.
Communicating available resources at each school and beefing them up is another priority. The report suggests anti-bias, anti-racist, anti-disability bias, and cultural sensitivity training for all students, faculty, and administration in District 15. It also recommends increasing multi-lingual emotional and mental health services within each school and creating a Restorative Justice Coordinator for the district.
Rewriting the curriculums at schools to be reflect a more culturally responsive education is also recommended. For example: more focus on the contributions of African, Latinx, Asian, Middle Eastern, and Native people, as well as teaching the intersections with gender, religion, and disability. Working toward equal arts, tech, music, and sports programming at each school is another priority.
“Something that came up in the process is: Do you make policy changes—and ambitious policy changes—to support integrative schools if you don’t have the [supportive programs] needed at the school?” Rice says. “We have a whole section of recommendations on inclusion and creating welcoming environments for different types of learners. That’s applicable across all schools in New York: creating spaces where different types of student feel welcome and safe. For a lot of parents we talked to, that was most important to them.”
Moving toward “school-oriented development”
Schools affect where people live today, how they travel through the city, and long-term mobility. But despite the huge impact schools have on a city, they’re often afterthoughts in planning. The District 15 plan process reflects a new way of thinking about schools in the context of their communities. By centering them in conversations about how to make New York more equitable, they become catalysts of new urban policy.
“Essentially, rather than schools sort of being an integral part of growth and community formation, they sort of come through pressures: A place starts to grow because of density around transit or a rezoning then it’s, ‘Oh my god we need schools here,’” Lubinsky says. “We’re pitching an idea: Instead of transit-oriented development, it’s school-oriented development. How do you shape an approach to planning that’s related to schools?”
Correction: A previous edition misstated the competitiveness of some District 15 schools. It’s 1,300 applications for 120 seats, not 20 seats.
This is big news. Thanks to RStudio, you can now run Stan effortlessly on the web.
So you can get started on Stan without any investment in set-up time, no need to install C++ on your computer, etc.
As Ben Goodrich writes, “RStudio Cloud is particularly useful for Stan tutorials where a lot of time can otherwise be wasted getting C++ toolchains installed and configured on everyone’s laptops.”
We’ve pre-loaded this particular RStudio session with a regression model and an R script to simulate fake data and run the model. In your online RStudio Cloud session (which will appear within your browser when you click the above link), just go the lower-right window with Files, and click on simple_regression.stan and simple_regression.R. This will open up those files. Run simple_regression.R and it will simulate the data, run the Stan program, and produce a graph.
Now you can play around.
Create your own Stan program: just work in the upper-left window, click on File, New File, Stan File, then click on File, Save As, and give it a .stan extension. The RStudio editor already has highlighting and autocomplete for Stan files.
Or edit the existing Stan program (simple_regression.stan, sitting there in the lower right of your RStudio Cloud window), change it how you’d like, then edit the R script or create a new one. You can upload data to your session too.
When you run a new or newly edited Stan program, it will take some time to compile. But then next time you run it, R will access the compiled version and it will run faster.
You can also save your session and get back to it later.
Some jargon for ya—but I mean every word of it!
This is a real game-changer as it significantly lowers the barriers to entry for people to start using Stan.
Limitations
Ultimately I recommend you set up Stan on your own computer so you have full control over your modeling, but RStudio’s Cloud is a wonderful way to get started.
Here’s what Rstudio says:
Each project is allocated 1GB of RAM. Each account is allocated one private space, with up to 3 members and 5 projects. You can submit a request to the RStudio Cloud team for more capacity if you hit one of these space limits, and we will do our best accomodate you. If you are using a Professional shinyapps.io 2 account, you will not encounter these space limits.
In addition to the private space (where you can collaborate with a selected group of other users), every user also gets a personal workspace (titled “Your Workspace”), where there is virtually no limit to the number of projects you can create. Only you can work on projects in your personal workspace, but you can grant view & copy access to them to any other RStudio Cloud user.
This is just amazing. I’m not the most computer-savvy user, but I was able to get this working right away.
Ben adds:
It also comes with
* The other 500-ish examples in the examples/ subdirectory
* Most of the R packages that use Stan, including McElreath’s rethinking package from GitHub and all the ones under stan-dev, namely
– rstanarm (comes with compiled Stan programs for regression)
– brms (generates Stan programs for regression)
– projpred (for selecting a submodel of a GLM)
– bayesplot and shinystan (for visualizing posterior output)
– loo (for model comparison using expected log predictive density)
– rstantools (for creating your own R packages like rstanarm)
* Saving new / modified compiled Stan programs to the disk to use across sessions first requires the user to do rstan_options(auto_write = TRUE)
I’m so excited. You can now play with Stan yourself with no start-up effort. Or, if you’re already a Stan user, you can demonstrate it to your friends. Also, you can put your own favorite models in an RStudio Cloud environment (as Ben did for my simple regression model) and then share the link with other people, who can use your model on your data, upload their own data, alter your model, etc.
P.S. It seems that for now this is really only for playing around with very simple models, to give you a taste of Stan, and then you’ll have to install it on your computer to do more. See this post from Aki. That’s fine. as this demo is intended to be a show horse, not a work horse. I think there is also a way to pay RStudio for cycles on the cloud and then you can run bigger Stan models through the web interface. So that could be an option too, for example if you want to use Stan as a back-end for some computing that you’d like others to access remotely.
It’s not every apartment building that comes with access to an infinity pool on a floor higher than most buildings in New York City, but Brooklyn Point at 138 Willoughby Street boasts precisely that. It's the highest such pool in the Western Hemisphere to boot -- clocking in at 680… Read More >
Three-quarters of tree species common in the eastern U.S. have moved their population centres westward over the last 30 years – an effect not predicted by assumptions about global warming.
Gotham Greens’ boxed lettuces have been popping up on the shelves of high-end grocers in New York and the Upper Midwest since 2009, and with names like “Windy City Crunch,” “Queens Crisp,” and “Blooming Brooklyn Iceberg,” it’s clear the company is selling a story as much as it is selling salad.
Grown in hydroponic greenhouses on the rooftops of buildings in New York and Chicago, the greens are shipped to nearby stores and restaurants within hours of being harvested. That means a fresher product, less spoilage, and lower transportation emissions than a similar rural operation might have—plus, for the customer, the warm feeling of participating in a local food web.
“As a company, we want to connect urban residents to their food, with produce grown a few short miles from where you are,” said Viraj Puri, Gotham Greens’ co-founder and CEO.
Gotham Greens’ appealing narrative and eight-figure annual revenues suggest a healthy future for urban agriculture. But while it makes intuitive sense that growing crops as close as possible to the people who will eat them is more environmentally friendly than shipping them across continents, evidence that urban agriculture is good for the environment has been harder to pin down.
A widely cited 2008 study by researchers at Carnegie Mellon University found that transportation from producer to store only accounts for 4 percent of food’s total greenhouse gas emissions, which calls into question the concern over “food miles.” Meanwhile, some forms of urban farming may be more energy-intensive than rural agriculture, especially indoor vertical farms that rely on artificial lighting and climate control.
An operation like Gotham Greens can recycle water through its hydroponic system, but outdoor farms such as the ones sprouting on vacant lots in Detroit usually require irrigation, a potential problem when many municipal water systems are struggling to keep up with demand. And many urban farms struggle financially; in a 2016 survey of urban farmers in the U.S., only one in three said they made a living from the farm.
Although cities and states have begun to loosen restrictions on urban agriculture, and even to encourage it with financial incentives, it has remained an open question whether growing food in cities is ultimately going to make them greener. Will the amount of food produced be worth the tradeoffs? A recent analysis of urban agriculture’s global potential, published in the journal Earth’s Future, has taken a big step toward an answer—and the news looks good for urban farming.
“Not only could urban agriculture account for several percent of global food production, but there are added co-benefits beyond that, and beyond the social impacts,” said Matei Georgescu, a professor of geographical sciences and urban planning at Arizona State University and a co-author of the study, along with other researchers at Arizona State, Google, China’s Tsinghua University, the University of California, Berkeley, and the University of Hawaii.
A MODIS Land Cover Type satellite image of the United States, similar to imagery analyzed by the researchers. Different colors indicate different land uses: red is urban; bright green is deciduous broadleaf forest. (Obtained from https://lpdaac.usgs.gov/ maintained by the NASA EOSDIS Land Processes Distributed Active Archive Center, USGS/Earth Resources Observation and Science Center)
Using Google’s Earth Engine software, as well as population, meteorological, and other datasets, the researchers determined that, if fully implemented in cities around the world, urban agriculture could produce as much as 180 million metric tons of food a year—perhaps 10 percent of the global output of legumes, roots and tubers, and vegetable crops.
Those numbers are big. Researchers hope they encourage other scientists, as well as urban planners and local leaders, to begin to take urban agriculture more seriously as a potential force for sustainability.
The study also looks at “ecosystem services” associated with urban agriculture, including reduction of the urban heat-island effect, avoided stormwater runoff, nitrogen fixation, pest control, and energy savings. Taken together, these additional benefits make urban agriculture worth as much as $160 billion annually around the globe. The concept of ecosystem services has been around for decades, but it is growing in popularity as a way to account, in economic terms, for the benefits that humans gain from healthy ecosystems. Georgescu and his collaborators decided to investigate the potential ecosystem services that could be provided through widespread adoption of urban agriculture, something that had not been attempted before.
The team began with satellite imagery, using pre-existing analyses to determine which pixels in the images were likely to represent vegetation and urban infrastructure. Looking at existing vegetation in cities (it can be difficult to determine, from satellite imagery, what’s a park and what’s a farm), as well as suitable roofs, vacant land, and potential locations for vertical farms, they created a system for analyzing the benefits of so-called “natural capital”—here, that means soil and plants—on a global and country-wide scale.
Beyond the benefits we already enjoy from having street trees and parks in our cities, the researchers estimated that fully-realized urban agriculture could provide as much as 15 billion kilowatt hours of annual energy savings worldwide—equivalent to nearly half the power generated by solar panels in the U.S. It could also sequester up to 170,000 tons of nitrogen and prevent as much as 57 billion cubic meters of stormwater runoff, a major source of pollution in rivers and streams.
“We had no notion of what we would find until we developed the algorithm and the models and made the calculation,” Georgescu said. “And that work had never been done before. This is a benchmark study, and our hope with this work is that others now know what sort of data to look for.”
Robert Costanza, a professor of public policy at Australian National University, cofounded the International Society for Ecological Economics and researches sustainable urbanism and the economic relationship between humans and our environment. He called the study (in which he played no part) “a major advance.”
“This is the first global estimate of the potential for urban agriculture,” Costanza wrote in an email. “Urban agriculture will never feed the world, and this paper confirms that, but the important point is that natural capital in cities can be vastly improved and this would produce a range of benefits, not just food.”
Costanza said he would like to see the researchers’ big data approach become standard in urban planning, as a way to determine the best balance between urban infrastructure and green space—whether it’s farms, forests, parks, or wetlands. That is the researchers’ hope as well, and they’ve released their code to allow other scientists and urban planners to run their own data, especially at the local level.
“Somebody, maybe in Romania, say, could just plug their values in and that will produce local estimates,” Georgescu said. “If they have a grand vision of developing or expanding some city with X amount of available land where urban agriculture can be grown, they can now quantify these added co-benefits.”
That could be very valuable, said Sabina Shaikh, director of the Program on the Global Environment at the University of Chicago, who researches the urban environment and the economics of environmental policy.
“Ecosystem services is something that is very site-specific,” she said. “But this research may help people make comparisons a little bit better, particularly policymakers who want to think through, ‘What’s the benefit of a park vs. food production?’ or some combination of things. It doesn’t necessarily mean, because it has the additional benefit of food production, that a farm is going to be more highly valued than a park. But it gives policymakers another tool, another thing to consider.”
Meanwhile, policy in the U.S. and internationally is already changing to accommodate and encourage urban agriculture. California, for example, passed its Urban Agriculture Incentive Zones Act in 2014, allowing landowners who place urban plots into agricultural use to score valuable tax breaks. The idea has proven controversial—especially in housing-starved San Francisco. Beyond raising rents, critics have argued that urban agriculture, if it impedes development of housing, could reduce density, contributing to the sort of sprawl that compels people to drive their cars more. Put urban farms in the wrong place, and an effort to reduce food’s carbon footprint could have the opposite effect.
On the other hand, businesses like Gotham Greens that aim to expand may still be hampered by zoning—Puri and his co-founders had to work with New York’s zoning authority to change regulations affecting greenhouses before they could open their first farm. As the company looks to add sites in other cities, the wide array of their zoning rules, utility access, and regulations will influence its decisions.
“I think we could benefit from more cohesive policy,” Puri said, “but it’s also a very new industry. And then there are so many approaches to urban agriculture. How does a city approach something that is so broad and diverse at this stage?”
While more data about the potential ecosystem services and tradeoffs would surely help create a more navigable regulatory landscape, Puri, like others in his industry, is also something of an evangelist, eager to put in a word for urban farming’s less quantifiable benefits.
“I don’t believe that urban farming is ever going to replace more conventional farming,” he said. “I don’t think a city is going to be able to produce its entire food supply within city limits, but I think it can play a role in bringing people closer to their food, and in making our cities more diverse and interesting and green.”
Press Release: “A large-scale effort to reduce childhood obesity in two low-income Massachusetts communities resulted in some modest improvements among schoolchildren over a relatively short period of time…”
Study: “Overall, we did not observe a significant decrease in the percent of students with obesity from baseline to post intervention in either community in comparison with controls…”
Overall, we did not observe a significant decrease in the percent of students with obesity from baseline to post intervention in either community in comparison with controls (Community 1: −0.77% change per year, 95% confidence interval [CI] = −2.06 to 0.52, P = 0.240; Community 2: −0.17% change per year, 95% CI = −1.45 to 1.11, P = 0.795).
Yet, the abstract concludes “This multisector intervention was associated with a modest reduction in obesity prevalence among seventh-graders in one community compared to controls . . .”
The publicity also seems to exaggerate the findings, stating, “A large-scale effort to reduce childhood obesity in two low-income Massachusetts communities resulted in some modest improvements among schoolchildren over a relatively short period of time, suggesting that such a comprehensive approach holds promise for the future, according to a new study from Harvard T.H. Chan School of Public Health.”
I have mixed feelings about this one.
On one hand, we shouldn’t be using “p = 0.05” as a cutoff. Just cos a 95% conf interval excludes 0, it doesn’t mean a pattern in data reproduces in the general population; and just cos an interval includes 0, it doesn’t mean that nothing’s going on. So, with that in mind, sure, there’s nothing wrong with saying that the intervention “was associated with a modest reduction,” as long as you make clear that there’s uncertainty here, and the data are also consistent with a zero effect or even a modest increase in obesity.
On the other hand, there is a problem here with degrees of freedom available for researchers and publicists. The 95\% interval was [-2.1, 0.5], and this was reported as “a modest reduction” that was “holding promise for the future.” Suppose the 95% confidence interval had gone the other way and had been [-0.5, 2.1]. Would they have reported it as “a modest increase in obesity . . . holding danger for the future”? I doubt it. Rather, I expect they would’ve reported this outcome as a null (the p-value is 0.24, after all!) and gone searching for the positive results.
So there is a problem here, not so much with the reporting of this claim in isolation but with the larger way in which a study produces a big-ass pile of numbers which can then be mined to tell whatever story you want.
P.S. Just as a side note: above, I used the awkward but careful phrase “a pattern in data reproduces in the general population” rather than the convenient but vague formulation “the effect is real.”
P.P.S. I sent this to John Carlin, who replied:
That’s interesting and an area that I’ve had a bit to do with – basically there are zillions of attempts at interventions like this and none of them seem to work, so my prior distribution would be deflating this effect even more. The other point that occurred to me is that the discussion seems to have focussed entirely on the “time-confounded” before-after effect in the intervention group rather than the randomised(??) comparison with the control group – which looks even weaker.
John wanted to emphasize, though, that he’s not looked at the paper. So his comment represents a general impression, not a specific comment on what was done in this particular research project.
“Over a period of 10 to 12 years,” Mr. Trump said, “somebody does a great job, they work hard — that gives incentive to do a great job. Whatever they’re doing, if they do a great job, I think it’s a nice thing to have the incentive of, after a period of years, being able to become a citizen.”
Whatever. The only thing I’m interested in is how the folks who really run things in the White House will row this back on Thursday. Will they say Trump was “speaking hurriedly”? That doing a “great job” means winning a Nobel Prize? That he was talking about Jupiter years, not Earth years? I can hardly wait for the eventual press conference from Davos revising and extending Trump’s remarks.
London’s new U.S. embassy first opened its doors to architecture critics this week, rising from the riverside ten minutes walk upstream from Britain’s parliament and next to the city’s 1970s wholesale produce market.
It’s surrounded by a glittering moat and a maze of bushes. The embassy’s central cube is partially clad in glittering sail-like panels that both mask the building and catch the light, giving it a delicate quality more reminiscent of a resort hotel than some diplomatic fortress.
That seems to be the intention, at least. In reality, the Kieran Timberlake-designed complex is, despite its softened edges and embellishments, a miserable barrack. Locked behind high walls and a flooded ditch, it tries but fails to dissemble its defensive intent. The screen of fiddly sails attached to its sombre cube come across like a piece of tatty 1970s costume jewellery attached to the sleeve of a storm trooper’s tunic. While there is some access to an embassy garden, the building floats unreal and detached above its surroundings looking every bit the gun-protected sanctum it is.
Despite the humane intent behind this attempt at masquerade, the result ends up being rather sinister, like being mugged by someone wearing a smiley face mask. This begs the question of whether it is actually a good idea to try to soften the look of a building that is inherently defensive. Why not let bunkers be bunkers?
The project is an undeniably tough brief for any architect. The sheer volume of security features KieranTimberlake’s team had to deliver—features that all new embassy buildings require—is formidable. The cube itself needed 6-inch-thick glass panels to be blast proof, with a mandatory set-back of 330 feet from the embassy’s external perimeter. The stockade of steel and cement bollards, as yet imperfectly masked by hedges, needs to withstand the collision force of an 8-ton truck, while the moat beyond ensures that anything that might somehow manage to blast through is swallowed and flooded before reaching the main building. Given the rigor and complexity of these features, it’s no wonder the compound, intended to do service for up to a century, cost $1 billion.
Complementing the site’s setting aesthetically is also a challenge.Dubbed “Dubai-on-Thames,” the riverside strip on London’s Vauxhall neighborhood is bisected by railway viaducts and filled with scrappy low-slung 1970s warehouses that have in recent decades been joined by a rogue’s gallery of new architectural excesses. The embassy’s nearest neighbors include the plastic Egyptian-deco hulk of Britain’s Secret Service Headquarters (nickname “Ceaușescu Towers”); St. George’s Wharf, a hideous rampart of Postmodernism that manages to both blot out the landscape and make its adjacent river walk feel like a private domain; plus a new lipstick-shaped, luxury residential skyscraper that remains woefully under-occupied. With a setting like this, the embassy has a lot to live down to.
In fact, something more openly defensive and austere might have worked better in these surroundings. It’s not as if visual austerity can’t be beautiful. Yes, the now overexposed martial qualities of Brutalism aren’t universally loved, but they contributed to the revelatory quality of actually experiencing buildings constructed in the style. There is a frisson to entering some raw concrete hulk only to realize that its internal spaces are in fact soft, welcoming, and carefully molded. Approaches like KieranTimberlake’s at the new embassy take you in the opposite direction. You see landscaping, softened edges, reflective surfaces, and then realize that you’re still passing by a building whose function is both burrow and panopticon. There’s something a little unsettling about the disconnect.
It’s an approach that nonetheless permeates urban planning, especially in London. Instead of creating buildings and infrastructure that try to appear as if they’re treading lightly, it would be better to create structures that actually do so. That such an approach is genuinely impossible for a building like the new embassy, which requires isolation and protection, gives its awkward appearance some poignancy.
Coup, the cocktail bar that donated all its profits to people and organizations that could be negatively impacted by the Trump administration, will close Saturday to begin a nationwide tour. The bar, which is run by prolific restaurateur Ravi DeRossi, will pop up in cocktail bars around the country, according to Eater, with a schedule forthcoming. [ more › ]
Paul Ginsparg and I were discussing that mortality rate adjustment example. I pointed him to this old tutorial that laid out the age adjustment step by step, and he sent along this:
For mortality rate junkies, here’s another example [by Steven Martin and Laudan Aron] of bundled stats lending to misinterpretation, in this case not correcting for the black cohort having a slightly younger average age plus a higher percentage of women.
As Martin and Aron point out:
Why were these differences by race not apparent in the CDC figure? Because for adults ages 65 and older, blacks and whites looked very different in 2015. The average age of blacks was 73.7 compared with 74.6 for whites. Also, a higher share of blacks ages 65 and older were women: 61 percent compared with 57 percent for whites. Because younger people have lower death rates than older people and women have lower death rates than men, comparing a younger and more female population of blacks with an older and more male population of whites offsets the underlying race differences in death rates.
It is, rather remarkably, Friday. I don’t know how we got here but I’ve learned to not ask too many questions at this point. Let’s just enjoy it before it’s gone, which it most assuredly will be before we’ve really had the chance to fully appreciate it. Speaking of things to appreciate, here is a sound so beautiful you’ll wish you could live in it all the time. Enjoy.
It will, at some point, presumably be warm enough to go enjoy a day at the beach without bringing a light sweater or sweatshirt. The good news is you've got plenty of options when it comes to what beach to go to. The bad news is that one of the options that you had to get to the beach has just melted away, like so many castles made of sand, as the NYC Beach Bus announced they wouldn't be operating this summer. [ more › ]
Team dynamics can make or break a meeting. Have you ever been in a meeting where people interrupt each other, introduce new ideas when they should be building on the conversation, and repeat someone else’s point just to be heard? These communication issues waste time and energy, and usually lead to more meetings to correct misunderstandings, reiterate decisions, or soothe hurt feelings and interoffice tensions.
But there is one thing you can do that can make a significant difference to improving the quality of time you spend in meetings: Listen. By improving the way you listen and understand others in meetings, you can make that time more productive by reducing repetition and misunderstandings.
If simply listening can solve so many problems, why is it so hard to practice? One reason is we’re listening to interrupt with our ideas or rebuttals. We listen so we can jump in with our perspective. Or we’re worried we’ll forget what we want to say if we listen for too long. We focus on our own communication, rather than listening to understand others.
Through my work with executive teams, I’ve developed a simple technique that can help anyone listen more effectively in meetings. I call it Margin Notes. You may already take notes during meetings, but unless you’re using them wisely to understand others and plan your response, you may still fall into the same trap of speaking before you think. Margin Notes allows you to think, process information, make connections between points of discussion, and ask effective questions instead of blurting out the first thing that comes to mind.
Here’s how it works:
Set your page with a wide margin and take notes when someone else is talking. In the main body of your notes, capture only what the other person is saying. These don’t have to be verbatim; just jot down the key points. You can accurately quote individuals later.
In the margin, capture your ideas, judgments, rebuttals, and questions to each of the points you’ve written down. By marking them to the side, you separate your own thoughts from what others say. It lets you set aside (literally) your own voice and gives you space to listen to others. For example, when your boss excitedly outlines idea after idea for a product launch, you might note in the margin, “Ask about budget” or “Remind about CEO memo.”
When you speak, only bring up items from your Margin Notes that haven’t already been addressed and are the highest priority, and cross them off as you go. If you’re unable to raise some topics during the meeting and the items are important to you, tag them for follow-up.
For example, Ari is chief of staff to Brenda, the CEO of a 200-person scientific organization that was struggling. Its main source of funding had been favoring its competitor, and some key people had left to start their own ventures. Tensions were high, and some of the remaining team members were trying to one-up each other in discussions. Others were desperate to take any action as soon as possible. The ensuing miscommunications, high-stakes decisions, and panic led to conflict and unproductive meetings.
Brenda gathered her direct reports to discuss how they might sharpen their efforts in the face of dwindling resources. Ari took these notes following the Margin Notes model:
Ari assessed his Margin Notes and focused his questions during the meeting on the most important issues he had jotted down: What are the decision criteria for budget cuts, and should cuts be spread across projects, rather than cutting projects in their entirety? He waited until the end of the meeting to also ask about cuts in infrastructure and marketing.
Then, in a one-one-one with Brenda, Ari tackled some of his other concerns: “We’re an action-driven culture. Do we need to slow down? Do we lose possibilities by not questioning assumptions?” He also noted, “The team doesn’t question you; they just jump into action. Are we relying too much on your judgment alone? Should some of these decisions be passed on to others in the team?” Lastly, Ari observed, “I worry we may not be fostering a culture of healthy conflict. Jennifer seems nervous whenever Josh and John seem to argue, and tends to turn to your guidance.” There were also several points that Ari chose not to raise because they were low priority at the moment. He marked these comments, so if they continued to be an issue, he could raise them later.
Ari’s Margin Notes enabled him to make a considered decision on how to guide the conversation more strategically toward business outcomes, rather than further fuel the competition between John and Josh. He was then helpful to Brenda by reflecting some of the dynamics he observed in a separate meeting. This allowed Brenda to approach the next meeting’s agenda more thoughtfully and adjust her own behavior. Based on Ari’s comments about the team’s culture, at their next leadership team retreat, Brenda facilitated a discussion about their implicit cultural norms. They collectively brainstormed changes to become a higher functioning team during these lean times.
As you take these notes, don’t just write down the facts of the discussion. Here are some things to consider when taking Margin Notes so you can listen better:
Write down themes from your main notes. When you listen across topics, what is a common theme? How are they related to each other? What’s the bigger story they’re telling? For Ari, his observation about culture was one of these themes.
Capture questions and flag them to ask at the appropriate time. Ari held off on asking the question about cuts across infrastructure and marketing in addition to projects until the end of the meeting so as not to take the focus off the hard trade-offs that needed to be made on projects first. He also took some of the personal dynamics to a private one-on-one with Brenda, rather than openly critiquing other team members in the meeting. This helped him to avoid calling out or embarrassing his colleagues, while also providing an opportunity for Brenda to create conditions for better communication in future meetings.
Test assumptions. When someone makes a general statement for the first time in a meeting, examine it from all angles before considering action. Ari considered several assumptions about how the budget cuts could be implemented and whether there were ways to expand funds instead of simply cutting the budget.
Pay attention to what’s not said. There’s rich data in both what’s unsaid and what is said nonverbally. In Ari’s case, he noticed that no one asked questions or challenged assumptions; they immediately jumped into discussing specific projects and implementing the budget cut. What’s more, he observed some nonverbal behaviors. When John and Josh talked about their projects, they made eye contact with only Brenda and never looked at each other or other team members. It made Ari wonder if John and Josh were competing to lobby Brenda to consider the merits of their projects over others. He decided to raise this concern with Brenda separately so she could look deeper into these projects.
Be discerning about what you ultimately share. You don’t have to share everything from your Margin Notes, especially in a meeting setting. Ari simply asked three questions which shifted the tone of the session. He later followed up privately with Brenda about some of his other concerns, and noted some points that could wait until high-priority items had been completed.
Capturing others’ words helps you track what they’re saying, and by writing down your thoughts next to each point, you can ensure you won’t forget important follow-ups while still digesting the conversation. Allowing yourself to listen more deeply to meetings gives you the opportunity to connect the dots, present your ideas more convincingly, and get more real work done in meetings.
The duplex apartment takes full advantage of the 19th-century building’s domed roof
A penthouse apartment in Gilsey House, the gorgeous 19th-century building at the corner of Broadway and 29th Street, just hit the market, and it’s quite a beaut.
The onetime hotel itself is one of the neighborhood’s most iconic buildings—a “Victorian pile of cast-iron decadence,” as we previously referred to it, and a precursor to the area’s current swank hotel boom.
Courtesy the Museum of the City of New York’s Digital Collection
Gilsey House circa 1895
It opened as a hotel in 1872, attracting celebrities (Oscar Wilde and Mark Twain both stayed there) and tony New Yorkers alike; it was basically the Ace of its day.
But the hotel closed in 1904, and—you know the story—fell into disrepair until the 1980s, when it was redone as a co-op building. It became a New York City landmark in 1979, and was refurbished in the early ’90s. (Says the AIA Guide to New York City: “O happy the day it was in 1992 when the facade was restored and painted cream!”)
Which brings us to today, and the penthouse that’s currently for sale. Situated over two floors within the lovely building, the apartment comes with an unbeatable view of the Empire State Building, both from the living room (which has huge windows) and from a 500-square-foot roof deck.
There are also four bedrooms located on the duplex’s lower floors—and a boatload of closet space—along with three bathrooms, a nice (if somewhat bland) kitchen, and in-unit laundry. But let’s be real: it’s all about the building, and the views. For that, you’ll pay just about $5 million, along with a hefty maintenance fee of $6,601/month.
This week, Brownstoner readers were rather into brownstones, which shouldn't be a surprise, but the most popular listings were all standalones. The most popular listing was a standalone recently renovated with an unusual feature -- wide-plank Douglas fir floors imported from Denmark.
Listings in Bed Stuy were popular again… Read More >
With President Donald J. Trump a reality in the darkest timeline possible, Saturday Night Live opted to address the new era with a cold open about arguably the most powerful man in the world now: Vladimir Putin. [ more › ]
Less than a month after Columbia University graduate students voted to unionizethe first private university graduate student group to do so since the National Labor Relations Board enshrined the right in AugustColumbia is challenging the vote, urging the NLRB to schedule a new election. [ more › ]
You’re sitting quietly at your desk when Tony walks over, perches on your filing cabinet, and starts criticizing your colleague Sam. It’s awkward, but you nod and smile and throw in the occasional “uh huh,” because that seems like the only thing you can do in the moment. Once Tony leaves, your first inclination is to raise your concerns about Tony’s inappropriate gossip to your boss. That feels like the right thing to do to shut down this toxic behavior, but is it? How you respond when someone starts venting can have a significant impact on the dynamic in your office.
Telling your manager about your teammate’s gossip without first expressing your concerns directly could create several harmful perceptions. First, the boss might view you as a tattletale, trying to court favor with her at the expense of your colleague. Worse, if the boss asks what you said to Tony, you have to admit you did nothing to dissuade him from gossiping, painting yourself as passive-aggressive. This leaves you vulnerable to an accurate interpretation from Tony that you are untrustworthy. Taking your concerns about gossip to the boss is likely to leave your reputation more tarnished than that of the gossiper.
Instead, do something to nip the gossip in the bud.
Identifying Harmful Gossip
Don’t jump to the conclusion that every hushed conversation is harmful gossip. It can be legitimate to vent or blow off some steam, and it’s perfectly acceptable to support your teammate in those situations. What’s important is knowing the difference between providing support and enabling gossip.
There are a few telltale signs that you’re on the receiving end of gossip rather than harmless venting. Let’s use the Tony and Sam example to illustrate the point. First, as soon as Tony starts talking about Sam when she’s not present, you should be on guard. Don’t immediately assume it’s gossip, but listen carefully. If Tony focuses on what actually happened, that’s OK. But if he starts making assumptions or accusations about Sam’s intent, that’s problematic.
Another key difference between acceptable and unacceptable comments is whether they are about a person’s behavior or their traits. If Tony says, “Can you believe Sam cut me off three times?” that’s OK, but if he says, “Can you believe Sam is so rude?” that’s stepping over the line. By tolerating negative comments about a teammate, you’re providing an audience for destructive behavior and likely helping to create factions in the office.
There are other signs to watch for as well. If Tony’s comments focus entirely on things that happened in the past, he’s not looking for a constructive conversation. Similarly, if he only wants to talk about the problem and isn’t interested in thinking about a solution, then you’re dealing with destructive behavior.
How to Respond to Gossip
How you should respond to gossip depends on whether you believe the person has a legitimate concern. If you believe there is some truth to the comments your teammate is making, try to get the concerns aired in a forum where they can be addressed constructively. Encourage your teammate to raise the issues directly with the person in question: “Tony, I share your concern about Sam’s comments, but telling me isn’t going to make it better. I think you need to talk to Sam. I’m happy to help you think through how you would approach that conversation.”
Another alternative, if the person’s concerns are warranted, is to help your teammate get the issue out in the open: “I agree that Sam’s comments scuttled the conversation before we had time to give the idea a chance. Why don’t we ask if we can have it put on the agenda for our next meeting?” This lets you signal that you’re happy to be supportive but not willing to be a part of gossip or passive-aggressive behavior.
If you don’t believe your colleague’s criticisms are legitimate, don’t take the easy way out. You have a responsibility to say something. Be sure not to chastise him, because he’ll just assume you’re “not on his side.” Instead, redirect the conversation to provide genuine support.
One technique is to take the third party out of the conversation and focus on how the person you’re talking to experienced the situation. It’s fair game to talk about their reaction, but not to make assumptions about anyone who isn’t present. “How did you feel when Sam said the plan would never work?” “What was your intent when you responded to Sam?” “How are you thinking about the next steps?” Make it clear that you’re happy to talk about the situation and the underlying emotions — just not about people who aren’t there to defend themselves.
Another thing you can do is provide your own feedback about the situation. “When I heard your presentation this morning, I was worried about your plan as well. When you responded to Sam by saying it would be ‘figured out later,’ I didn’t feel confident. Here’s what it would take to get me onboard with the plan.” That way you take the pressure off the third party and help your teammate understand that even his ally has concerns.
Ideally, you can transition from a backward-looking to a proactive conversation. Try to coach your colleague about better ways to approach the situation. “How might you get folks onboard earlier in the future?” “What does Sam look for in a presentation and how might you play to her style next time?” Help the person get past their personal reaction and move on to a constructive plan.
If you force the gossiper to have a mature, constructive conversation, it’s likely that the gossip is going to stop — though not guaranteed. Some people just don’t seem to get the message! If your attempts to limit the mudslinging fail, it might be appropriate to raise the issue with your manager. But don’t let that conversation feel like schoolyard tattling. Stay as objective as possible and simply draw attention to an interpersonal issue that needs to be resolved. You could try saying, “Tony is struggling with Sam’s criticism of his plan, and I haven’t been able to help him resolve the issue. I think you need to get involved.” If your manager asks you to comment on Tony or Sam, just say that it would be better for her to talk with them directly.
Gossiping about a colleague is a sign of a toxic work environment where politics and personalities are getting more attention than the task at hand. It’s tempting to raise your concerns to your manager, but that’s the passive-aggressive route. Instead, give your frustrated teammate a chance to close the door and vent. But don’t let that go on for long before you shift toward a more constructive conversation. If you’re unable to help the person remedy the problem, involve someone who can before the toxic behavior infects the whole team.
In 1852, the abolitionist Frederick Douglass asked an audience what the Fourth of July should mean to a population of enslaved African Americans. Forty-eight years later, still pondering the question of “independence” for the formerly enslaved, a group of black researchers attempted to quantify the answer in sociological terms. Among this study group was the noted scholar W.E.B. Du Bois and Booker T. Washington, a man normally billed as Du Bois’ intellectual rival. Together, they worked under the tutelage of the prominent black lawyer Thomas J. Calloway to create an exhibit for the Paris Exposition Universelle world’s fair in 1900.
The researchers worked with students from historically black colleges including Atlanta University and Tuskegeeto compile hundreds of photographs, maps, and other illustrations documenting the African-American experience in the decades after slavery. Dubbed “The Negro Exhibit,” it was a true FUBU operation—meaning “planned and executed by Negroes,” as Du Bois referred to it in an article for the November 1900 edition of The American Monthly Review of Reviews.
This exhibit of visual data on African Americans at the turn of the 20th century still holds up against a lot of Adobe-generated infographics created by data specialists today. The Intercept’s research editor Josh Begley recently teased on Twitter that Du Bois “ethered your data visualizations 100 years ago.“ And Allison Meier waxed about the exhibit in a July 4th post for the arts and culture blog Hyperallergic :
Looking at the charts, they’re strikingly vibrant and modern, almost anticipating the crossing lines of Piet Mondrian or the intersecting shapes of Wassily Kandinsky. But they are in line with innovative 19th-century data visualization, which included Florence Nightingale’s “coxcomb” diagrams on causes of war mortality and William Farr’s dynamic cholera charts. Du Bois himself used horizontal bar graphs in his 1899 study The Philadelphia Negro.
Calloway wrote in 1901 in the “Report to the Commissioner-general for the United States to the International Universal Exposition” that the goal for the exhibit was to “show ten things concerning the negroes in America since their emancipation.” Among those things was the “education of the race” and the effects of that education on occupation, property, business and industrial development for African Americans. Below are a few of the data visualizations, as archived at the Library of Congress that focus on Georgia, which at the time had the largest black population in the U.S.:
New details have emerged for Circa, a new condo rising on Central Park's northwest corner
Sales have yet to launch for Circa, the semicircular condo building taking shape on Central Park's northwest corner, but details on the building have been coming out in dribs and drabs. Today brings another new piece of information, courtesy a Wall Street Journal profile; according to the story, ten "affordable" condos, priced between $227,000 and $384,000, will join the 38 market-rate units that were previously announced. Those will start at approximately $1 million, and the building's most expensive unit will be a $10 million penthouse with five bedrooms and a private outdoor space. The apartments aren't set to debut until next year, but a sales office is due to welcome prospective buyers sometime in the next month.
The WSJ piece also offers some details from FXFOWLE, which designed the building; according to Dan Kaplan, a senior partner at the firm, the unique shape of the property (it's situated within Frederick Douglass Circle at West 110th Street) was part of the appeal. The architects also took inspiration from the building's location for the design: Colors were chosen to complement either the park- or Harlem-facing sides of the building, while a brick facade that's closer to West 111th Street was chosen specifically because it resembles the neighborhood's existing townhouses.
Neighborhood integration is a great goal, but just because a place is currently home to more than one race doesn’t mean it will retain this diversity in the decades to come. A new study published in Sociological Science explores this potential future for New York, Chicago, Los Angeles, and Houston.It finds that 35 percent of all neighborhoods in these cities—around 3,800 total—are likely to resegregate in the next two decades.
“Neighborhoods in many major metropolitan areas of the U.S. appear integrated, simply because different races are present,” Bader, who is an assistant professor of sociology at American University, said via press release. “But these neighborhoods are not the portrait of long-term, racially integrated neighborhoods.”
Bader and his colleagues tracked how populations of whites, blacks, Latinos, and Asians changed between 1970 and 2010 in the four cities analyzed. By their definition, a neighborhood was considered diverse if a second racial group made up at least 10 percent of the population. They explain how their technique (known as a “growth mixture model”) differs from previous ones, via the study website:
This allows us to group neighborhoods by the timing and pace of change. Other studies typically only look at the the presence of groups, which they define as some percentage of the population. We can distinguish a neighborhood where, for example, the Latino population increases from 10% to 60% from one that increases from 10% to 15%. Other studies can't tell the difference between those two changes.
Using this technique, Bader color-coded neighborhoods in these four cities based on the following 11 categories, each of which represents a different pattern of racial change since 1970:
“Stable black” (dark green): These neighborhoods had a large black majority in the time right after the passage of the Civil Rights Act, and that population has remained roughly stable in the decades since (apart from a small growth in Latino residents).
“White flight” (bright green): These neighborhoods saw a brief period in which black and white residents lived here, followed by an exodus of all its white residents. They now have pretty high shares of black residents.
“Steady black succession” (pale green): Shares of Black residents rose here after 1980—and kept rising. These neighborhoods now look similar to the ones that experienced white flight.
“Latino enclaves” (navy blue): These neighborhoods already contained large Latino populations in the 1970s, which only increased in the decades after. Today, these are generally majority-Latino neighborhoods.
“Early Latino growth, white decline” (royal blue): These were white neighborhoods that saw an influx of Latinos in the 1980s; in the decades after, these Latino populations grew.
“Early Latino growth, black decline” (teal) : These were originally black neighborhoods that saw a growth in Latino residents in the decades after 1980.
“Recent Latino growth” (sky blue): Shares of Latino residents in these neighborhoods increased in the 1990s, then again in the 2000s (although at a slower pace).
“Asian growth” (pink): These locales saw a growth in their Asian population in the 1990s and the 2000s.
“Quadrivial neighborhoods” (fuchsia): These are neighborhoods that are “stably integrated,” according to Bader, meaning that they’ve seen their black, Latino, and Asian populations increase slowly; they’re likely to remain diverse in the next two decades.
“Latino growth, then decline” (orange): These resembled Latino enclaves in 1980s. In the 1990s and 2000s, the share of whites in these neighborhoods increased, and the share of Latinos decreased.
“Stable white” (white): These neighborhoods contained predominantly white residents in the 40 years after the Civil Rights Act was passed, and have started to diversify in recent years.
Here are screenshots of the interactive maps Bader created based on the above categories:
New York
Chicago
Los Angeles
Houston
Bader’s analysis predicts that, in the next two decades, many of the neighborhoods in the pale green (“steady black succession”), navy blue (“Latino enclaves”), royal blue (“early Latino growth, white decline”), teal (“early Latino growth, black decline”), sky blue (“recent Latino growth”), and pink (Asian growth) categories are the ones where a single racial group will become dominant over time. Here’s Bader on that process, again via the study website:
We were disappointed to learn that many integrated neighborhoods were actually experiencing slow, but steady resegregation — a process that we call "gradual succession." The process tended to concentrate Blacks into small areas of cities and inner-ring suburbs while scattering many Latinos and Asians into segregating neighborhoods throughout the metropolitan area.
Meanwhile, the fuchsia “quadrivial” neighborhoods, located in the suburbs like Aliso Viejo, California, and Naperville, Illinois, are likely to retain their diversity for some time. (Of course, as my colleague Amanda Kolson Hurley has noted, in general, diverse suburbs aren’t immune to the threat of resegregation.) Despite fair housing and civil rights legislations, housing discriminationis anongoingproblem with multigenerational effects—and one of the possible reasons behind the trends Bader has highlighted in the study. Another is the tendency of white Americans to self-segregate.
“Blacks and Latinos are open to moving to different neighborhoods. Whites are largely unwilling,” Bader said, in the press release. “Whites are OK if integration comes to them, but they don’t actively seek it out.”


 East 9th Street between First Avenue and Avenue A.
/cdn.vox-cdn.com/uploads/chorus_asset/file/19737575/EV5.jpg)
/cdn.vox-cdn.com/uploads/chorus_asset/file/19737646/EV7.jpg)
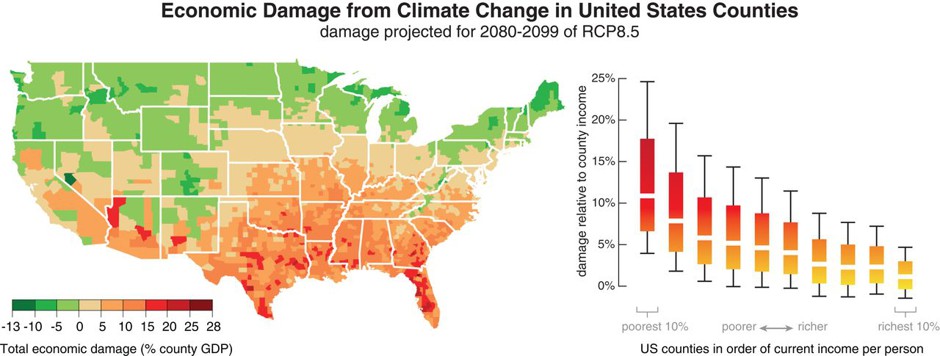

/cdn.vox-cdn.com/uploads/chorus_asset/file/13417011/Screen_Shot_2018_11_09_at_12.08.47_PM.png) WXY
WXY
/cdn.vox-cdn.com/uploads/chorus_asset/file/13410337/Screen_Shot_2018_11_08_at_1.05.24_PM.png) Courtesy WXY
Courtesy WXY
/cdn.vox-cdn.com/uploads/chorus_asset/file/13410347/Screen_Shot_2018_11_08_at_1.06.37_PM.png) Courtesy WXY
Courtesy WXY
/cdn.vox-cdn.com/uploads/chorus_asset/file/13410375/image_008.jpg) Courtesy WXY
Courtesy WXY
/cdn.vox-cdn.com/uploads/chorus_asset/file/13410357/Screen_Shot_2018_11_08_at_1.08.16_PM.png) Courtesy WXY
Courtesy WXY


 It will, at some point, presumably be warm enough to go enjoy a day at the beach without bringing a light sweater or sweatshirt. The good news is you've got


/cdn0.vox-cdn.com/uploads/chorus_asset/file/8127881/gilseyold.jpg) Courtesy the Museum of the City of New York’s Digital Collection
Courtesy the Museum of the City of New York’s Digital Collection
/cdn0.vox-cdn.com/uploads/chorus_asset/file/8127833/250950628.jpg)
/cdn0.vox-cdn.com/uploads/chorus_asset/file/8127835/250950646.jpg)
/cdn0.vox-cdn.com/uploads/chorus_asset/file/8127847/250950605.jpg)
/cdn0.vox-cdn.com/uploads/chorus_asset/file/8127843/250950681.jpg)
/cdn0.vox-cdn.com/uploads/chorus_asset/file/8127845/250950720.jpg)
/cdn0.vox-cdn.com/uploads/chorus_asset/file/8127851/250950602.jpg)
/cdn0.vox-cdn.com/uploads/chorus_asset/file/8127853/250950693.jpg)
/cdn0.vox-cdn.com/uploads/chorus_asset/file/8127857/15d1fb7b6f0f4ed20d42aa3db1f4146afb956881.jpg)
 With President Donald J. Trump
  Less than a month after Columbia University graduate students