Shared posts

18 Jun 23:31

Two Ways to Visualize Canada’s Wildfires

by Jonathan Crowe

European Space Agency map of Canada showing average concentration of carboon monoxide for 1 May to 13 June 2023.

The European Space Agency released this map showing the impact on atmospheric carbon monoxide from Canadian forest fires. “Using data from the Copernicus Sentinel-5P mission, the image shows the average concentration of carbon monoxide for 1 May to 13 June. The extremely high concentrations, which are depicted in deep tones of orange, can be linked to active fires during the time. The image also shows how this air pollutant was carried as far as New York in the USA and over the Atlantic.”

Also from the ESA: this animated map of fire outbreaks in Canada during the same period.

Previously: Fire and Smoke Forecast Maps; Wildfires in Alberta.

11 Jun 23:49

weeklyOSM 672

by weeklyteam

30/05/2023-05/06/2023

lead picture

“OpenStreetMap Sandbox” in the NULL Island area. © Moritz Schott, et al (2022) ‘Deleted OSM Elements‘ University of Heidelberg [1] | map data © OpenStreetMap contributors

Mapping

  • Anne-Karoline Distel suggested we take a look at our cities to discover and map the urine deflectors built in the 19th century (in Europe) to prevent public urination. She has also created a wikipage and explained the background information on this topic.
  • One of the unexpected risks of mapping from aerial imagery alone is that the town may have moved since the imagery was taken.
  • Jan Olieslagers promoted mapping runways as area, contrary to common practice. Make sure to also read the comments to get the full picture.
  • The HOT Open Mapping Hub Asia Pacific has started two mapping/validation projects. Their objective is to map the location of ponds and assist Hasiru Aqua, an aquaculture startup, in supporting farmers in India.
  • During the COVID-19 pandemic lockdowns, Nick Johnston spent lots of time collecting addresses in Cheltenham, south-west England, and added them to the map. In his blog, he published the lessons learned while doing this and encourages readers to go out and map as well.
  • nocom888 was motivated by u/sporesofdoubt‘s work (we reported earlier) to micro-map parks and other places that would benefit from more details in OpenStreetMap.

Mapping campaigns

  • The Trufi Association reported on the visit of Taylor Reich, an Institute for Transportation and Development Policy researcher, to the ‘Duitama Mapping Stars’, an OpenStreetMap mapping club for teenagers in Colombia.

Community

  • Ilya Zverik was chosen as OpenStreetMap Belgium’s Mapper of the Month.
  • Marcus Jaschen shared 
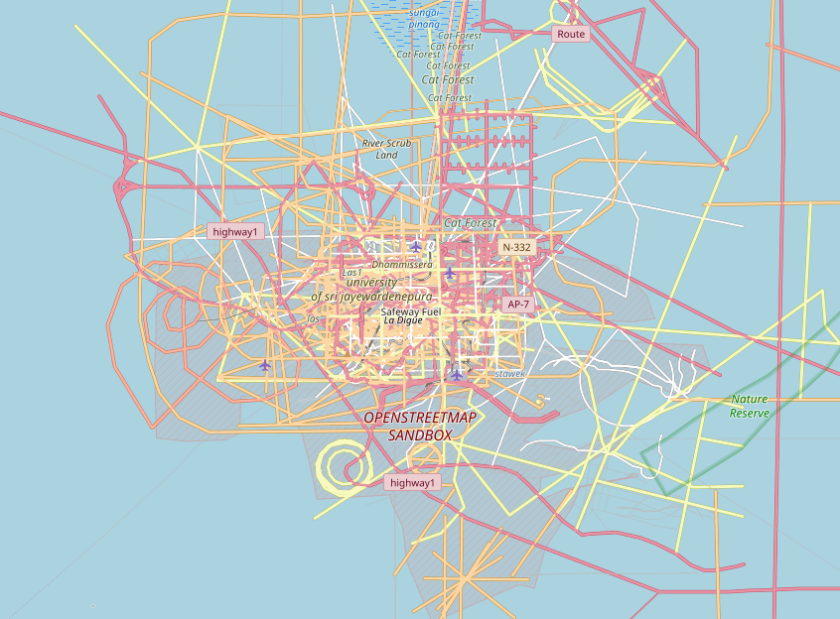
his approach in planning a bike or hiking route along a specific path, for example a river, with the help of OpenStreetMap.
  • Doc Searls and Katherine Druckman talked with Roman Tsisyk, founder and top maintainer of Organic Maps.

OpenStreetMap Foundation

  • Courtney Williamson explained OpenStreetMap’s fundraising strategy.

Local chapter news

  • Oliver Rudzick reported that the plant mapping project on OpenStreetMap has been selected as a top ten finalist of the Auf die Plätze! Citizen Science in Deiner Stadt programme. The collected plant location data will be used to study the influence of local vegetation distribution on microclimate conditions in the area.

OSM research

  • Yair Grinberger, co-chair of the OSMScience 2023 conference, announced that abstract submission for the conference has opened. This sixth edition of the conference will be part of the State of the Map Europe 2023, taking place from 10 to 12 November in Antwerp (Belgium) and online.

Maps

  • [1] In a blog post about deleted OSM elements, HeiGIT published a short interview with the developer of deleted_maps, Moritz Schott. The project is hosted on GitLab.

switch2OSM

  • Lyft, a ride-hailing company in the United States, explained how it migrated from Google Maps to OpenStreetMap.
  • Sébastien Hinderer, a blind person, tested ‘SonarVision’, a navigation app for people with disabilities.

Open Data

  • Jennings Anderson (Meta) and Mike Jeffe (AWS) released a tutorial on analysing OpenStreetMap data using the Amazon Athena platform.

Software

  • Roland Olbricht, Overpass API developer, reviewed the Overpass installation guides written by Brian Sperlongano (ZeLonewolf) and Kai Johnson and provided additional helpful tips.
  • Organic Maps is looking for ambassadors, active people with initiative, who will be the face and voice of Organic Maps in their region and their language.
  • OsmAnd 4.4.5 has been released for iOS. The update contains a new track recording widget, a navigation profile for train travel, and search updates.
  • OsmAnd is now 13 years old and they shared some screenshots from the first version.

Programming

  • cyton showed how he extracts Mapillary images from Gopro Max 360° videos.
  • Andrew Heiss explained how to create fancy road trip maps using R and OpenStreetMap data.
  • rtnf analysed OSM’s tile logs for domain names and apps to see who is using OSM and shared his code on GitHub.
  • zabop showed us his workflow to find the unmapped bicycle stations in Oslo by comparing OpenStreetMap data to the station list from Oslo Bysykkel (Oslo City Bike).

Releases

  • Pascal Neis released an analysis of reverted edits in OpenStreetMap data.

Did you know …

  • … OpenCage’s GeoTrivia May 2023 offers a captivating recap of the latest geographical trivia questions and answers from May? It provides an engaging opportunity for readers to test their geographic knowledge and discover fascinating facts about the world. It’s an entertaining and educational read for geography enthusiasts and curious minds alike.

Other “geo” things

  • The Mapping Diversity project has analysed the street names of 30 European cities and found, among other statistics, that there are ten times more streets named after men than after women.

Upcoming Events

Where What Online When Country
Richmond State of the Map United States 2023 2023-06-08 – 2023-06-11 flag
Rīga State of the Map Baltics 2023 2023-06-08 – 2023-06-09 flag
Windsor MapRoulette-A-Thon 2023-06-09 flag
Marseille State of the Map France 2023 2023-06-09 – 2023-06-11 flag
Berlin 180. Berlin-Brandenburg OpenStreetMap Stammtisch – 15 Jahre – mit der Wikipedia-Community 2023-06-09 flag
Zürich OSM-Stammtisch 2023-06-10 flag
Hannover OSM-Stammtisch Hannover 2023-06-10 flag
København OSMmapperCPH 2023-06-11 flag
MapRoulette Nights 2023-06-11
Bari FOSS4G-it 2023 2023-06-12 – 2023-06-17 flag
no location Announcement of SotM Asia 2023 winning bid + recruitment of support from global community 2023-06-12
Grenoble Atelier du groupe local OSM Grenoble 2023-06-12 flag
OSMF Engineering Working Group meeting 2023-06-14
Salt Lake City OSM Utah Monthly Map Night 2023-06-15 flag
Stainach-Pürgg Neunter Österreichischer OSM-Stammtisch (online) 2023-06-14 flag
Eti Osa Open Source for Good with Open Street Maps 2023-06-15 – 2023-06-17 ng
UN Mappers – OSM and humanitarian mapping training – session #7 2023-06-15
Köln Missing Maps Mapathon meets Medex 2023-06-15 flag
Kaiserslautern OSM Mapping Event Erfassung von Barrieren 2023-06-17 flag
City Of Cockburn Social Mapping Saturday: Port Coogee 2023-06-17 flag
Waterford City Metropolitan District Using OpenStreetMap to record place names 2023-06-17 flag
Toulouse Réunion du groupe local de Toulouse 2023-06-17 flag
MapRoulette Nights 2023-06-18
삼성2동 국경없는의사회 한국지부 Missing Maps 온라인 매파톤 2023-06-20 flag
Gent OpenStreetMap meetup in Gent 2023-06-20 flag
Lyon Réunion du groupe local de Lyon 2023-06-20 flag
164. Treffen des OSM-Stammtisches Bonn 2023-06-20
San Jose South Bay Map Night 2023-06-21 flag
Lüneburg Lüneburger Mappertreffen (online) 2023-06-20 flag
Karlsruhe Stammtisch Karlsruhe 2023-06-21 flag
Mainz OpenStreetMap-Stammtisch Mainz 2023-06-21 flag
UN Mappers – OSM and humanitarian mapping training – session #8 2023-06-22
Hlavní město Praha Missing Maps MSF CZ Mapathon at Logio 2023-06-22 flag
Localidad Teusaquillo Junta Bimensual OSM LATAM – Junio June 2023-06-24

Note:
If you like to see your event here, please put it into the OSM calendar. Only data which is there, will appear in weeklyOSM.

This weeklyOSM was produced by MatthiasMatthias, PierZen, SeverinGeo, Strubbl, TheSwavu, barefootstache, cafeconleche.
We welcome link suggestions for the next issue via this form and look forward to your contributions.


21 May 16:46

Leventhal’s Urban Atlas Explorer Atlascope Is Expanding, Seeking Sponsors

by Jonathan Crowe
A screenshot of the Leventhal Map Center's Atlascope platform, which presents late 19th- and early 20th-century urban atlases in a web interface overlaid on a modern street map.
Atlascope (screenshot)

Speaking of georeferencing old maps, the Leventhal Map Center at Boston Public Library has a collection of late 19th- and early 20th-century urban atlases. Their Atlascope platform presents 101 of them in a web interface overlaid on a modern street map. The Leventhal is now looking to expand Atlascope’s coverage beyond the Boston area to towns and counties across Massachusetts, and is raising funds to do so (it can apparently take 60 hours to process one atlas). Details on sponsoring an atlas here. See their Instagram post.

05 Mar 14:04

Rising Sea Stripes

by Keir Clarke
NPR has been investigating how rising sea levels are causing coastal erosion in the city of Saint-Louis, Senegal. 75% of Senegal's coastline is at risk of coastal erosion and, in recent years, some neighborhoods of Saint-Louis have already experienced devastating floods. In Disappearing Saint-Louis NPR has used a series of maps to show how Saint-Louis is located precariously between the
04 Feb 12:26

A Kickstarter Project to Rediscover 19th-Century Atlases

by Jonathan Crowe

Alejandro Polanco’s latest Kickstarter, Geography 1880, is in the vein of some of his previous ones: restoring and reprinting works from the late 19th century. This time he’s looking to create an anthology of maps from family and school atlases of the era.

The idea is to give shape to a new atlas that brings together maps forgotten in time that were once enjoyed again and again, by the light of a fire or gas lamps, from the great era of family atlases. To this end, I am undertaking a process of scanning the atlases of the period between 1860 and 1900 that I have in my library. Alongside this material, the book includes maps from various map libraries around the world (from USA, Spain, UK and Germany), with the corresponding attribution. All this forms an atlas full of authentic 19th century works of art that I hope will spark the imagination of my backers just as it was in the 1880s. Alongside the maps and illustrations of the period, my descriptive commentaries include details of the graphic styles, cartographers and geographical curiosities that appear on each page.

Hardcover, softcover and PDF versions will be produced, the hardcover in a 100-copy limited edition that has already been spoken for.

Previously: A Project to Restore a 19th-Century Treatise on Hand-drawn Mapping.

29 Jan 15:12

The Unreal Ebstorf Map

by Jonathan Crowe

A screenshot from the interactive Ebstorf Map (British Library)

The Ebstorf Map, a 13th-century mappa mundi, was destroyed by bombing during World War II; it survives only as black-and-white photographs and colour facsimiles of the original. Those images were used by the Leuphana Universität Lüneburg to create a digital version in 2008. And now that digital version has been used to create an interactive version of the Ebstorf Map using a video game engine. The British Library’s Medieval Manuscripts blog has the details.

The British Library has collaborated with Escape Studios’ School of Interactive and Real Time to create an interactive version of the Ebstorf map. A team of students and graduates participated in the ‘Escape Pod’ incubator to create a 3D version of the map, using the digital facsimile created by Leuphana Universität Lüneburg.

The interactive map, created in Unreal Engine, has been set in a fictional medieval scriptorium to suggest the tone of the space in which it was created. All aspects of the room were imagined, researched and created by the students at Escape.

The interactive map ties in with the British Library’s ongoing exhibition, Alexander the Great: the Making of a Myth; the map’s 15 clickable points of interest relate to Alexander. Details here.

It sounds like overkill, albeit a fun kind of overkill. It’s a free download, but requires a PC with a graphics card (i.e., no integrated graphics) running Windows 10, so I can’t try it out. But if you can, and want to, you can download it here.

22 Jan 14:02

weeklyOSM 652

by weeklyteam

10/01/2023-16/01/2023

lead picture

Osmose QA introduces a new check [1] | © Public Domain

Breaking news

  • The next public OSMF Board meeting will be held in the online boardroom on Thursday 26 January at 13:30 UTC.
    The preliminary agenda is on the Board/Minutes/2023-01 wiki page and this is also where the draft minutes will be added.The topics to be covered are:
    • Treasurer’s report
    • Provisional 2023 budget
    • Strategic plan – formal structure report
    • Advisory Board – monthly update
    • Monthly presentation – YouthMappers
    • Guest comments or questions.

    Find out on the Monthly Board Meetings wiki page how to have future board meetings automatically added to your calendar.

About us

  • Do you read our blog in English?
    Do you want to read the new issue two days earlier?
    Do you want to help prepare weeklyOSM?
    Are you a native English speaker?
    Then we are looking for you!
    Write us a short email to info at weeklyosm dot eu and we will let you know how you can help.
  • From this issue we are publishing our weeklyOSM articles under the CC0 licence instead of CC-BY-SA. You can link, cite, reuse or rephrase our articles without restrictions. Nevertheless we are of course happy if you still attribute us.

Mapping

  • One culture’s profanity may be another’s street name. Meta’s #ProfanityCleanup edits triggered a discussion on Talk-GB about this topic.
  • Andy Townsend (SomeoneElse) documented how he followed a path that existed only on a map and concluded that it doesn’t belong in OSM.
  • Mateusz Konieczny is seeking the community’s view on the difference between surface=fine_gravel and surface=compacted.
  • Voting is underway on the proposal to extend the usage of utility=* to apply consistently to service/industrial buildings and cabinets, until Thursday 26 January.

Community

  • In the Geomob Podcast #164 Ed Freyfogle chatted with Simon Poole, OSM mapper since 2010, former chair of the OSMF, and maintainer of Vespucci, about his perspective on OpenStreetMap.
  • The OpenStreetMap Ops Team gave an update on the status of the migration of the old forum content to the new OSM Community forum.

Local chapter news

  • The OpenStreetMap Polska Association is proud to announce the signing of an agreement with CloudFerro, the operator of the Creodias platform to enable, but not limited to, further development of the www.openaedmap.org project.

Events

  • @dukera, in a video, explained how Overpass can be used in geospatial intelligence.
  • Edward Betts is going to talk at the upcoming FOSDEM about linking OpenStreetMap and Wikidata.

OSM research

  • A paper from HeiGIT and GIScience at Heidelberg University, on improving the accuracy of OSM missing building detection in sub-Saharan Africa, was featured on the May 2022 cover of Transactions in GIS. The team proposed a novel few-shot transfer learning method (FSTL) to improve humanitarian organisations’ mapping workflows in the Global South. Further details on the approach, and its current limitations, is available on the HeiGIT site.

Licences

  • Pieter Vander Vennet investigated, using Overpass, what licences MapComplete users are applying to their uploaded pictures. The vast majority are uploaded with the default licence, being CC0/public domain. Power users, though, often change the licence to CC-BY or CC-BY-SA. As a by-product of his investigation, a ranking of MapComplete’s most active users has been compiled, led by ‘legendary mapper’ Awo.

Software

  • Anne-Karoline Distel spotted that Field Papers was not working (see also a Reddit thread). Ciarán (DeBigC) reported it on GitHub and, fortunately, Alan Maconchie restarted the server. However, as with other Stamen services, they are looking for others to take on support.
  • James Milner found that ChatGPT is pretty good at generating GeoJSON.
  • GeoDesk reported a new feature: stats queries. The thread includes various examples of typical queries, from the opening hours of pubs in Scotland, to the length of rivers in Colorado.

Programming

  • MTRNord tooted that they have created a script to quickly build transit maps using the Cartes tool, after it was reported on weeklyOSM.

Releases

  • QA tool Osmose has introduced a new check for buildings on agricultural land that appear to be too large.

Did you know …

  • … there are special phrases that cause Nominatim to search for a specific key=value pair?
  • … if you mix up latitude and longitude, Alvin Bryan has some tips to remember them correctly?

OSM in the media

  • Carey Davies, writing in The Great Outdoors magazine, provided in-depth analysis of recent mountain rescue incidents in the English Lake District, which were occasioned by the use of outdoor hiking apps based on OpenStreetMap data. Earlier, The Guardian and online magazine Grough had also covered this topic. It is these reports that led to SK53’s path analysis, which we reported earlier.
  • Alex Roddie, quoted in The Great Outdoors article above, published his own detailed analysis of the use of OpenStreetMap by a range of outdoor hiking applications. He received a lot of feedback from experienced UK-based mountain guides on both Twitter and Mastodon.
  • Netzpolitik recommended installing StreetComplete and other FOSS tools to rid yourself of GAFAM.

Other “geo” things

  • Google Maps has introduced a visual positioning system ‘to provide location and navigation services for users of its AR “Live View” feature’.
  • Giorgia Tolfo blogged on how the Living with Machines project is digitising 19th century Ordnance Survey maps from the British Library. The work is complementary to the well-known historical maps hosted by the National Library of Scotland, as the focus is on maps not already available digitally. Living with Machines is the flagship Digital Humanities project of the Turing Institute, the UK national AI research institute.
  • The American Geographical Society published its ‘Map of the week’ with the title ‘What does the land under Antarctica’s ice sheet look like?’.
  • Christoph Hormann wrote about the open licensing of map designs.
  • Abhishek Nagaraj and Scott Stern have written an essay on the distinctive economic properties of maps and the role that geographic information plays in economic geography.
  • Astronomers also create maps. See the universe from above!

Upcoming Events

Where What Online When Country
Dar es Salaam State of the Map Tanzania 2023-01-19 – 2023-01-21 flag
Budapest Hiking by the pipeline between Normafa-Stop Shop-Aranyvölgy 2023-01-21 flag
Toulouse Réunion du groupe local de Toulouse 2023-01-21 flag
Downtime 2023-01-22
Bremen Bremer Mappertreffen (Online) 2023-01-23 flag
OSMF Engineering Working Group meeting 2023-01-24
Düsseldorf Düsseldorfer OpenStreetMap-Treffen 2023-01-25 flag
[Online] OpenStreetMap Foundation board of Directors – public videomeeting 2023-01-26
IJmuiden OSM Nederland bijeenkomst (online) 2023-01-28 flag
南区 京都!街歩き!マッピングパーティ:第35回 六孫王神社 2023-01-29 flag
Windsor OSM Windsor-Essex Monthly Meetup 2023-01-31 flag
San Jose South Bay Map Night 2023-02-01 flag
Hannover OSM-Stammtisch Hannover 2023-02-06 flag
MapRoulette Monthly Community Meeting 2023-02-07
Stuttgart Stuttgarter Stammtisch 2023-02-07 flag
City of Westminster Missing Maps London Mapathon 2023-02-07 flag
Zürich OSM-Stammtisch 2023-02-08 flag
München Münchner OSM-Treffen 2023-02-08 flag
Salt Lake City OSM Utah Monthly Map Night 2023-02-09 flag
Neufchâteau OpenStreetMap – Réunion à Neufchâteau 2023-02-09 flag

Note:
If you like to see your event here, please put it into the OSM calendar. Only data which is there, will appear in weeklyOSM.

This weeklyOSM was produced by MatthiasMatthias, Nordpfeil, PierZen, SK53, Strubbl, TheSwavu, YoViajo, derFred.
We welcome link suggestions for the next issue via this form and look forward to your contributions.

22 Jan 00:08

‘One Bad Map a Day in February’

by Jonathan Crowe

#mapfailbruarychallenge: a list of categories to create one bad map a day in February.

It’s like the #30daymapchallenge in November, in which mapmakers are challenged to make a map a day on a given daily theme, only the reverse: the MapFailbruaryChallenge is about making a bad map on a given daily theme. “The idea is to create the worst map possible.” Bad maps happen; will a deliberately bad map be better or worse? Either way, it’s probably worth stocking up on popcorn for when maps with the #mapfailbruarychallenge hashtag start showing up on our timelines.

(Failbruary. Fai-EL-bru-AIR-y. Say that ten times. And resign yourselves to the fact that Reddit is probably going to kick everyone’s ass on this.)

Update, 19 Jan: There’s an official website now.

25 Dec 12:50

A Christmas Map Roundup

by Jonathan Crowe
Detail from Willem Barentsz, <em>Map of the Polar Regions</em>, 1598, showing a man wearing a red suit in a sleigh being driven by reindeer.
Detail from Willem Barentsz, Map of the Polar Regions, 1598. Newberry Library.

The Newberry’s David Weimer explains the presence, in a 1598 map of the Arctic Circle, of a man in a red coat riding in a sleigh pulled by reindeer.

Maps Mania links to two Santa trackers: NORAD’s and Google’s.

In a post from last year, James Cheshire notes how Indian and Chinese laws about depicting their contested borders are reflected in Christmas ornaments made in each country. [Mappery]

04 Dec 13:19

Anton Thomas’s Wild World: A Progress Report

by Jonathan Crowe
Anton Thomas’s Wild World map, incomplete. Several continents are finished, but oceans and Antarctica are only fainly outlined. It’s using the Natural Earth projection.
Anton Thomas

Anton Thomas gives us an update on the map he’s been working on for the past two years: Wild World. “With much ocean ahead, and Antarctica, I think it’ll take another year to finish. But most of the land is done. And prints of certain continents are already available, so the map is going well. It’s just . . . more complex and detailed than I ever dreamed.”

Previously: Anton Thomas’s Next Project: Wild World.

Update, 20 Jan 2023: Interview with MapLab.

04 Dec 13:15

Explore Inside the Pyramid of Giza

by Keir Clarke
Go Inside the Great Pyramid of Giza is an amazing virtual 'Street View' tour of the normally closed inner chambers of the Khufu Pyramid in Egypt. This guided tour allows you to explore the interior three chambers of the pyramid, including the King's Chamber, the Queen's Chamber and the subterranean chamber, which is cut into and decends into the bedrock below the pyramid itself. The Khufu
05 Nov 23:53

Mapping the World's Flora & Fauna

by Keir Clarke
The popular Pla@ntnet website can help you identify the species of any plant just by submitting a photograph of the plant. Pla@ntnet has now also released a new interactive mapping tool which can list all the different species of plants that can be found in any chosen area.GeoPl@netNet is a simple tool which allows you to draw an area on an interactive map to discover which species of plants
05 Nov 23:53

The 30DayMapChallenge is Back

by Keir Clarke
The 2022 30DayMapChallenge begins tomorrow (1st Nov). The idea behind the 30DayMapChallenge is to create a map around a different theme every day of November. You can use any tools or technologies that you want to create your maps (and of course there is no actual requirement that you have to make a map every single day). You can view a calendar showing each day's unique theme on the
30 Oct 04:44

Tracking the Russian Invasion of Ukraine with Satellite Imagery

by Jonathan Crowe

Bloomberg’s MapLab newsletter looks at how freely available satellite imagery has enabled widespread monitoring of the Russian invasion of Ukraine.

When the invasion of Ukraine started, these images started popping up on social media and in the news so often that it seems like most of us have access to advanced satellite imagery intelligence in real time. […] But the role of commercial providers in acquiring and sharing so many images with such regularity is unprecedented. Their rise has made military-grade intelligence available to pretty much everyone who wishes to look into it.

What’s notable is that because the satellites are commercial, the images aren’t classified.

16 Oct 18:58

How to Lie With Maps

by Keir Clarke
Nicholas Lambert has created an excellent demonstration of how easy it is to lie with maps. His interactive visualization of France's national strike allows you to customize the appearance of the turnout based on your own political persuasion. The map helps to underline the truth that design choices made when creating data visualizations can have profound effects on the messages that they
02 Oct 02:12

How Well Do You Know Your Boundaries?

by Keir Clarke
You can find out how well you know the extent of your neighborhood by playing Axios' new interactive boundary drawing game. In Draw Your Neighborhood you are asked to draw an outline on a map to show where you think your neighborhood boundary lies. Once you have drawn the boundaries for a few of your city's neighborhoods you can compare how well your local knowledge compared to other Axios
02 Oct 02:12

Annotating Vintage Maps

by Keir Clarke
At the weekend I released an annotated translated version of the Borgia Mappa Mundi, a German map of the world which was made around the middle of the 15th Century. This annotated version of the map was very easy to make using my Leaflet-IIIF-GeoJSON web application. Leaflet-IIIF-GeoJSON allows you to view and annotate IIIF images in a Leaflet.js interactive map. With Leaflet-IIIF-GeoJSON you
18 Sep 01:05

Wildfire Aware

by Jonathan Crowe
Screenshot of Wildfire Aware map
Esri (screenshot)

Wildfire Aware is an interactive map of wildfires in the United States that lists fires by the number of personnel fighting them. Selecting a fire brings up a lot more information, drawn on 22 layers from Esri’s ArcGIS Living Atlas of the World. [ArcGIS Blog]

18 Sep 01:04

The Disastrous Growth of Arctic Wildfires

by Keir Clarke
Temperatures in some parts of the Arctic this year have risen as much as 30C. Because of global heating the Polar Jet Stream is slowing down, which in turn can lead to extended punishing heat waves in the Arctic. Another effect of global heating is an increase in lightning strikes in the Arctic.  This combination of extreme high temperatures, slower air circulation, and increased lightning
11 Sep 12:34

Ships Are Increasingly Spoofing Their Location

by Jonathan Crowe

Ships spoofing their location is an increasing problem, Anatoly Kurmanaev reports for the New York Times. All large ships are required to carry an AIS transponder that transmits the ship’s ID and position, but some ships are starting to find a way around that.

[O]ver the past year, Windward, a large maritime data company that provides research to the United Nations, has uncovered more than 500 cases of ships manipulating their satellite navigation systems to hide their locations. The vessels carry out the deception by adopting a technology that until recently was confined to the world’s most advanced navies. The technology, in essence, replicates the effect of a VPN cellphone app, making a ship appear to be in one place, while physically being elsewhere.

Its use has included Chinese fishing fleets hiding operations in protected waters off South America, tankers concealing stops in Iranian oil ports, and container ships obfuscating journeys in the Middle East. A U.S. intelligence official, who discussed confidential government assessments on the condition of anonymity, said the deception tactic had already been used for weapons and drug smuggling.

We’ve seen examples of this before, but this is starting to look like an endemic problem.

04 Sep 11:21

McPhee’s Maps of Alberta and Saskatchewan

by Jonathan Crowe

Thumbnails of Alex McPhee's maps of Alberta and SaskatchewanAlex McPhee’s ridiculously detailed map of Alberta, which included things like the area burned in the 2016 Fort McMurray fire and the province’s Hutterite colonies, came out in print form—specifically, in the form of a 42″×68″ wall map—last year. Now he’s done it again: a similarly detailed 36″×66″ wall map of his home province of Saskatchewan, which he’s just sent to the printer. Each map starts at $60.

28 Aug 12:09

Persepolis in 3D

by Keir Clarke
500 years before the birth of Christ the city of Persepolis served as the capital of the largest empire in the world. Today what is left of the city is mostly architectural ruins. It is therefore now hard to imagine the magnificence and splendor of what was once one of the most awe-inspiring cities on Earth.Luckily you now don't have to imagine what Persoplis used to look like because the Getty
24 Jun 20:56

A Brief History of Time & Space

by Keir Clarke
the shifting borders of the Holy Roman Empire from 1000-1750 Point in History is an interactive map which allows you to explore country and regional borders over time. The map uses historical boundaries data from the Historical Boundaries Project in order to show how the boundaries of countries around the world have developed and changed through history.If you click anywhere on the map a
19 Jun 19:51

URL Map

by Keir Clarke
Map URL is an impressive interactive map which you can control by using a number of query string parameters within the map's URL address. Using the available query string parameters you can center your map at any location in the world, set the zoom level of the map and even add a marker at a specified location. For example the map in the screenshot above was created using the URL address: https
07 May 14:54

Mercator: Extreme

by Jonathan Crowe

To follow-up on xkcd’s Madagascator cartoon (previously), I missed the fact that clicking on the cartoon at the xkcd website actually did something, but Keir caught it: it links to Drew Roos’s Mercator: Extreme, an online tool that allows you to have some fun with the Mercator projection’s excessive polar distortion by making any point on the planet the North Pole and which clearly served as Randall’s inspiration.

01 May 23:22

Updates to Maps of Historical Earthquakes, Tsunami and Volcanic Eruptions

by Jonathan Crowe

Significant Earthquakes 2150 B.C. to A.D. 2022 (NOAA/NCEI)

Every two years or so, NOAA’s National Centers for Environmental Information updates poster maps based on its Global Historical Tsunami, Significant Earthquake and Significant Volcanic Eruption databases; the 2022 editions are now available. The posters, made in collaboration with the International Tsunami Information Center, are distributed to emergency response personnel; they provide a historical overview of where earthquakes or eruptions took place, or tsunami originated, going back literally millenia. The maps can be downloaded in PDF format: Significant Earthquakes 2150 B.C. to A.D. 2022, Tsunami Sources 1610 B.C. to A.D. 2022, and Significant Volcanic Eruptions 4360 B.C. to A.D. 2022.

05 Apr 16:28

Mapping Daylight Saving Time

by Jonathan Crowe

Daylight saving time has been in the news again, with the U.S. Senate voting to make it permanent year-round. So it’s worth looking at maps that explore the impact of standard time and daylight saving time, and time zones in general, on the time of sunrise and sunset. And as far as the United States is concerned, that means looking at some maps by Andy Woodruff, who’s been exploring this question since at least this 2015 blog post. Which was supplanted in 2019 by this so-called gripe assistant tool to help you quantify your whining about the biannual change.

Map of optimal time zone boundaries (Andy Woodruff)
Andy Woodruff, Axis Maps (Twitter)

Finally, last week Andy produced the above infographic to illustrate your ideal time zone based on when you think your ideal sunrise and sunset is.

See also CityLab’s coverage (now subscriber-only), which is pretty Woodruff-heavy.

05 Apr 16:26

Uninhabitable Earth

by Keir Clarke
Yesterday the Intergovernmental Panel on Climate Change (IPCC) released its latest report on climate change. In the report the IPCC warns that the Earth is currently heading towards increased temperatures of more than 3C.This will have catastrophic effects for life on Earth. In Where the Earth Will be Uninhabitable the Berliner Morgenpost has used a 3D globe to highlight all the locations in
05 Apr 16:26

The Fantastical Streetnames of Gothenburg

by Keir Clarke
After World War II the UK government decided to develop a number of new towns in order to help relocate people away from the country's most congested cities. I spent most of my childhood growing up in Crawley, one of these new towns which was built in southern England. When the town planners of Crawley mapped out their future town they decided to create clusters of streets with thematically
05 Apr 16:25

This is NOT a Map

by Keir Clarke
Argleton Harbour This is Argleton Harbour, situated on the north-east coast of England.It is now a sleepy seaside town, relying on tourism and a small fishing industry to survive. It was once a busy port town, shipping coal to northern Europe, and unloading cargo (mainly from the Baltic countries). Like many northern towns Argleton Harbour hasn't yet recovered from the closure of England's coal